Paint and coating manufacturer Sherwin-Williams (NYSE: SHW) announced better-than-expected revenue in Q3 2026, with revenue up 7.9% year on year to $6.86 billion. Its non-GAAP profit of $3.63 per share was 1.6% below analysts’ consensus estimates.
For more on Sherwin-Williams, read our free full research report.
Sherwin-Williams (SHW) Q3 2026 highlights:
- Revenue $6.86 billion vs S&P analysts’ consensus estimates of $6.77 billion (7.9% year-on-year growth, 1.3% beat)
- Adjusted EPS $3.63 vs S&P analysts’ consensus estimates of $3.69 (1.6% miss)
- Adjusted EBITDA $1.40 billion vs analysts’ consensus estimates of $1.43 billion (20.5% margin, 1.9% miss)
- Adjusted EPS guidance Management reiterated its full-year adjusted EPS guidance of $12 at the midpoint
- Operating margin 17.6%, in line with the same quarter last year
- Market capitalization $80.88 billion
"Sherwin-Williams third quarter performance demonstrated the resilience of our Company and the strength of our strategy in a challenging demand environment. Despite muted underlying market volumes, we continued to win new customers, increase share-of-wallet and deliver sales growth across all three reportable segments, at or above our guidance, supported by the differentiated value and productivity our solutions deliver to customers. At the same time, we took disciplined pricing and cost actions to address inflationary pressures, thoughtfully timed with our customers in mind," said Chair, President and Chief Executive Officer Heidi G. Petz. "Gross margin was primarily impacted in the quarter by higher raw material and supply chain related costs and by mix, including dilution from Suvinil and higher growth in lower margin reportable segments. Excluding the dilutive impact of the Suvinil acquisition, our year-to-date gross margin is flat compared to the prior year. SG&A as a percent of sales decreased in the quarter, as we continue to identify and implement efficiencies throughout our Company. Adjusted EBITDA and adjusted diluted earnings per share both grew over last year's third quarter levels. We returned $749.0 million to shareholders in the quarter through dividends and share repurchases. Our team remains focused on serving our customers and controlling what we can control to continue top and bottom-line growth."
Revenue growth
A company’s long-term revenue performance can indicate its overall quality. Even a poor business can perform well for one or two quarters, but a high-quality one grows for years. Sherwin-Williams’s 4.8% annualized revenue growth over the last five years was tepid, falling short of the industrials sector standard.
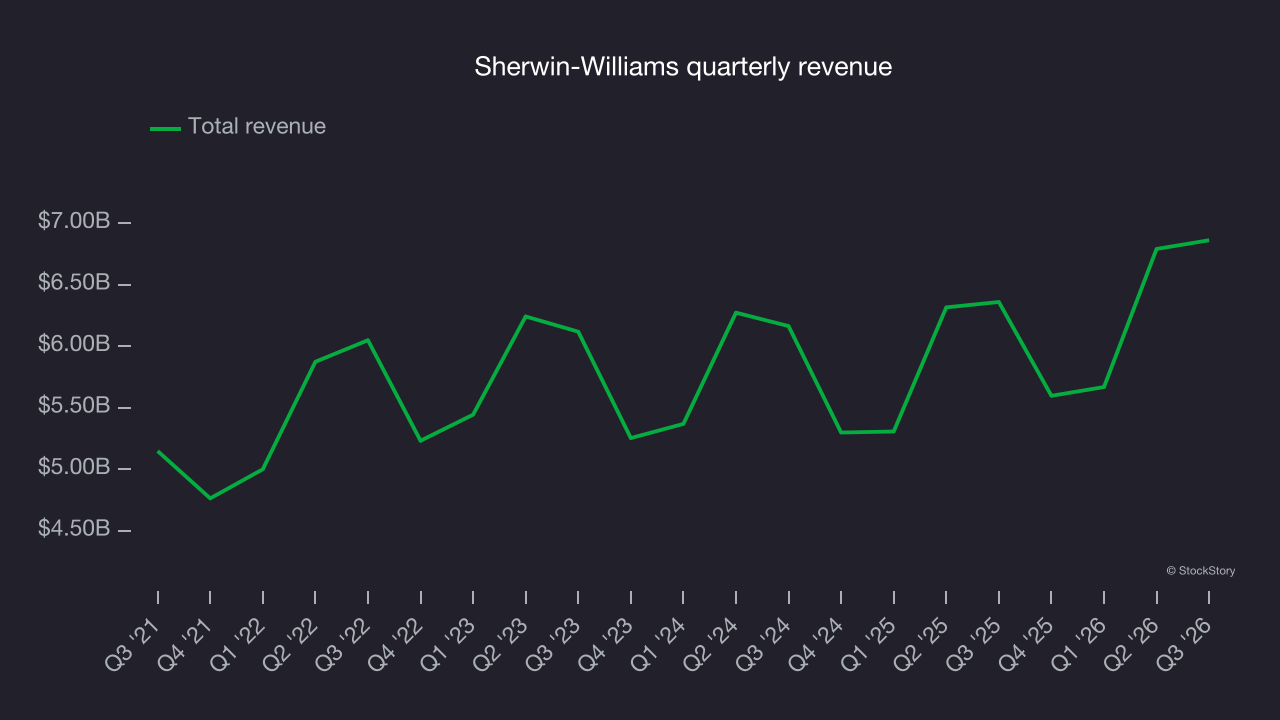
Long-term growth is the most important, but within industrials, a half-decade historical view may miss new industry trends or demand cycles. Sherwin-Williams’s annualized revenue growth of 4% over the last two years aligns with its five-year trend, suggesting its demand was consistently weak. 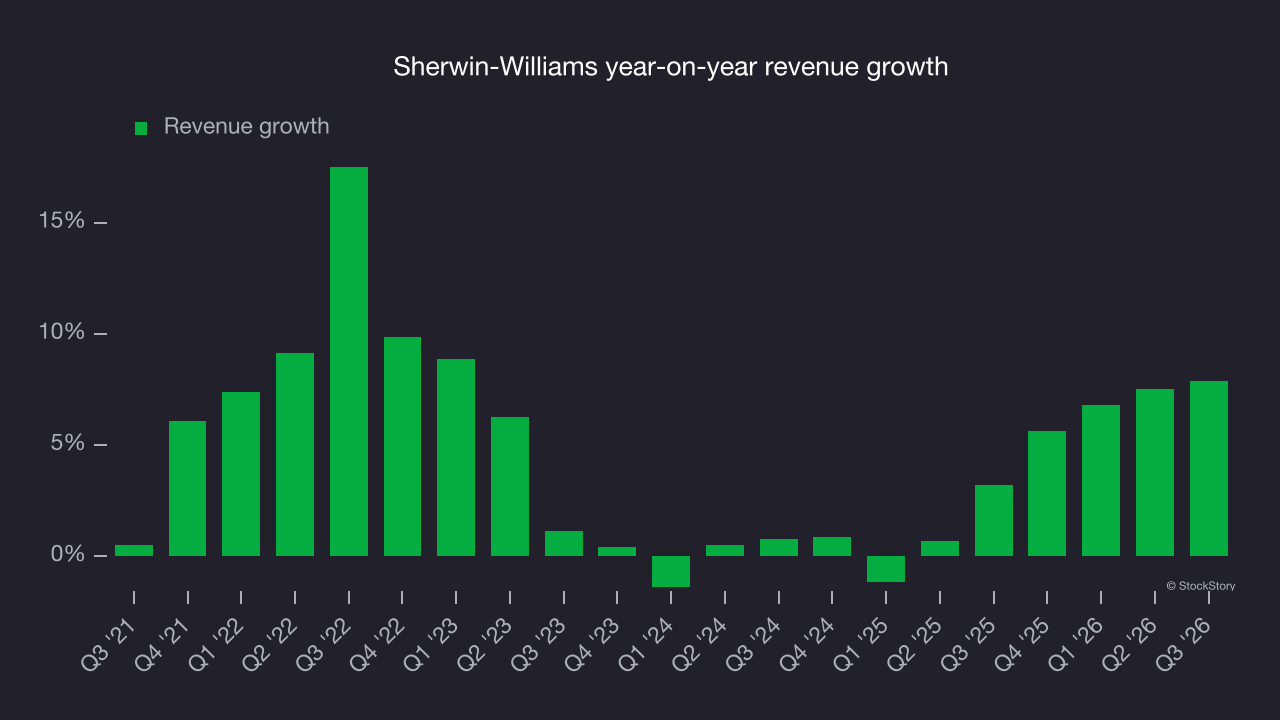
This quarter, Sherwin-Williams reported year-on-year revenue growth of 7.9%, and its $6.86 billion of revenue exceeded Wall Street’s consensus estimates by 1.3%.
Looking ahead, sell-side analysts expect revenue to grow 4.2% over the next 12 months, according to S&P, similar to its two-year rate. This projection is underwhelming and implies its newer products and services will not yet drive faster revenue growth.
Operating margin
Sherwin-Williams has been an efficient company over the last five years. It was one of the more profitable businesses in the industrials sector, with an average operating margin of 15.3%. This result is unsurprising given its high gross margin baseline.
Analyzing the trend in its profitability, Sherwin-Williams’s operating margin rose by 3.8 percentage points over the last five years, as its revenue growth gave it operating leverage.
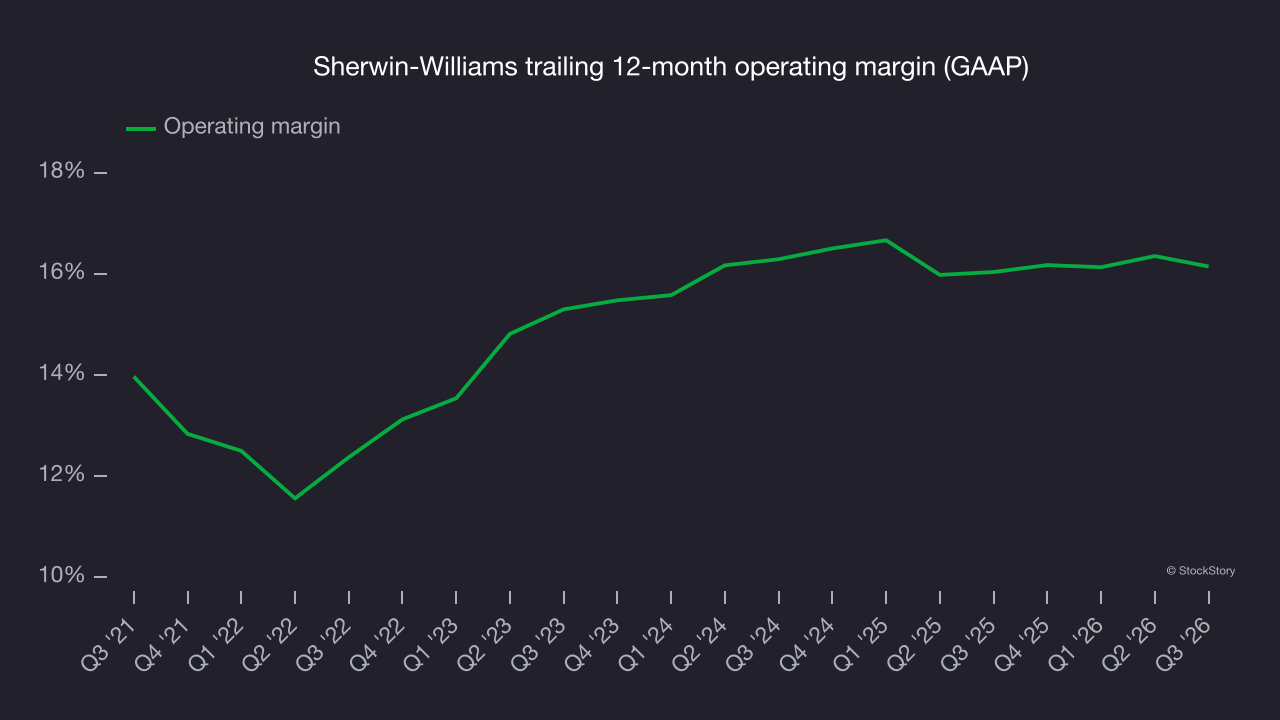
This quarter, Sherwin-Williams generated an operating margin of 17.6%, in line with the same quarter last year. This indicates the company’s cost structure has recently been stable.
Earnings per share
Revenue trends explain a company’s historical growth, but the long-term change in earnings per share (EPS) points to the profitability of that growth. For example, a company could inflate its revenue through excessive spending on advertising and promotions.
Sherwin-Williams’s EPS grew at a 7% compounded annual growth rate over the last five years. On the positive side, this performance outpaced its 4.8% annualized revenue growth, indicating the company became more profitable on a per-share basis as it expanded.
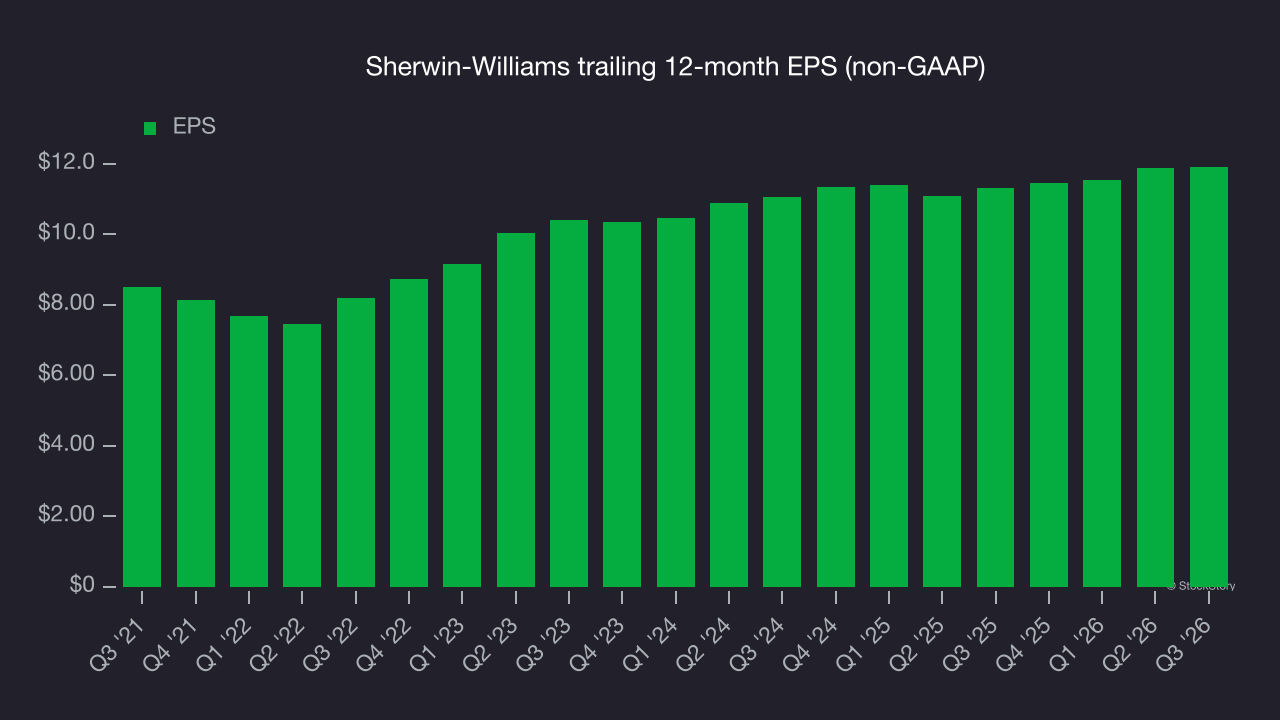
A closer look at Sherwin-Williams’s earnings can give us a better understanding of its performance. As mentioned earlier, Sherwin-Williams’s operating margin was flat this quarter but expanded by 3.8 percentage points over the last five years. On top of that, its share count shrank by 8.9%. These are positive signs for shareholders because improving profitability and share buybacks boost EPS growth relative to revenue growth. 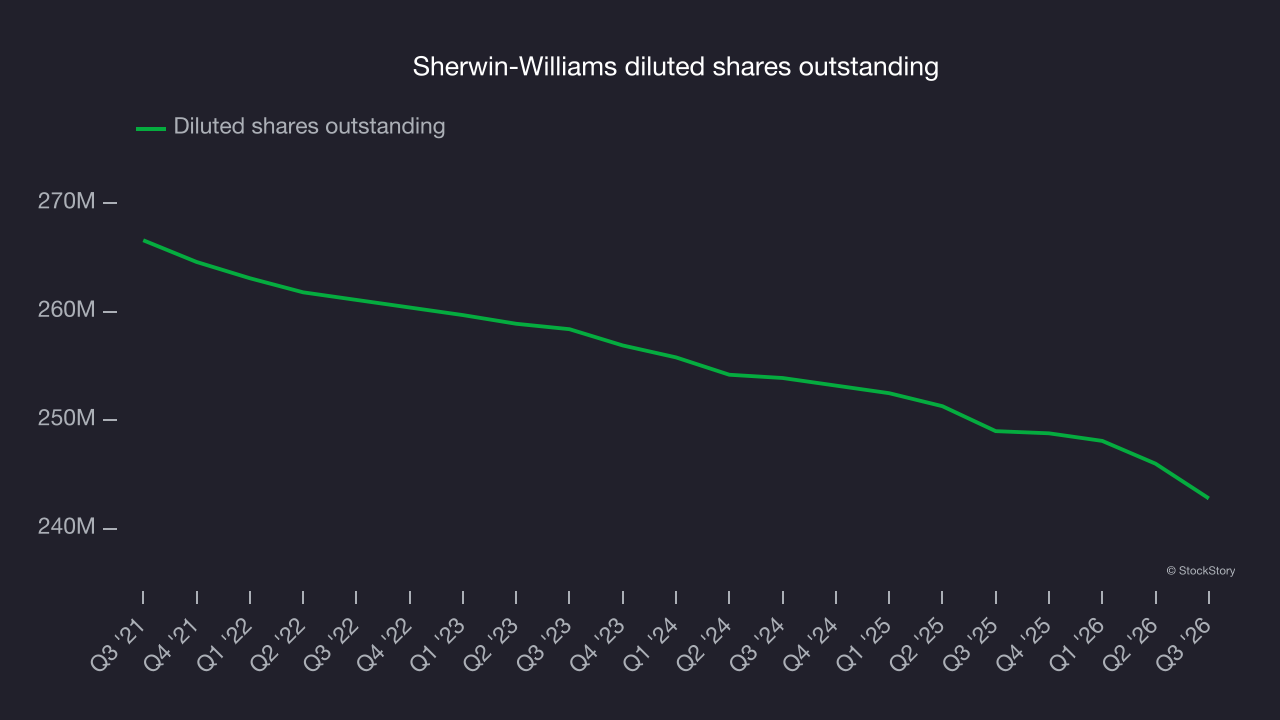
As with revenue, examining EPS over a shorter period can reveal a change in the business.
Sherwin-Williams’s two-year annual EPS growth of 3.8% was lower than its five-year trend.
In Q3, Sherwin-Williams reported adjusted EPS of $3.63, up from $3.59 in the same quarter last year. Despite growing year on year, EPS slightly missed analysts’ consensus estimates. Over the next 12 months, Wall Street expects Sherwin-Williams’s full-year EPS to grow 11.8% from $11.91 to $13.31, according to S&P.
Key takeaways from Sherwin-Williams’s Q3 results
Sherwin-Williams’s narrow revenue beat against analysts’ consensus estimates was a positive, but misses on EBITDA and EPS left room for a better quarter. Shares fell 4.5% to $320.01 immediately after the report.
Sherwin-Williams’s latest quarter was underwhelming. One earnings report doesn’t define a company’s quality, though, so it’s worth examining whether the stock is a buy at the current price. The latest quarter is only one piece of the longer-term business quality picture. Quality, when combined with valuation, can help determine if the stock is a buy. For more on those factors, read our full research report here (it’s free).