
Waste and recycling services provider Quest Resource (NASDAQ: QRHC) missed Wall Street’s revenue expectations in Q1 CY2026, with sales falling 9.8% year on year to $61.74 million. Its GAAP loss of $0.11 per share was in line with analysts’ consensus estimates.
Is now the time to buy Quest Resource? Find out by accessing our full research report, it’s free.
Quest Resource (QRHC) Q1 CY2026 Highlights:
- Revenue: $61.74 million vs analyst estimates of $62.2 million (9.8% year-on-year decline, 0.7% miss)
- EPS (GAAP): -$0.11 vs analyst estimates of -$0.10 (in line)
- Adjusted EBITDA: $1.79 million vs analyst estimates of $1.8 million (2.9% margin, relatively in line)
- Operating Margin: 0.4%, up from -3% in the same quarter last year
- Market Capitalization: $23.06 million
“Throughout the first quarter, we experienced steady improvement, which is consistent with the seasonal acceleration,” said Perry W. Moss, Quest’s Chief Executive Officer.
Company Overview
Recycling corporate waste to help companies be more sustainable, Quest Resource (NASDAQ: QRHC) is a provider of waste and recycling services.
Revenue Growth
A company’s long-term performance is an indicator of its overall quality. Any business can put up a good quarter or two, but the best consistently grow over the long haul. Luckily, Quest Resource’s sales grew at an incredible 17.6% compounded annual growth rate over the last five years. Its growth beat the average industrials company and shows its offerings resonate with customers.
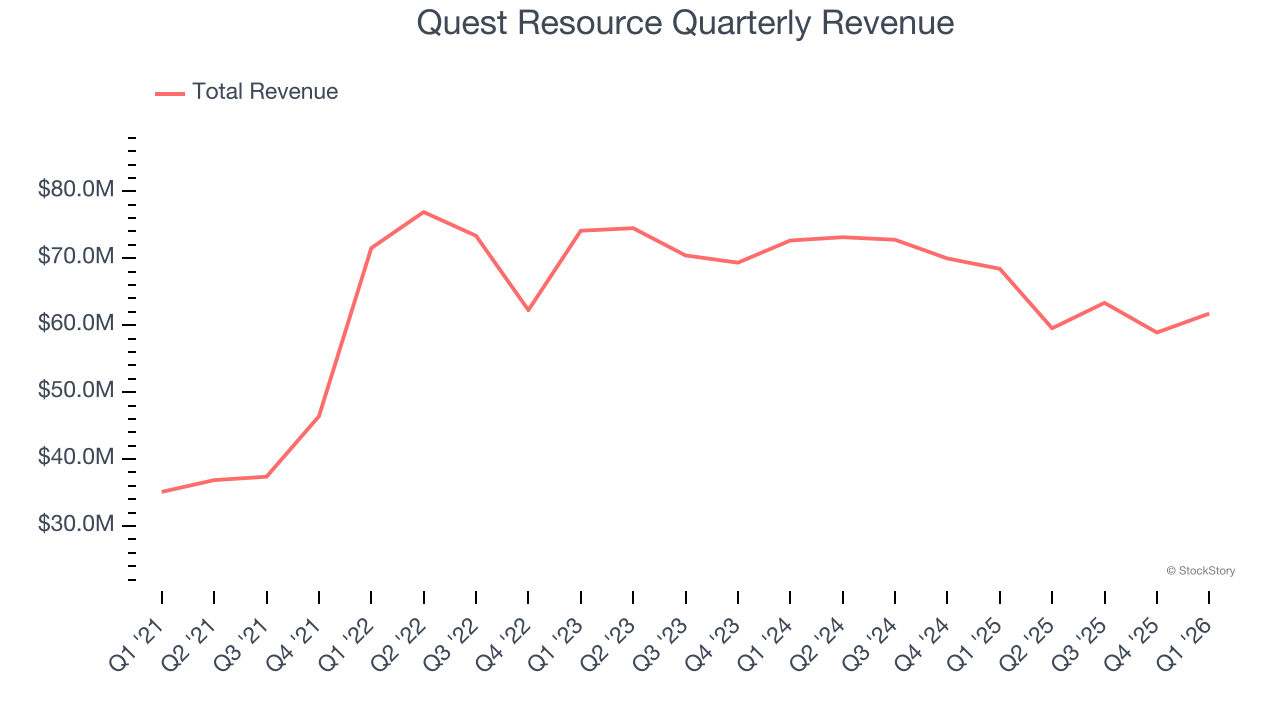
Long-term growth is the most important, but within industrials, a half-decade historical view may miss new industry trends or demand cycles. Quest Resource’s recent performance marks a sharp pivot from its five-year trend as its revenue has shown annualized declines of 7.9% over the last two years. 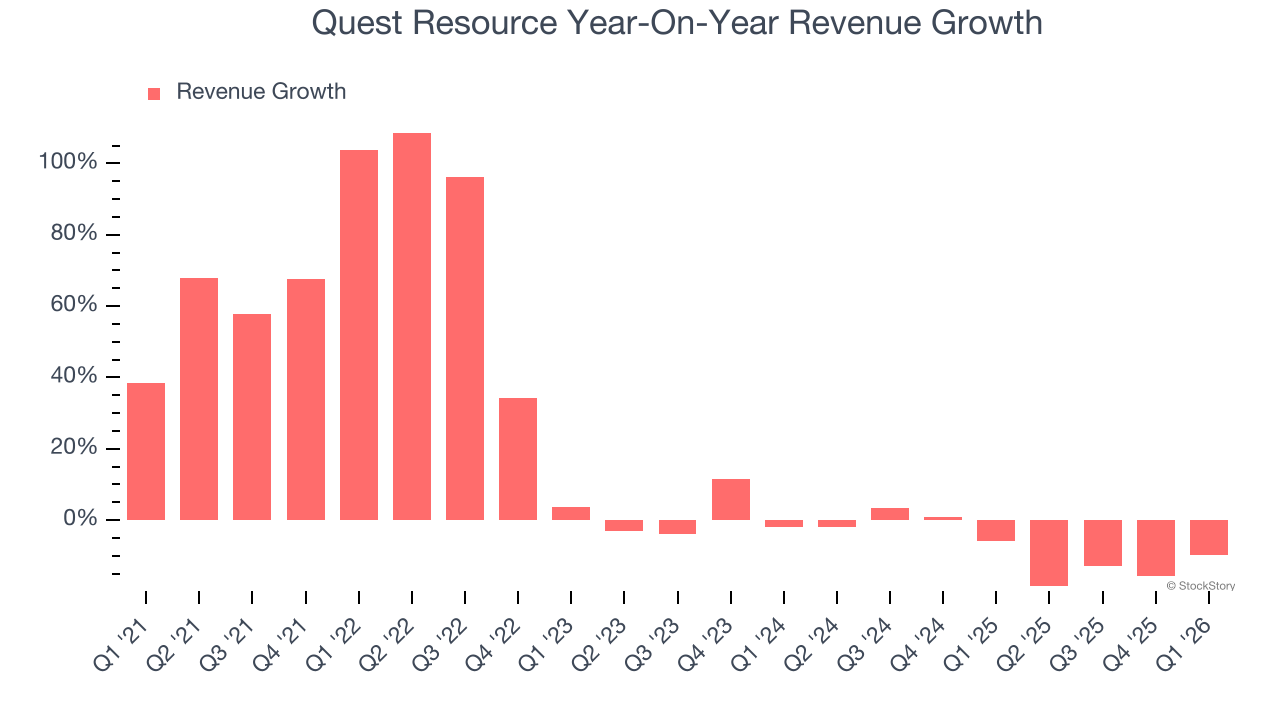
This quarter, Quest Resource missed Wall Street’s estimates and reported a rather uninspiring 9.8% year-on-year revenue decline, generating $61.74 million of revenue.
Looking ahead, sell-side analysts expect revenue to grow 6.8% over the next 12 months. While this projection suggests its newer products and services will fuel better top-line performance, it is still below average for the sector.
WHILE YOU’RE HERE: The Next Palantir? One satellite company captures images of every point on Earth. Every single day. The Pentagon wants it. Hedge funds are using it to beat earnings. You’ve probably never heard of it.
This is what the early days of Palantir looked like before it became a $437 billion giant. Same playbook. Different technology. If you missed Palantir, you need to see this. Claim The Stock Ticker for Free HERE.
Operating Margin
Quest Resource was profitable over the last five years but held back by its large cost base. Its average operating margin of 1% was weak for an industrials business. This result isn’t too surprising given its low gross margin as a starting point.
Looking at the trend in its profitability, Quest Resource’s operating margin decreased by 1.4 percentage points over the last five years. This raises questions about the company’s expense base because its revenue growth should have given it leverage on its fixed costs, resulting in better economies of scale and profitability. Quest Resource’s performance was poor no matter how you look at it - it shows that costs were rising and it couldn’t pass them onto its customers.
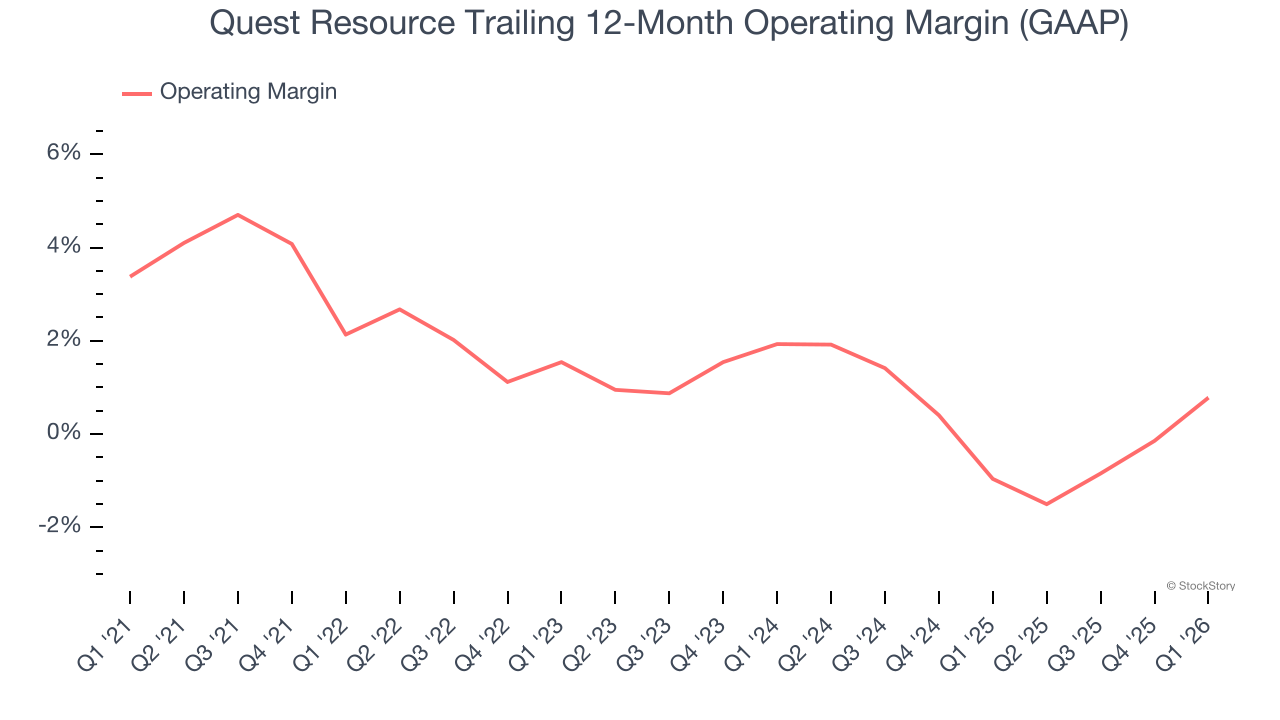
In Q1, Quest Resource’s breakeven margin was 0.4%, up 3.3 percentage points year on year. The increase was encouraging, and because its operating margin rose more than its gross margin, we can infer it was more efficient with expenses such as marketing, R&D, and administrative overhead.
Earnings Per Share
We track the long-term change in earnings per share (EPS) for the same reason as long-term revenue growth. Compared to revenue, however, EPS highlights whether a company’s growth is profitable.
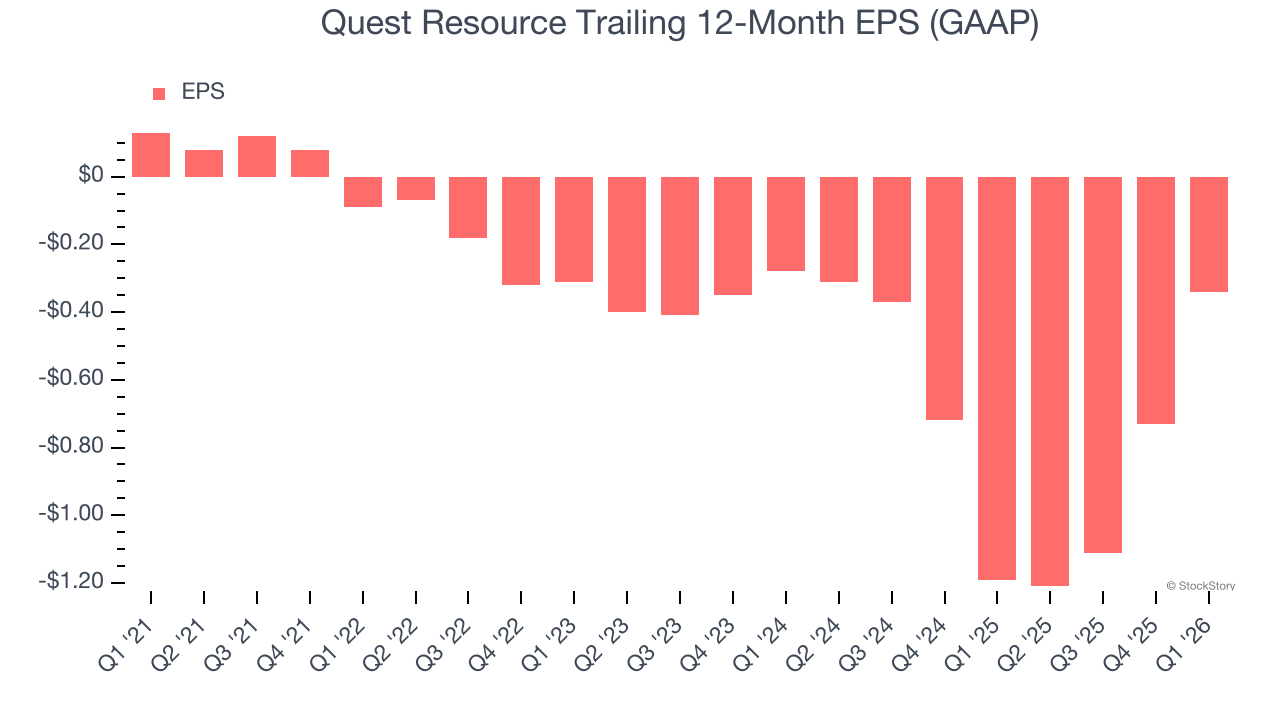
Sadly for Quest Resource, its EPS declined by 35.8% annually over the last five years while its revenue grew by 17.6%. This tells us the company became less profitable on a per-share basis as it expanded.
We can take a deeper look into Quest Resource’s earnings to better understand the drivers of its performance. As we mentioned earlier, Quest Resource’s operating margin expanded this quarter but declined by 1.4 percentage points over the last five years. Its share count also grew by 9.2%, meaning the company not only became less efficient with its operating expenses but also diluted its shareholders. 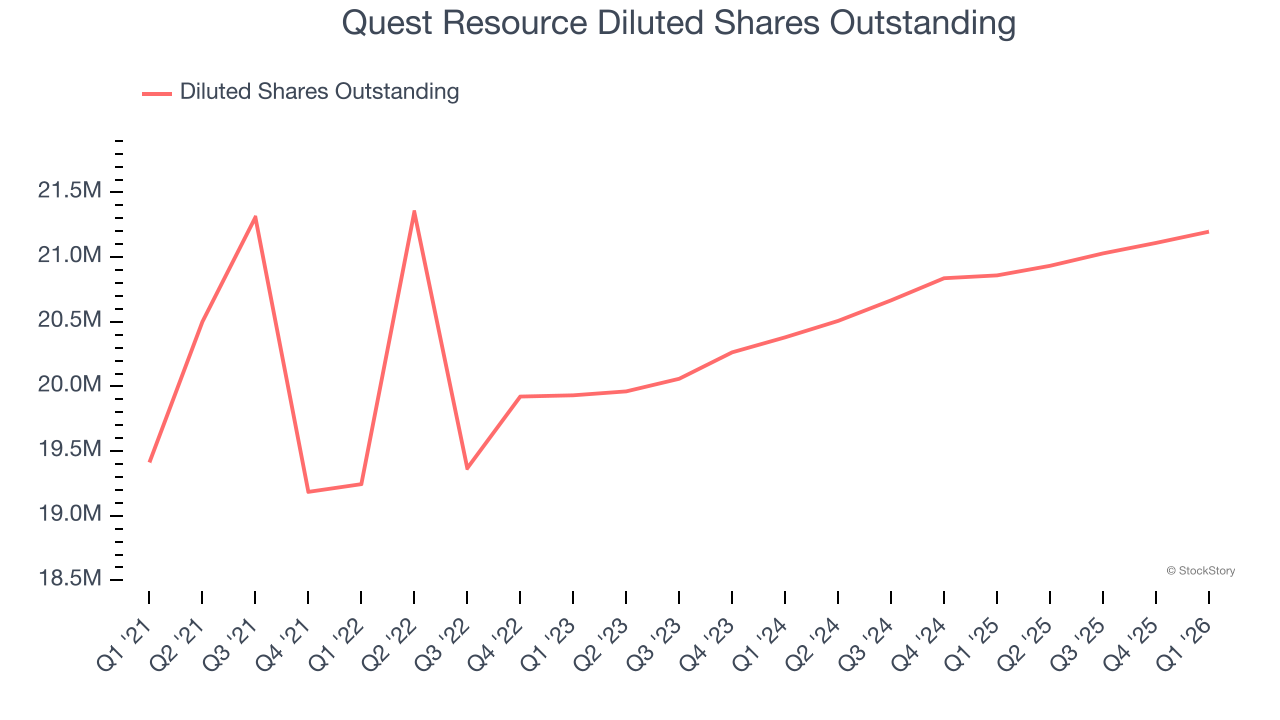
Like with revenue, we analyze EPS over a shorter period to see if we are missing a change in the business.
For Quest Resource, its two-year annual EPS declines of 10.2% show it’s still underperforming. These results were bad no matter how you slice the data.
In Q1, Quest Resource reported EPS of negative $0.11, up from negative $0.50 in the same quarter last year. Despite growing year on year, this print missed analysts’ estimates. We also like to analyze expected EPS growth based on Wall Street analysts’ consensus projections, but there is insufficient data.
Key Takeaways from Quest Resource’s Q1 Results
We were impressed by how significantly Quest Resource blew past analysts’ adjusted operating income expectations this quarter. On the other hand, its EPS was in line and its revenue fell slightly short of Wall Street’s estimates. Overall, this was a softer quarter. The stock traded down 4.2% to $1.04 immediately following the results.
Quest Resource may have had a tough quarter, but does that actually create an opportunity to invest right now? We think that the latest quarter is only one piece of the longer-term business quality puzzle. Quality, when combined with valuation, can help determine if the stock is a buy. We cover that in our actionable full research report which you can read here (it’s free).