
Medical technology company Enovis Corporation (NYSE: ENOV) met Wall Street’s revenue expectations in Q2 CY2026, with sales up 3.2% year on year to $582.8 million. The company’s outlook for the full year was close to analysts’ estimates with revenue guided to $2.34 billion at the midpoint. Its non-GAAP profit of $0.90 per share was 6.3% above analysts’ consensus estimates.
Is now the time to buy Enovis? Find out by accessing our full research report, it’s free.
Enovis (ENOV) Q2 CY2026 Highlights:
- Revenue: $582.8 million vs analyst estimates of $581.8 million (3.2% year-on-year growth, in line)
- Adjusted EPS: $0.90 vs analyst estimates of $0.85 (6.3% beat)
- Adjusted EBITDA: $104.3 million vs analyst estimates of $103.2 million (17.9% margin, 1.1% beat)
- The company reconfirmed its revenue guidance for the full year of $2.34 billion at the midpoint
- Management reiterated its full-year Adjusted EPS guidance of $3.63 at the midpoint
- EBITDA guidance for the full year is $430 million at the midpoint, in line with analyst expectations
- Operating Margin: 3%, up from -3% in the same quarter last year
- Free Cash Flow Margin: 5.3%, up from 0.6% in the same quarter last year
- Market Capitalization: $1.74 billion
“Our second-quarter results reflect a more focused organization and a portfolio that has been meaningfully reshaped over the past several years,” said Damien McDonald, Chief Executive Officer of Enovis.
Company Overview
With a focus on helping patients regain or maintain their natural motion, Enovis (NYSE: ENOV) develops and manufactures medical devices for orthopedic care, from injury prevention and pain management to joint replacement and rehabilitation.
Revenue Growth
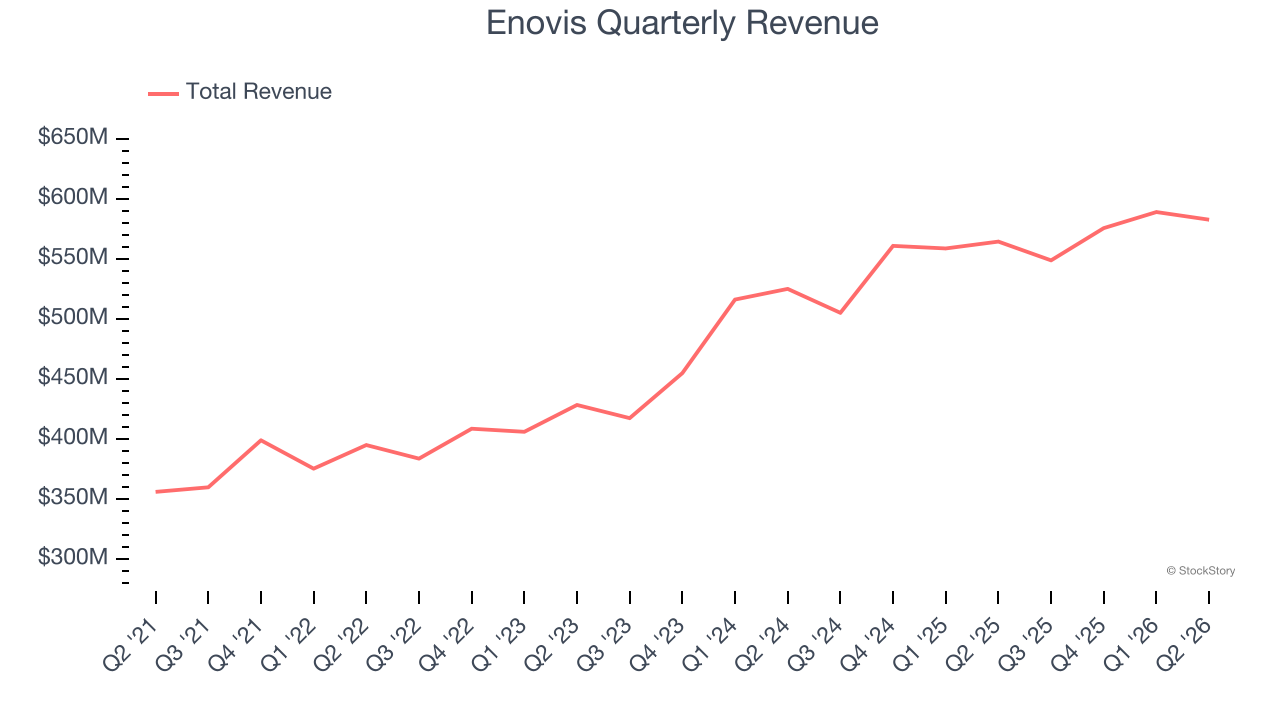
Reviewing a company’s long-term sales performance reveals insights into its quality. Any business can experience short-term success, but top-performing ones enjoy sustained growth for years. Unfortunately, Enovis struggled to consistently increase demand as its $2.30 billion of sales for the trailing 12 months was close to its revenue five years ago. This was below our standards and suggests it’s a low quality business.
Long-term growth is the most important, but within healthcare, a half-decade historical view may miss new innovations or demand cycles. Enovis’s annualized revenue growth of 9.5% over the last two years is above its five-year trend, suggesting some bright spots. 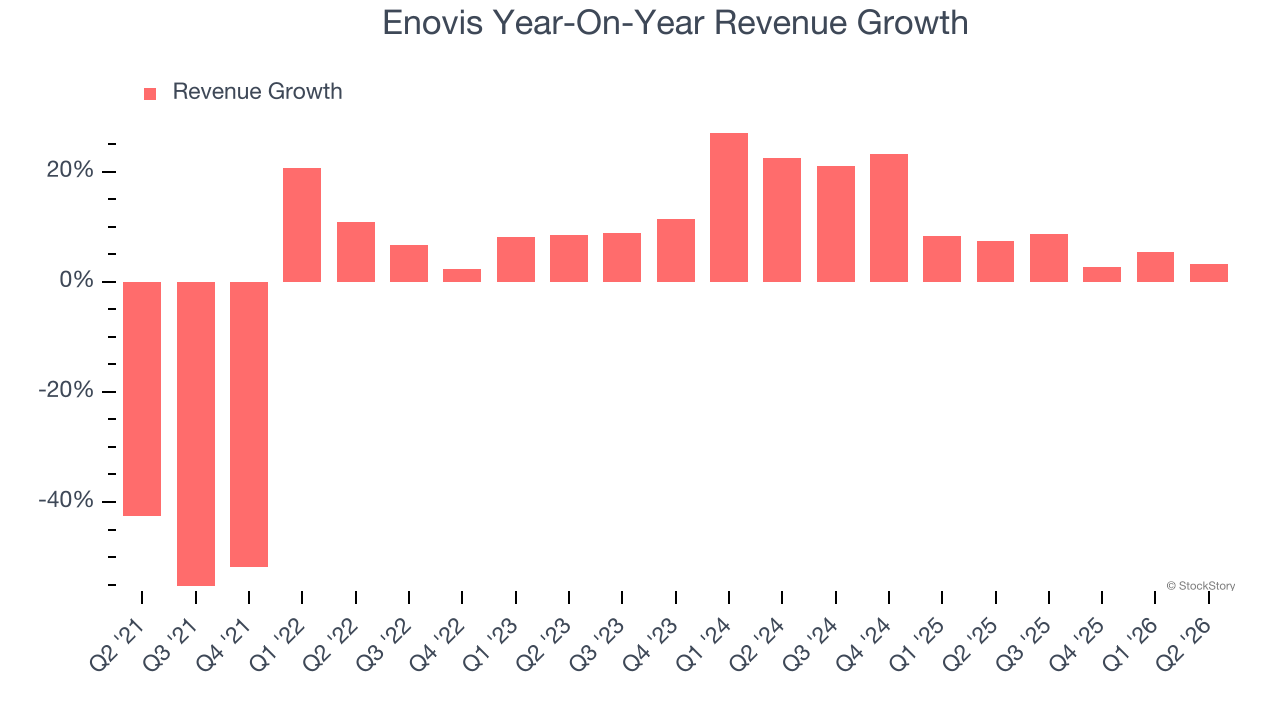
This quarter, Enovis grew its revenue by 3.2% year on year, and its $582.8 million of revenue was in line with Wall Street’s estimates.
Looking ahead, sell-side analysts expect revenue to grow 4.8% over the next 12 months, a deceleration versus the last two years. This projection is underwhelming and indicates its products and services will face some demand challenges.
WHILE YOU’RE HERE: The Next Palantir? One satellite company captures images of every point on Earth. Every single day. The Pentagon wants it. Hedge funds are using it to beat earnings. You’ve probably never heard of it.
This is what the early days of Palantir looked like before it became a giant. Same playbook. Different technology. If you missed Palantir, you need to see this. Claim The Stock Ticker for Free HERE.
Adjusted Operating Margin
Enovis has done a decent job managing its cost base over the last five years. The company has produced an average adjusted operating margin of 10.9%, higher than the broader healthcare sector.
Analyzing the trend in its profitability, Enovis’s adjusted operating margin rose by 1.2 percentage points over the last five years, showing its efficiency has improved.
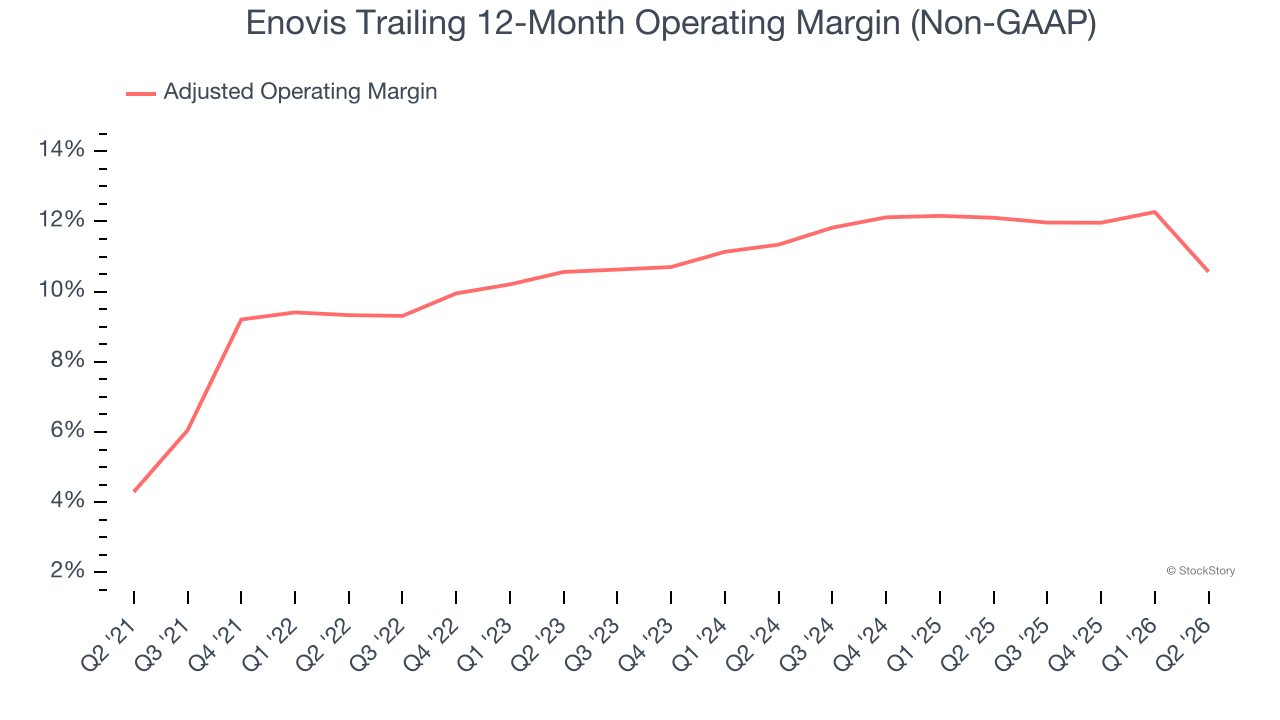
This quarter, Enovis generated an adjusted operating margin profit margin of 4.5%, down 6.7 percentage points year on year. This contraction shows it was less efficient because its expenses grew faster than its revenue.
Earnings Per Share
We track the long-term change in earnings per share (EPS) for the same reason as long-term revenue growth. Compared to revenue, however, EPS highlights whether a company’s growth is profitable.
Sadly for Enovis, its EPS declined by 9.5% annually over the last five years while its revenue was flat. However, its adjusted operating margin actually improved during this time, telling us that non-fundamental factors such as interest expenses and taxes affected its ultimate earnings.
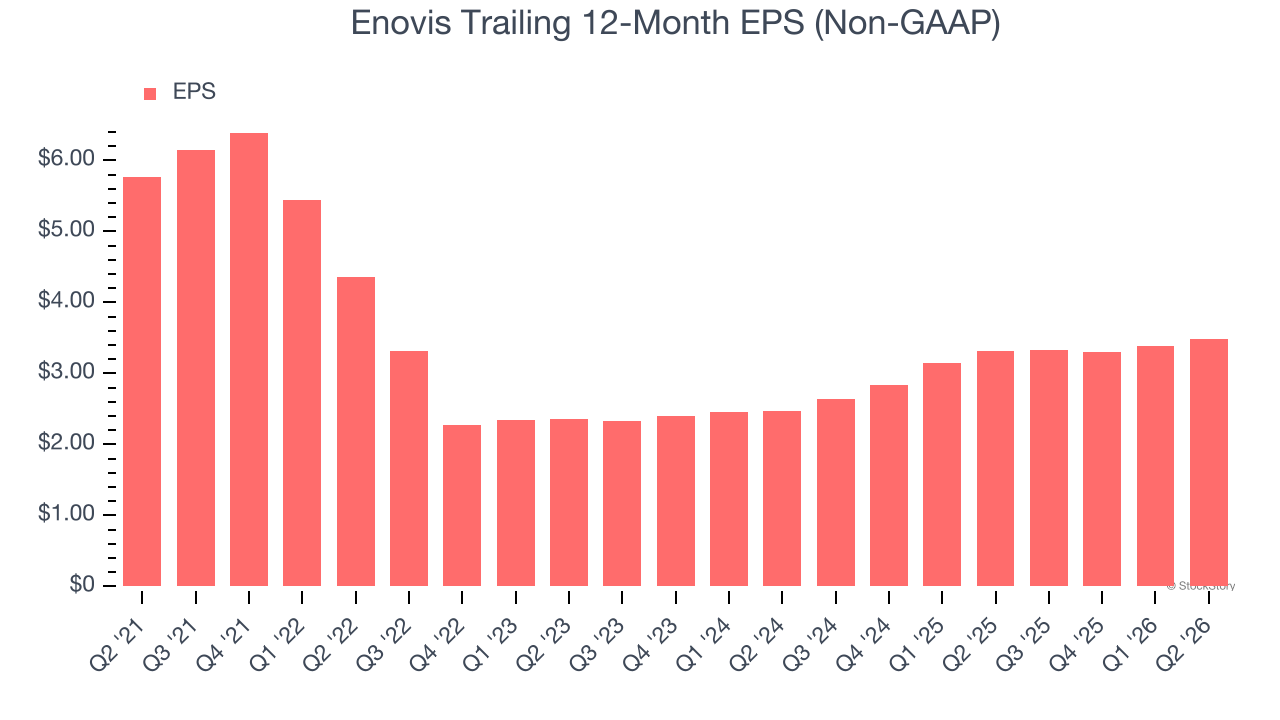
We can take a deeper look into Enovis’s earnings to better understand the drivers of its performance. A five-year view shows Enovis has diluted its shareholders, growing its share count by 11.7%. This dilution overshadowed its increased operational efficiency and has led to lower per share earnings. Taxes and interest expenses can also affect EPS but don’t tell us as much about a company’s fundamentals. 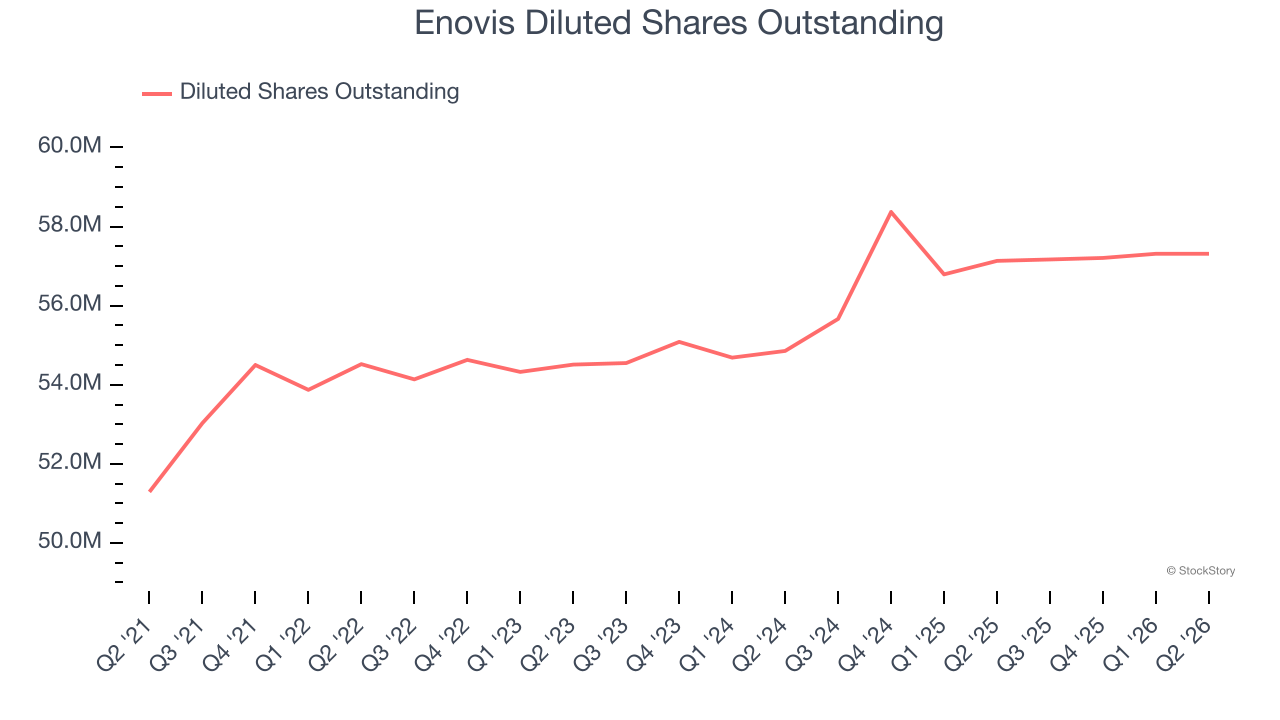
In Q2, Enovis reported adjusted EPS of $0.90, up from $0.79 in the same quarter last year. This print beat analysts’ estimates by 6.3%. Over the next 12 months, Wall Street expects Enovis’s full-year EPS to grow 12.3% from $3.49 to $3.92.
Key Takeaways from Enovis’s Q2 Results
It was good to see Enovis beat analysts’ EPS expectations this quarter. On the other hand, its full-year EPS guidance slightly missed. Overall, this was a softer quarter. The stock remained flat at $30.24 immediately following the results.
Should you buy the stock or not? What happened in the latest quarter matters, but not as much as longer-term business quality and valuation, when deciding whether to invest in this stock. We cover that in our actionable full research report which you can read here (it’s free).