Environmental and industrial services company Clean Harbors (NYSE: CLH) reported Q2 CY2026 results topping the market’s revenue expectations, with sales up 11.9% year on year to $1.74 billion. Its GAAP profit of $3.22 per share was 13.7% above analysts’ consensus estimates.
Is now the time to buy Clean Harbors? Find out by accessing our full research report, it’s free.
Clean Harbors (CLH) Q2 CY2026 Highlights:
- Revenue: $1.74 billion vs analyst estimates of $1.63 billion (11.9% year-on-year growth, 6.1% beat)
- EPS (GAAP): $3.22 vs analyst estimates of $2.83 (13.7% beat)
- Adjusted EBITDA: $409 million vs analyst estimates of $369 million (23.6% margin, 10.9% beat)
- EBITDA guidance for the full year is $1.38 billion at the midpoint, above analyst estimates of $1.30 billion
- Operating Margin: 15.5%, up from 13.6% in the same quarter last year
- Free Cash Flow Margin: 6.5%, down from 8.6% in the same quarter last year
- Market Capitalization: $16.05 billion
“Our record second-quarter results demonstrate the substantial momentum we achieved in both of our operating segments,” said Mike Battles, Co-Chief Executive Officer.
Company Overview
Established in 1980, Clean Harbors (NYSE: CLH) provides environmental and industrial services like hazardous and non-hazardous waste disposal and emergency spill cleanups.
Revenue Growth
A company’s long-term performance is an indicator of its overall quality. Any business can experience short-term success, but top-performing ones enjoy sustained growth for years. Over the last five years, Clean Harbors grew its sales at an exceptional 13.5% compounded annual growth rate. Its growth beat the average industrials company and shows its offerings resonate with customers, a helpful starting point for our analysis.
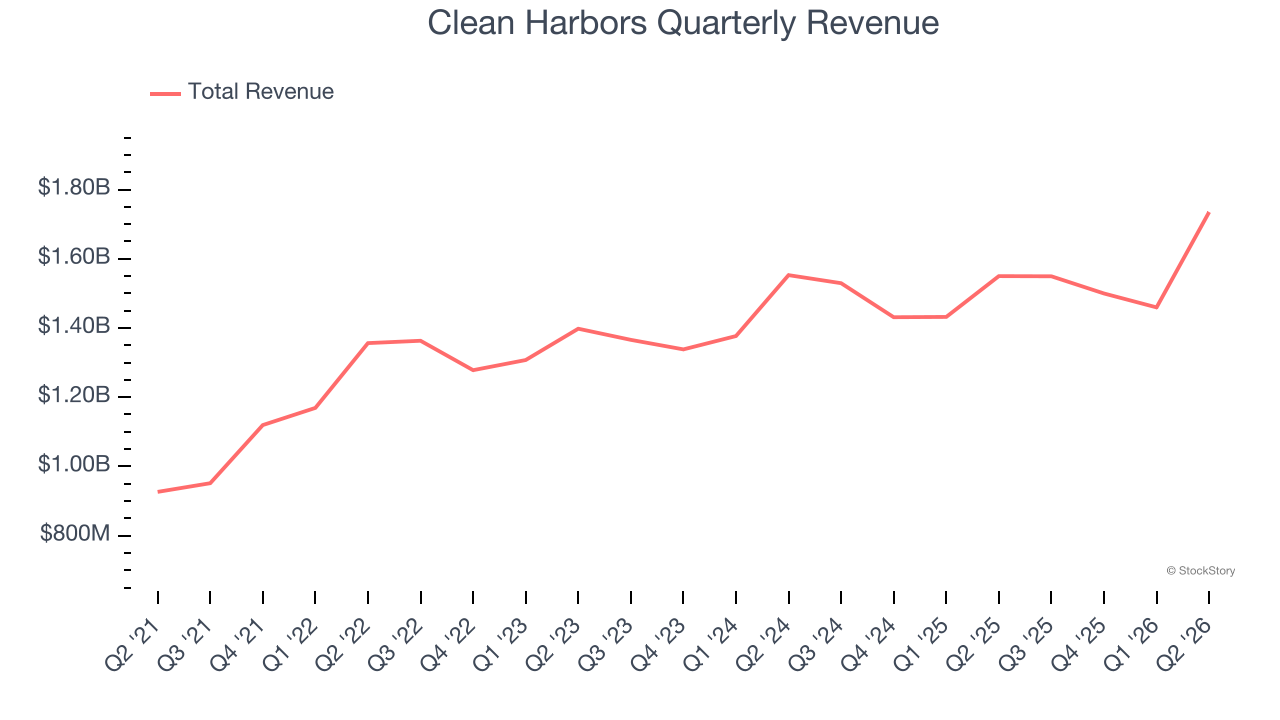
We at StockStory place the most emphasis on long-term growth, but within industrials, a half-decade historical view may miss cycles, industry trends, or a company capitalizing on catalysts such as a new contract win or a successful product line. Clean Harbors’s recent performance shows its demand has slowed significantly as its annualized revenue growth of 5.3% over the last two years was well below its five-year trend. 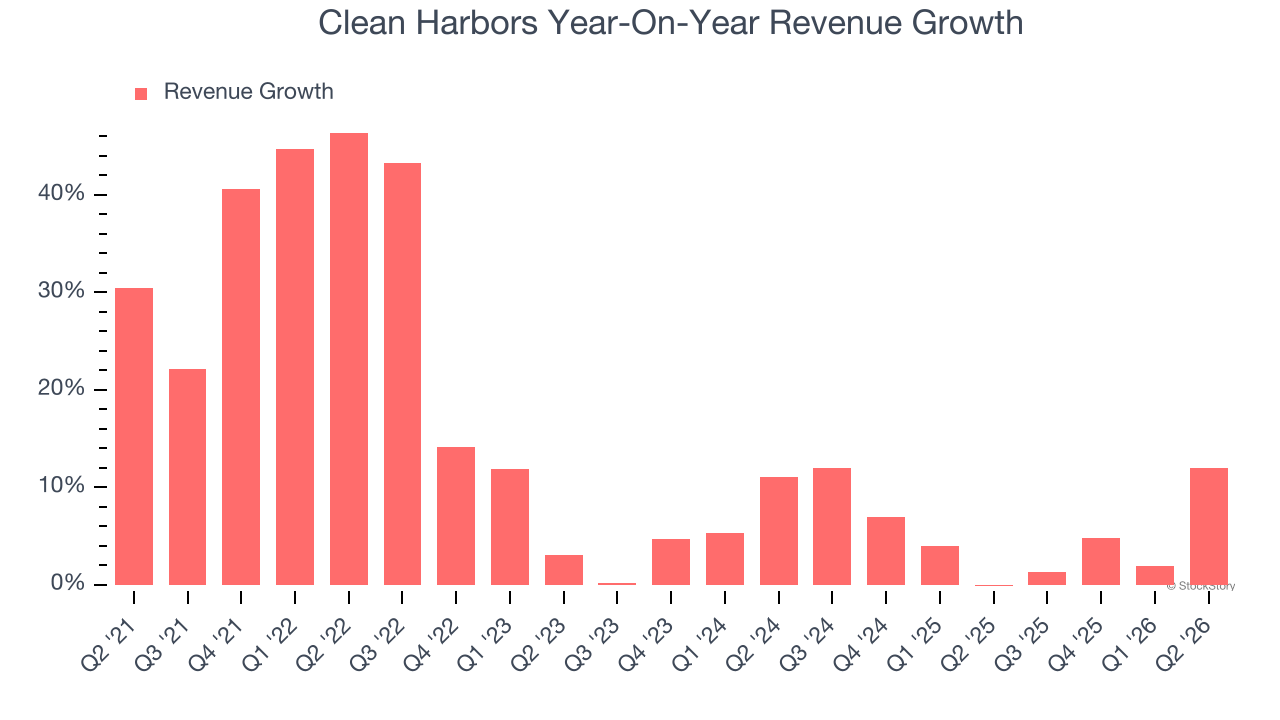
This quarter, Clean Harbors reported year-on-year revenue growth of 11.9%, and its $1.74 billion of revenue exceeded Wall Street’s estimates by 6.1%.
Looking ahead, sell-side analysts expect revenue to grow 4% over the next 12 months, similar to its two-year rate. This projection doesn’t excite us and indicates its products and services will see some demand headwinds. At least the company is tracking well in other measures of financial health.
ONE MORE THING: 3 Hidden Platforms Growing 3X Faster than Amazon, Google, and PayPal. Amazon, Google, and Meta all followed the same playbook: Dominate an ignored market. Build an unbeatable moat. Scale until you’re unstoppable.
These three platforms are running that exact playbook right now. The early investors in Amazon made fortunes. The early investors in these could do the same. Get All 3 Stocks Here for FREE.
Operating Margin
Clean Harbors has managed its cost base well over the last five years. It demonstrated solid profitability for an industrials business, producing an average operating margin of 11.4%.
Looking at the trend in its profitability, Clean Harbors’s operating margin rose by 1.3 percentage points over the last five years, as its sales growth gave it operating leverage.
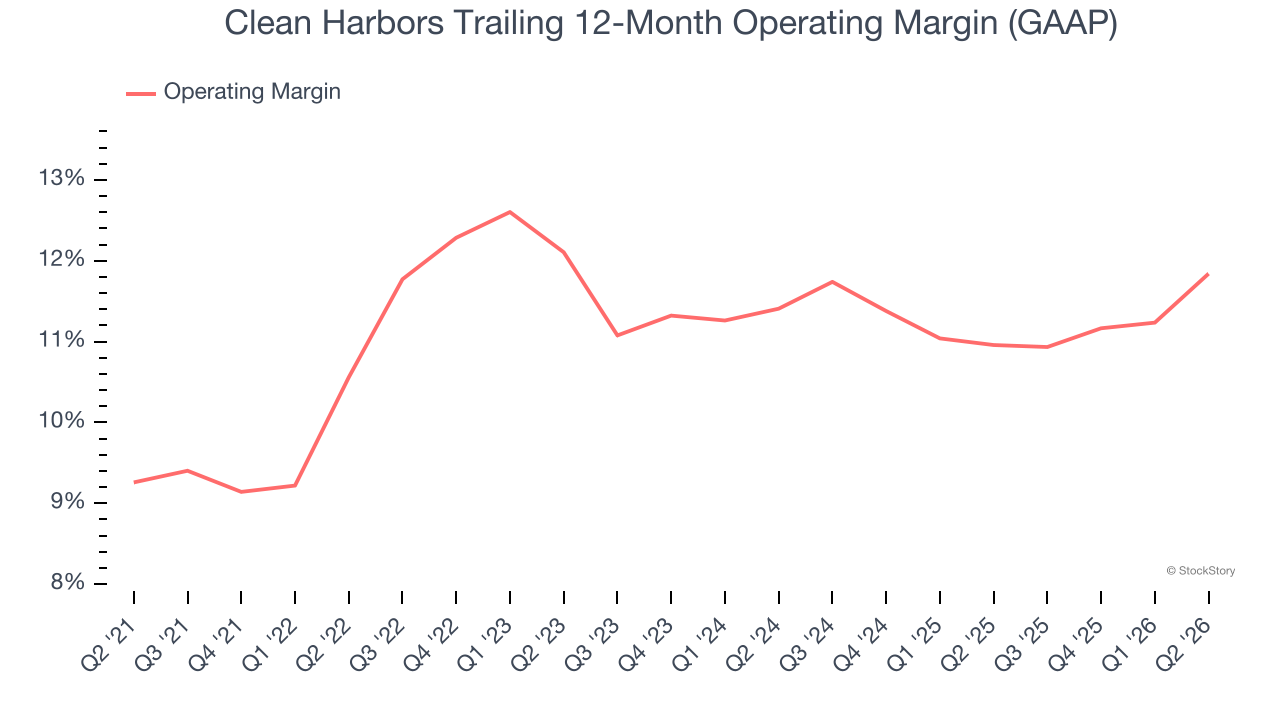
In Q2, Clean Harbors generated an operating margin profit margin of 15.5%, up 1.9 percentage points year on year. The increase was encouraging, and because its operating margin rose more than its gross margin, we can infer it was more efficient with expenses such as marketing, R&D, and administrative overhead.
Earnings Per Share
Revenue trends explain a company’s historical growth, but the long-term change in earnings per share (EPS) points to the profitability of that growth — for example, a company could inflate its sales through excessive spending on advertising and promotions.
Clean Harbors’s EPS grew at 20% compounded annual growth rate over the last five years, higher than its 13.5% annualized revenue growth. This tells us the company became more profitable on a per-share basis as it expanded.
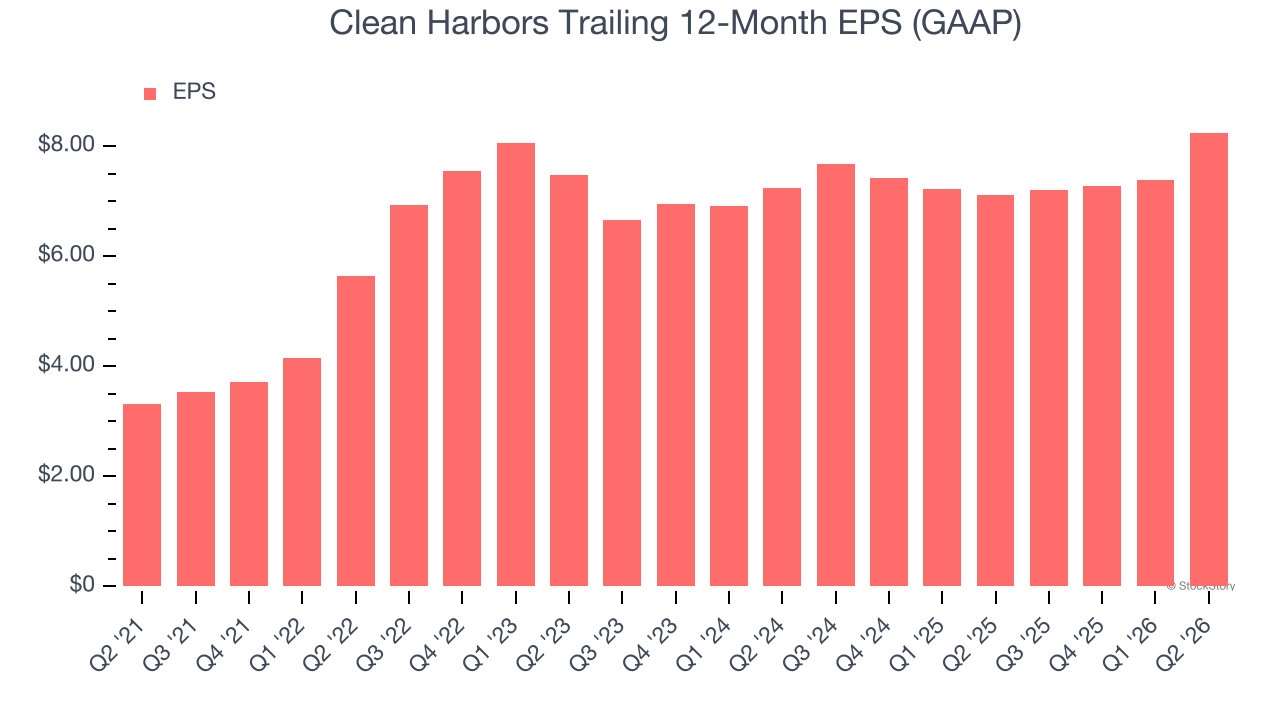
We can take a deeper look into Clean Harbors’s earnings quality to better understand the drivers of its performance. As we mentioned earlier, Clean Harbors’s operating margin expanded by 1.3 percentage points over the last five years. On top of that, its share count shrank by 3.5%. These are positive signs for shareholders because improving profitability and share buybacks turbocharge EPS growth relative to revenue growth. 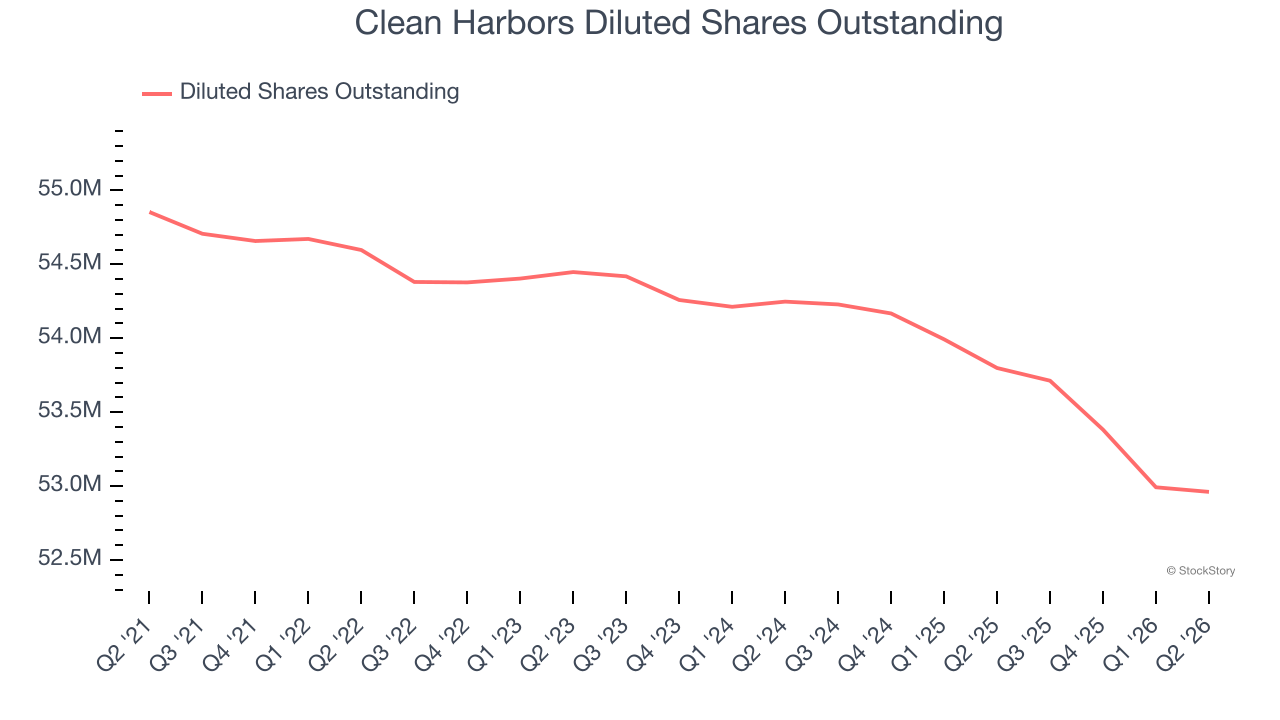
Like with revenue, we analyze EPS over a more recent period because it can provide insight into an emerging theme or development for the business.
For Clean Harbors, its two-year annual EPS growth of 6.8% was lower than its five-year trend. This wasn’t great, but at least the company was successful in other measures of financial health.
In Q2, Clean Harbors reported EPS of $3.22, up from $2.36 in the same quarter last year. This print easily cleared analysts’ estimates, and shareholders should be content with the results. Over the next 12 months, Wall Street expects Clean Harbors’s full-year EPS to grow 10.8% from $8.25 to $9.14.
Key Takeaways from Clean Harbors’s Q2 Results
We were impressed by Clean Harbors’s optimistic EBITDA guidance for next quarter, which blew past analysts’ expectations. We were also excited its EBITDA outperformed Wall Street’s estimates by a wide margin. Zooming out, we think this was a solid print. The stock traded up 2.6% to $311.59 immediately after reporting.
Sure, Clean Harbors had a solid quarter, but if we look at the bigger picture, is this stock a buy? The latest quarter does matter, but not nearly as much as longer-term fundamentals and valuation, when deciding if the stock is a buy. We cover that in our actionable full research report which you can read here (it’s free).