

RV Manufacturer Winnebago (NYSE: WGO) fell short of the market’s revenue expectations in Q2 CY2025, with sales falling 1.4% year on year to $775.1 million. On the other hand, the company’s outlook for the full year was close to analysts’ estimates with revenue guided to $2.75 billion at the midpoint. Its non-GAAP profit of $0.81 per share was 2.2% above analysts’ consensus estimates.
Is now the time to buy Winnebago? Find out by accessing our full research report, it’s free.
Winnebago (WGO) Q2 CY2025 Highlights:
- Revenue: $775.1 million vs analyst estimates of $781.4 million (1.4% year-on-year decline, 0.8% miss)
- Adjusted EPS: $0.81 vs analyst estimates of $0.79 (2.2% beat)
- Adjusted EBITDA: $46.5 million vs analyst estimates of $44.72 million (6% margin, 4% beat)
- The company dropped its revenue guidance for the full year to $2.75 billion at the midpoint from $2.9 billion, a 5.2% decrease
- Management lowered its full-year Adjusted EPS guidance to $1.45 at the midpoint, a 55.4% decrease
- Operating Margin: 3.9%, down from 5.5% in the same quarter last year
- Free Cash Flow was -$36.1 million, down from $88.4 million in the same quarter last year
- Market Capitalization: $878 million
“Our fiscal third-quarter results reflect both the diverse dynamics of our business segments and the challenges posed by an uncertain economic environment,” said Michael Happe, President and Chief Executive Officer of Winnebago Industries.
Company Overview
Created to provide high-quality, affordable RVs to the post-war American family, Winnebago (NYSE: WGO) is a manufacturer of recreational vehicles, providing a range of motorhomes, travel trailers, and fifth-wheel products for outdoor and adventure lifestyles.
Revenue Growth
Examining a company’s long-term performance can provide clues about its quality. Any business can experience short-term success, but top-performing ones enjoy sustained growth for years. Regrettably, Winnebago’s sales grew at a tepid 5% compounded annual growth rate over the last five years. This was below our standard for the industrials sector and is a poor baseline for our analysis.
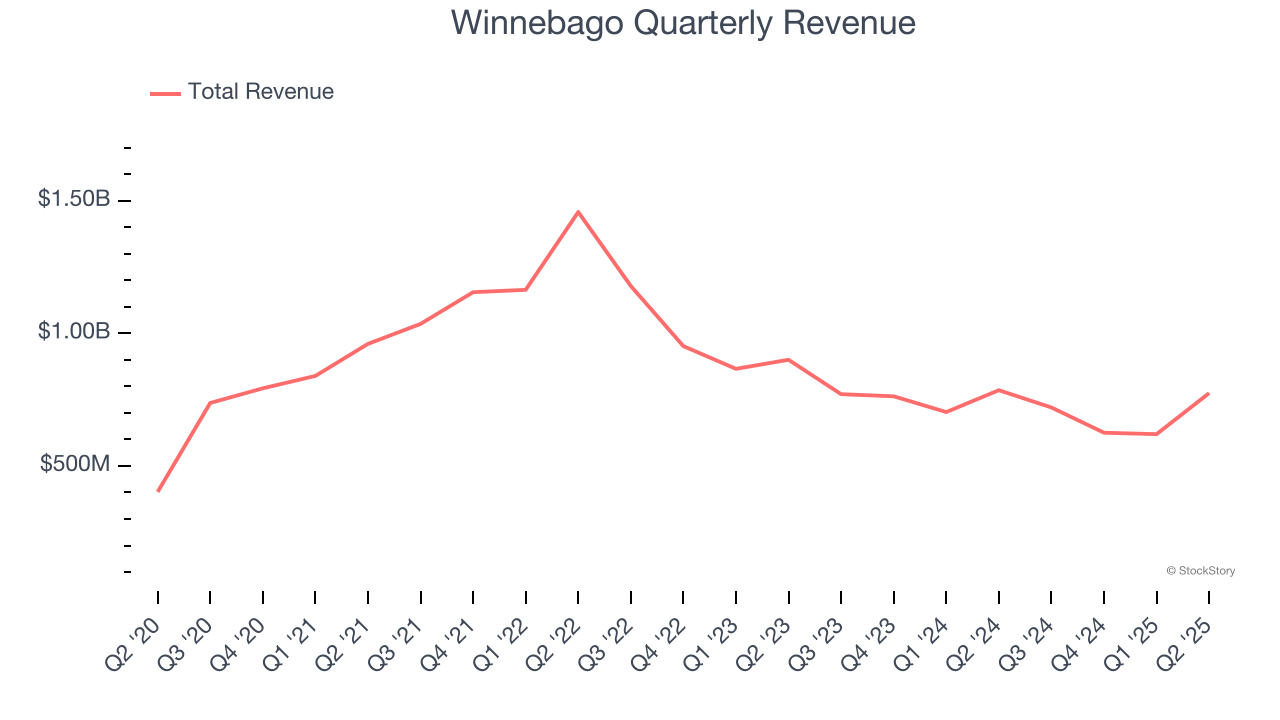
We at StockStory place the most emphasis on long-term growth, but within industrials, a half-decade historical view may miss cycles, industry trends, or a company capitalizing on catalysts such as a new contract win or a successful product line. Winnebago’s performance shows it grew in the past but relinquished its gains over the last two years, as its revenue fell by 16.1% annually. Winnebago isn’t alone in its struggles as the Automobile Manufacturing industry experienced a cyclical downturn, with many similar businesses observing lower sales at this time. 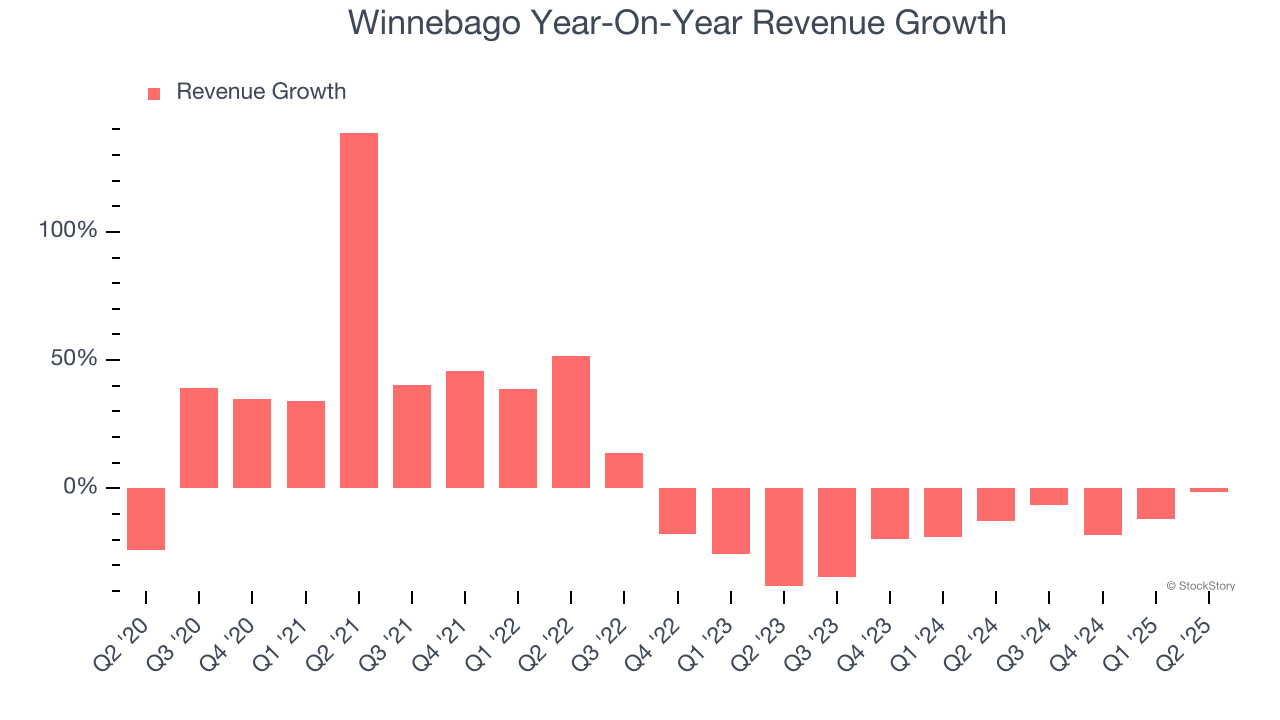
We can better understand the company’s revenue dynamics by analyzing its most important segments, Motorhomes and Towables, which are 37.6% and 48% of revenue. Over the last two years, Winnebago’s Motorhomes revenue (homes on wheels) averaged 20.2% year-on-year declines while its Towables revenue (non-motorized vehicles) averaged 10.6% declines.
This quarter, Winnebago missed Wall Street’s estimates and reported a rather uninspiring 1.4% year-on-year revenue decline, generating $775.1 million of revenue.
Looking ahead, sell-side analysts expect revenue to grow 6.9% over the next 12 months. While this projection implies its newer products and services will spur better top-line performance, it is still below average for the sector.
Today’s young investors won’t have read the timeless lessons in Gorilla Game: Picking Winners In High Technology because it was written more than 20 years ago when Microsoft and Apple were first establishing their supremacy. But if we apply the same principles, then enterprise software stocks leveraging their own generative AI capabilities may well be the Gorillas of the future. So, in that spirit, we are excited to present our Special Free Report on a profitable, fast-growing enterprise software stock that is already riding the automation wave and looking to catch the generative AI next.
Operating Margin
Operating margin is one of the best measures of profitability because it tells us how much money a company takes home after procuring and manufacturing its products, marketing and selling those products, and most importantly, keeping them relevant through research and development.
Winnebago has done a decent job managing its cost base over the last five years. The company has produced an average operating margin of 8.4%, higher than the broader industrials sector.
Looking at the trend in its profitability, Winnebago’s operating margin decreased by 10 percentage points over the last five years. Many Automobile Manufacturing companies also saw their margins fall (along with revenue, as mentioned above) because the cycle turned in the wrong direction. We hope Winnebago can emerge from this a stronger company, as the silver lining of a downturn is that market share can be won and efficiencies found.
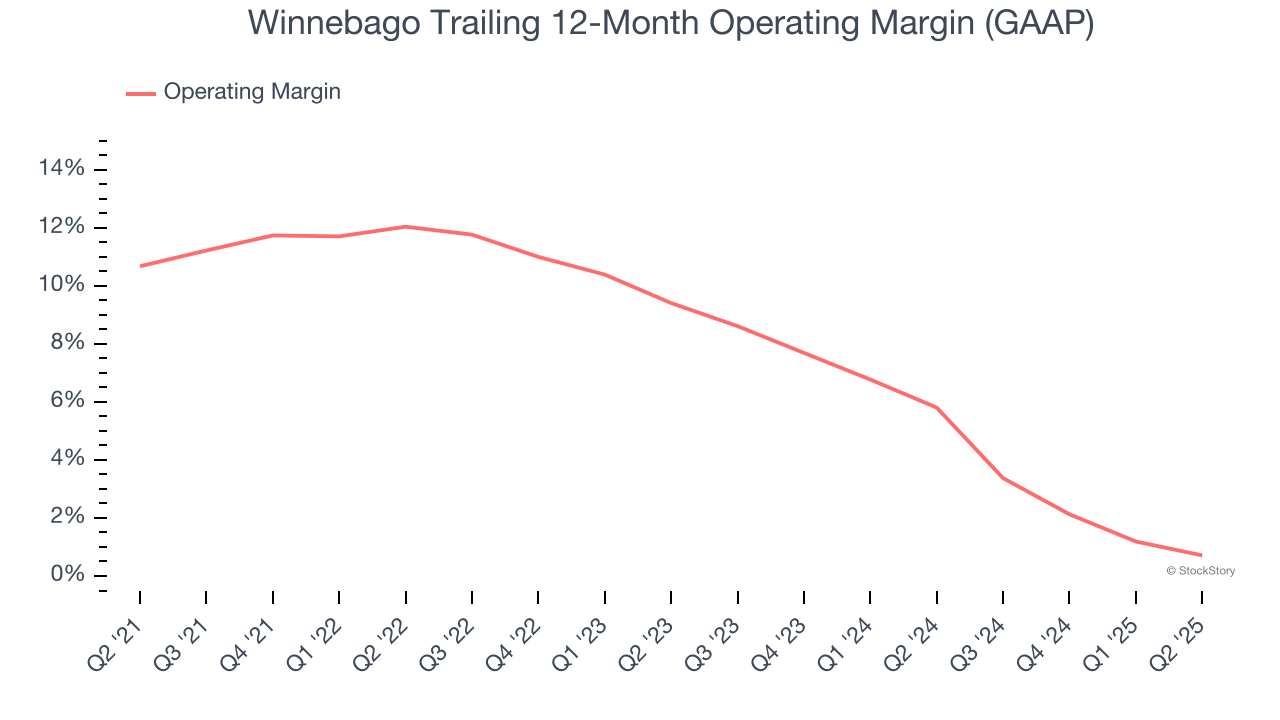
In Q2, Winnebago generated an operating margin profit margin of 3.9%, down 1.6 percentage points year on year. Since Winnebago’s operating margin decreased more than its gross margin, we can assume it was less efficient because expenses such as marketing, R&D, and administrative overhead increased.
Earnings Per Share
Revenue trends explain a company’s historical growth, but the long-term change in earnings per share (EPS) points to the profitability of that growth – for example, a company could inflate its sales through excessive spending on advertising and promotions.
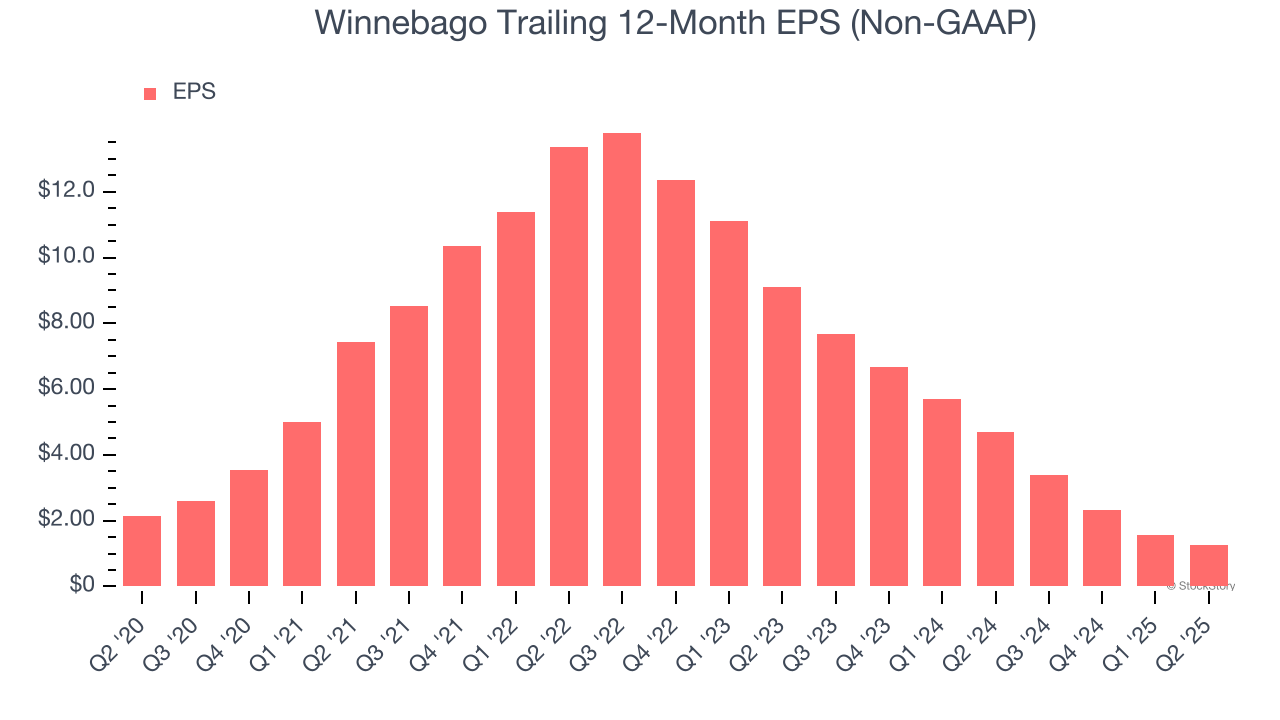
Sadly for Winnebago, its EPS declined by 10.3% annually over the last five years while its revenue grew by 5%. This tells us the company became less profitable on a per-share basis as it expanded due to non-fundamental factors such as interest expenses and taxes.
We can take a deeper look into Winnebago’s earnings to better understand the drivers of its performance. As we mentioned earlier, Winnebago’s operating margin declined by 10 percentage points over the last five years. This was the most relevant factor (aside from the revenue impact) behind its lower earnings; taxes and interest expenses can also affect EPS but don’t tell us as much about a company’s fundamentals.
Like with revenue, we analyze EPS over a more recent period because it can provide insight into an emerging theme or development for the business.
Winnebago’s two-year annual EPS declines of 62.9% were bad and lower than its two-year revenue performance.
In Q2, Winnebago reported EPS at $0.81, down from $1.13 in the same quarter last year. Despite falling year on year, this print beat analysts’ estimates by 2.2%. Over the next 12 months, Wall Street expects Winnebago’s full-year EPS of $1.25 to grow 126%.
Key Takeaways from Winnebago’s Q2 Results
We enjoyed seeing Winnebago beat analysts’ EPS and EBITDA expectations this quarter. On the other hand, it lowered its full-year revenue and EPS guidance. Overall, this was a softer quarter, but the stock traded up 2.3% to $32 immediately following the results.
Is Winnebago an attractive investment opportunity at the current price? The latest quarter does matter, but not nearly as much as longer-term fundamentals and valuation, when deciding if the stock is a buy. We cover that in our actionable full research report which you can read here, it’s free.


