Oil and gas producer Diamondback Energy (NASDAQ: FANG) beat Wall Street’s revenue expectations in Q1 CY2026, with sales up 4.7% year on year to $4.24 billion. Its non-GAAP profit of $4.23 per share was 12.8% above analysts’ consensus estimates.
Is now the time to buy Diamondback Energy? Find out by accessing our full research report, it’s free.
Diamondback Energy (FANG) Q1 CY2026 Highlights:
- Revenue: $4.24 billion vs analyst estimates of $3.84 billion (4.7% year-on-year growth, 10.5% beat)
- Adjusted EPS: $4.23 vs analyst estimates of $3.75 (12.8% beat)
- Operating Margin: 2.7%, down from 41.3% in the same quarter last year
- Free Cash Flow Margin: 21.1%, down from 34.9% in the same quarter last year
- Oil production: up 9.5% year on year
- Market Capitalization: $58.41 billion
Company Overview
Sporting one of Wall Street's most memorable ticker symbols, Diamondback Energy (NASDAQ: FANG) drills for and produces oil and natural gas from underground rock formations in the Permian Basin of West Texas and New Mexico.
Revenue Growth
A company’s long-term performance can give signals about its business quality. Even a bad business, especially in a cyclical industry, can shine for a year or so, but a top-tier one should exhibit resilience through cycles. Over the last five years, Diamondback Energy grew its sales at an incredible 38.2% compounded annual growth rate. Its growth surpassed the average energy upstream and integrated energy company and shows its offerings resonate with customers, a great starting point for our analysis.
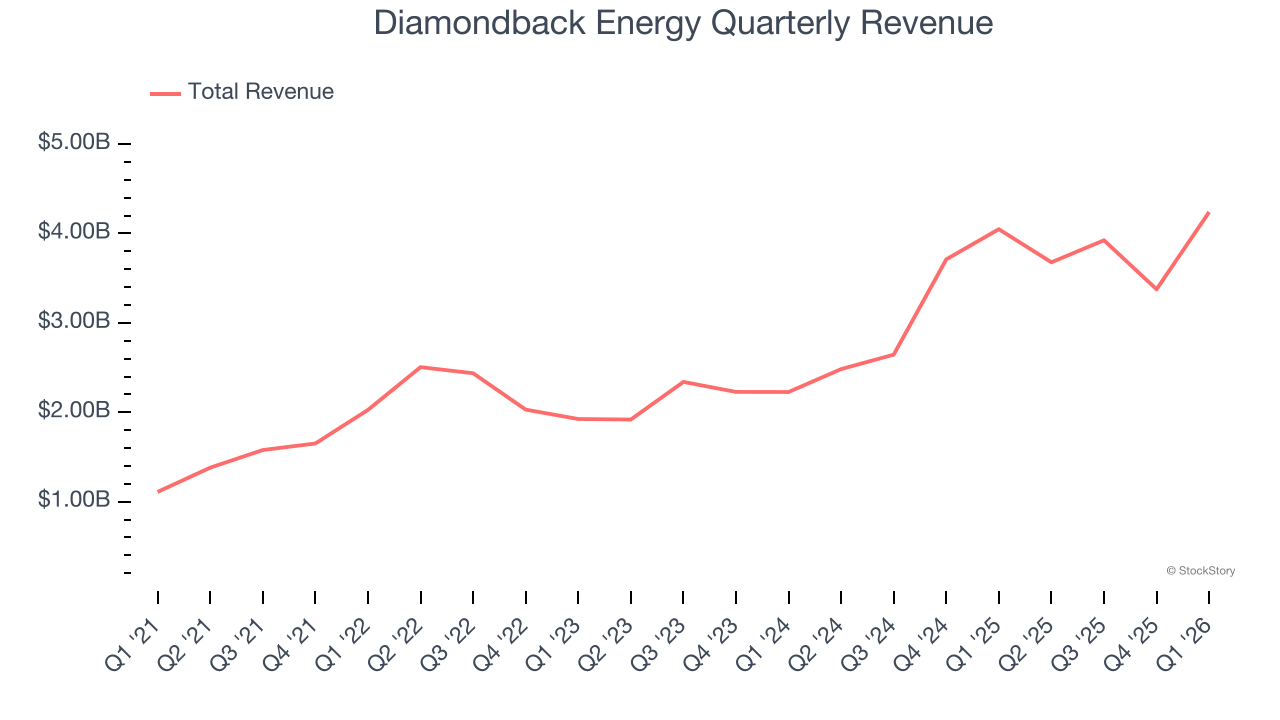
Energy cycles can be long enough that a single five-year period can still reflect one price environment, which is why an additional, decade-long view can help capture through-cycle performance. Diamondback Energy’s annualized revenue growth of 42.8% over the last ten years is above its five-year trend.
Revenue provides useful context, but it is heavily influenced by commodity prices and acquisitions. Production volumes, by contrast, reveal whether the underlying asset base is actually growing. Over the last two years, Diamondback Energy’s oil production averaged 40.7% year-on-year growth while its natural gas production averaged 58.3% year-on-year growth. 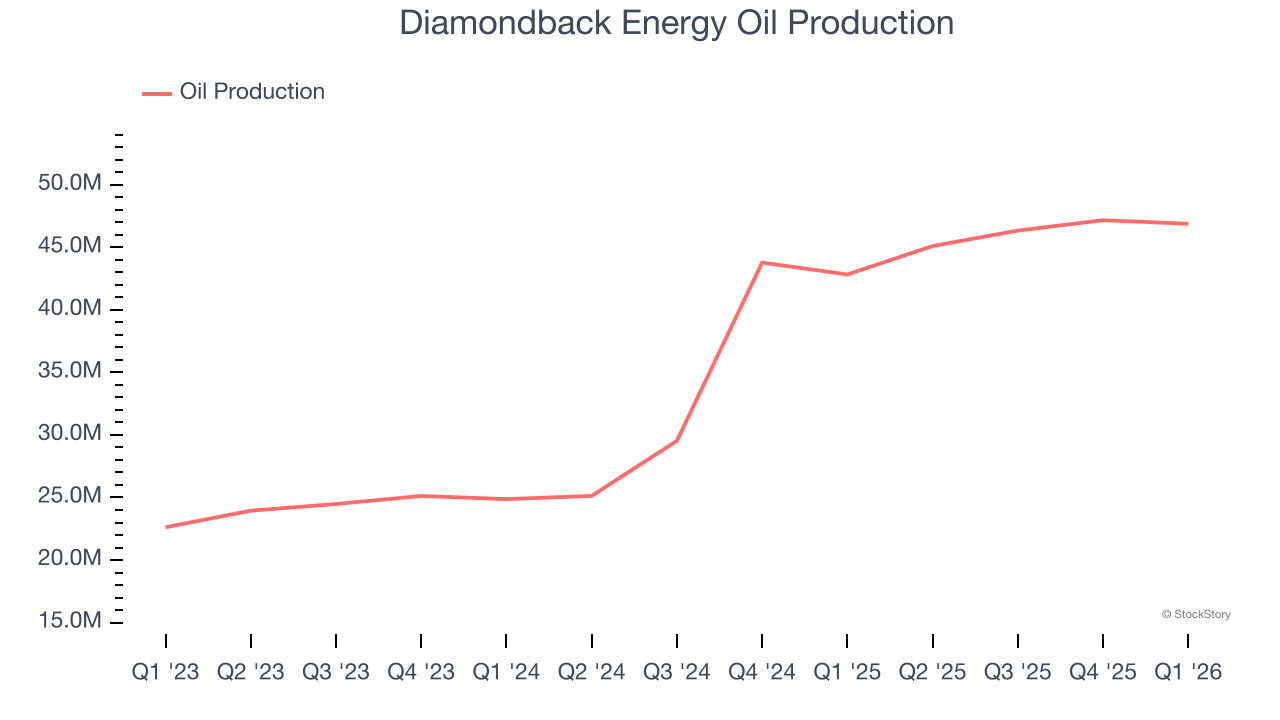
This quarter, Diamondback Energy reported modest year-on-year revenue growth of 4.7% but beat Wall Street’s estimates by 10.5%. This quarter, Diamondback Energy reported year-on-year Oil production growth of 9.5%.
ONE MORE THING: The $21 AI Application Stock Wall Street Forgot. While Wall Street obsesses over who’s building AI, one company is already using it to print money. And nobody’s paying attention.
AI chip stocks trade at ridiculous valuations. This company processes a trillion consumer signals monthly using AI and trades at a third of the price. The gap won’t last. The institutions will figure it out. You need to see this first. Read the FREE Report Before They Notice.
Adjusted EBITDA Margin
Diamondback Energy has been a well-oiled machine over the last five years. It demonstrated elite profitability for an upstream and integrated energy business, boasting an average EBITDA margin of 72%.
Looking at the trend in its profitability, Diamondback Energy’s EBITDA margin decreased by 9.3 percentage points over the last year. This raises questions about the company’s expense base because its revenue growth should have given it leverage on its fixed costs, resulting in better economies of scale and profitability.
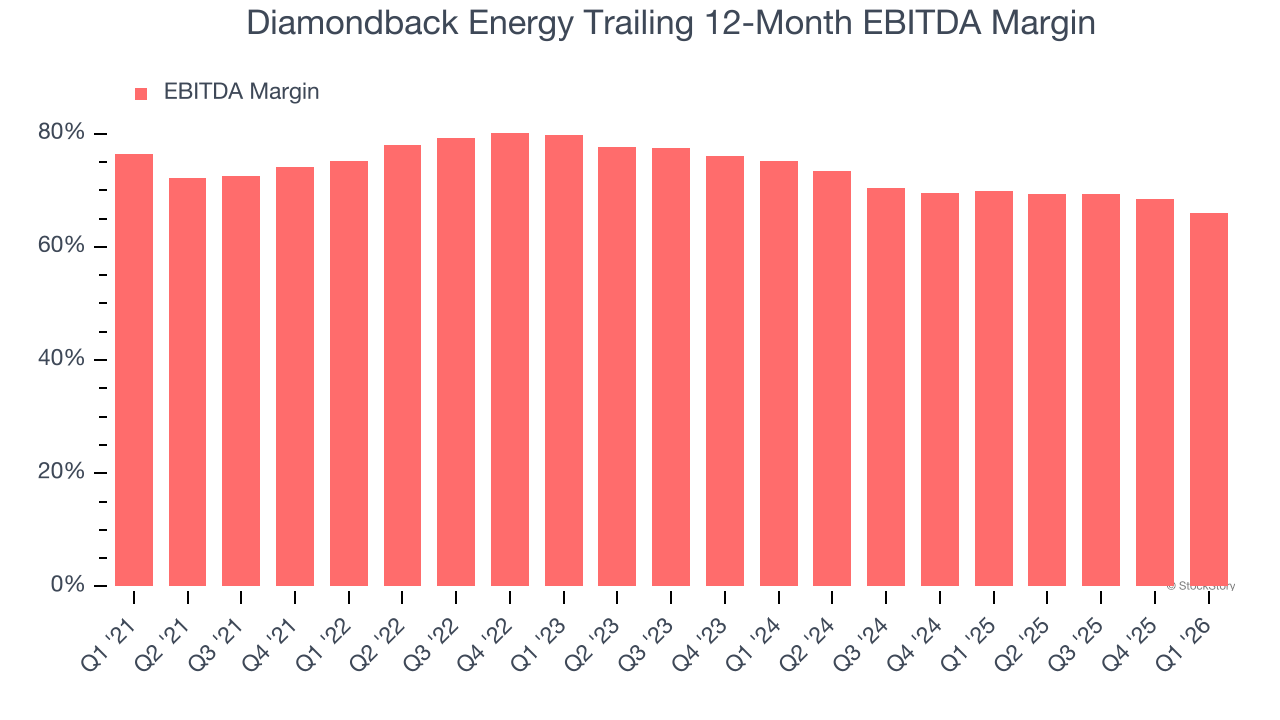
This quarter, Diamondback Energy generated an EBITDA margin profit margin of 63.8%, down 9 percentage points year on year. This contraction shows it was less efficient because its expenses grew faster than its revenue. This adjusted EBITDA fell short of Wall Street’s estimates.
Cash Is King
Adjusted EBITDA shows how profitable a company’s existing wells are before financing and reinvestment decisions, but free cash flow shows how much value remains after paying the cost of replacing those wells. In upstream energy, production naturally declines over time, so companies must continuously reinvest just to stand still. A producer can report strong EBITDA margins yet generate little or no free cash flow if its wells decline quickly or if new drilling is expensive. Free cash flow therefore captures not only how efficiently a company produces hydrocarbons today, but also how costly it is to sustain that production into the future.
Diamondback Energy has shown terrific cash profitability, driven by its lucrative business model that enables it to reinvest, return capital to investors, and stay ahead of the competition. The company’s free cash flow margin was among the best in the energy upstream and integrated energy sector, averaging an eye-popping 37.1% over the last five years.
While the level of free cash flow margins is important, their consistency matters just as much.
Diamondback Energy’s ratio of quarterly free cash flow volatility to WTI Crude price volatility over the past five years was 2.2 (lower is better), indicating unusually strong insulation from commodity swings. This stability supports superior capital access in downturns and positions Diamondback Energy to act as a consolidator when weaker peers are forced to retrench.
You may be asking why we wait until the free cash flow line to perform this stability analysis versus commodity prices. Why not compare revenue or EBITDA to WTI Crude prices in the case of Diamondback Energy? Because what ultimately matters is not how much revenue or profit you earn when prices are high but how much cash you can generate when prices are low. Free cash flow is the superior metric because it includes everything from hedging prowess to growth and maintenance capex to management behavior during good times and bad.
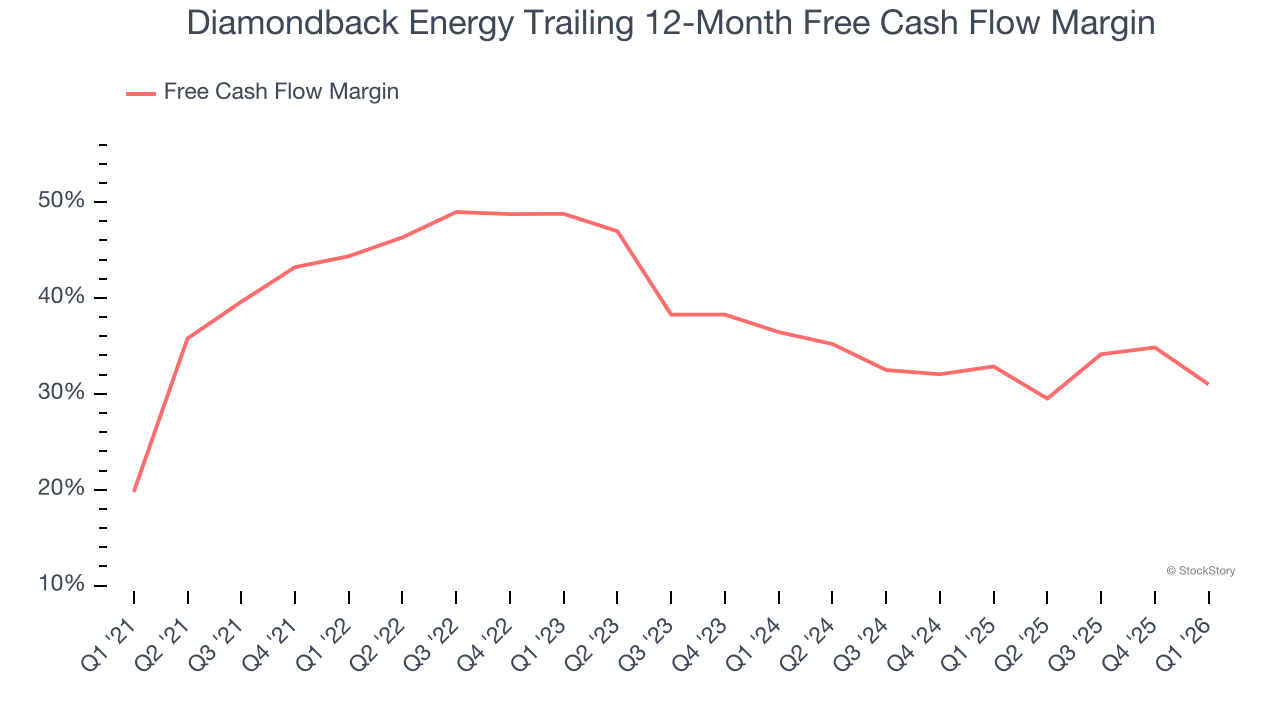
Diamondback Energy’s free cash flow clocked in at $895 million in Q1, equivalent to a 21.1% margin. The company’s cash profitability regressed as it was 13.8 percentage points lower than in the same quarter last year, which isn’t ideal considering its longer-term trend.
Key Takeaways from Diamondback Energy’s Q1 Results
We were impressed by how significantly Diamondback Energy blew past analysts’ revenue expectations this quarter. We were also glad its EPS outperformed Wall Street’s estimates. Overall, this print had some key positives. The stock remained flat at $212.50 immediately after reporting.
Big picture, is Diamondback Energy a buy here and now? If you’re making that decision, you should consider the bigger picture of valuation, business qualities, as well as the latest earnings. We cover that in our actionable full research report which you can read here (it’s free).