
Credit reporting company TransUnion (NYSE: TRU) reported revenue ahead of Wall Street’s expectations in Q1 CY2026, with sales up 13.7% year on year to $1.25 billion. Guidance for next quarter’s revenue was better than expected at $1.28 billion at the midpoint, 1.3% above analysts’ estimates. Its non-GAAP profit of $1.13 per share was 1.7% above analysts’ consensus estimates.
Is now the time to buy TransUnion? Find out by accessing our full research report, it’s free.
TransUnion (TRU) Q1 CY2026 Highlights:
- Revenue: $1.25 billion vs analyst estimates of $1.21 billion (13.7% year-on-year growth, 2.7% beat)
- Adjusted EPS: $1.13 vs analyst estimates of $1.11 (1.7% beat)
- Adjusted EBITDA: $439 million vs analyst estimates of $424.7 million (35.2% margin, 3.4% beat)
- The company lifted its revenue guidance for the full year to $5.12 billion at the midpoint from $4.96 billion, a 3.1% increase
- Management slightly raised its full-year Adjusted EPS guidance to $4.72 at the midpoint
- EBITDA guidance for the full year is $1.81 billion at the midpoint, above analyst estimates of $1.79 billion
- Operating Margin: 19.7%, down from 23.2% in the same quarter last year
- Free Cash Flow was $19 million, up from -$15.9 million in the same quarter last year
- Market Capitalization: $13.74 billion
“In the first quarter, TransUnion delivered another strong quarter of outperformance,” said Chris Cartwright, President and CEO.
Company Overview
One of the three major credit bureaus in the United States alongside Equifax and Experian, TransUnion (NYSE: TRU) is a global information and insights company that provides credit reports, fraud prevention tools, and data analytics to help businesses make decisions and consumers manage their financial health.
Revenue Growth
Examining a company’s long-term performance can provide clues about its quality. Any business can experience short-term success, but top-performing ones enjoy sustained growth for years.
With $4.73 billion in revenue over the past 12 months, TransUnion is one of the larger companies in the business services industry and benefits from a well-known brand that influences purchasing decisions.
As you can see below, TransUnion grew its sales at an excellent 11.6% compounded annual growth rate over the last five years. This shows it had high demand, a useful starting point for our analysis.
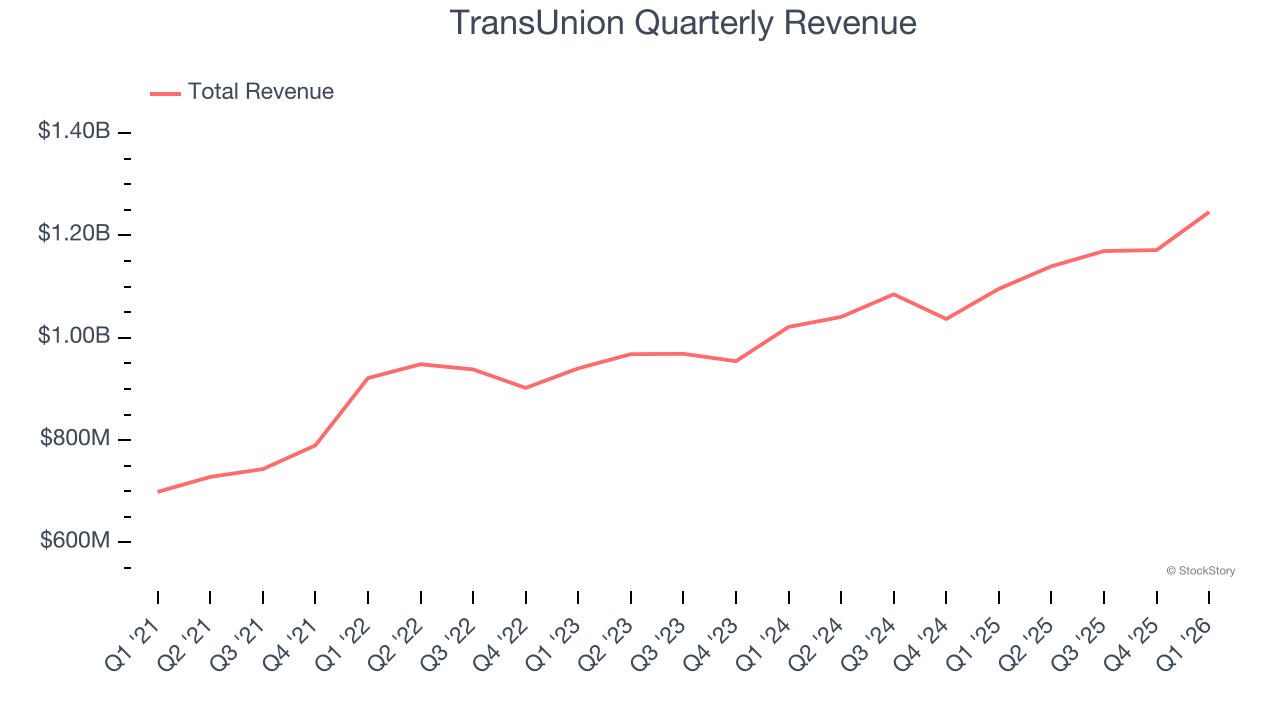
Long-term growth is the most important, but within business services, a half-decade historical view may miss new innovations or demand cycles. TransUnion’s annualized revenue growth of 9.9% over the last two years is below its five-year trend, but we still think the results suggest healthy demand. 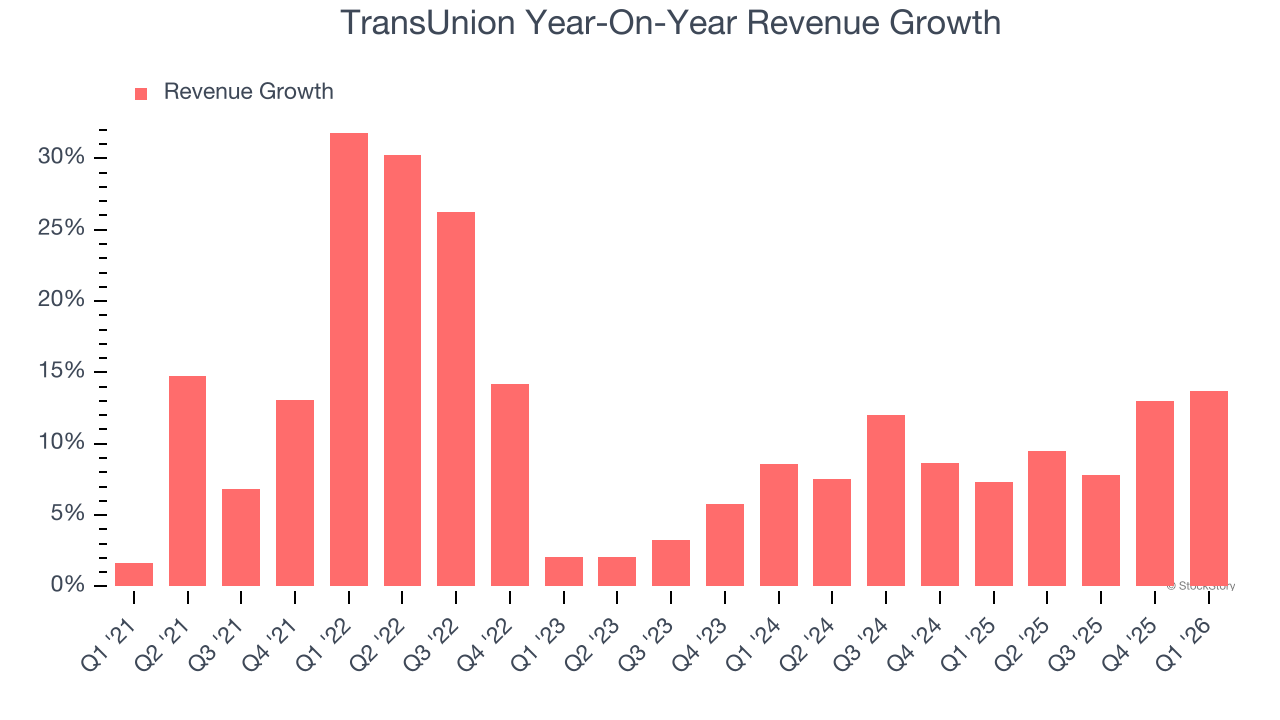
This quarter, TransUnion reported year-on-year revenue growth of 13.7%, and its $1.25 billion of revenue exceeded Wall Street’s estimates by 2.7%. Company management is currently guiding for a 12% year-on-year increase in sales next quarter.
Looking further ahead, sell-side analysts expect revenue to grow 9.3% over the next 12 months, similar to its two-year rate. This projection is admirable and suggests the market sees success for its products and services.
ONE MORE THING: The $21 AI Application Stock Wall Street Forgot. While Wall Street obsesses over who’s building AI, one company is already using it to print money. And nobody’s paying attention.
AI chip stocks trade at ridiculous valuations. This company processes a trillion consumer signals monthly using AI and trades at a third of the price. The gap won’t last. The institutions will figure it out. You need to see this first. Read the FREE Report Before They Notice.
Adjusted Operating Margin
Adjusted operating margin is a key measure of profitability. Think of it as net income (the bottom line) excluding the impact of non-recurring expenses, taxes, and interest on debt - metrics less connected to business fundamentals.
TransUnion has been a well-oiled machine over the last five years. It demonstrated elite profitability for a business services business, boasting an average adjusted operating margin of 29.7%.
Looking at the trend in its profitability, TransUnion’s adjusted operating margin decreased by 3.9 percentage points over the last five years. This raises questions about the company’s expense base because its revenue growth should have given it leverage on its fixed costs, resulting in better economies of scale and profitability.
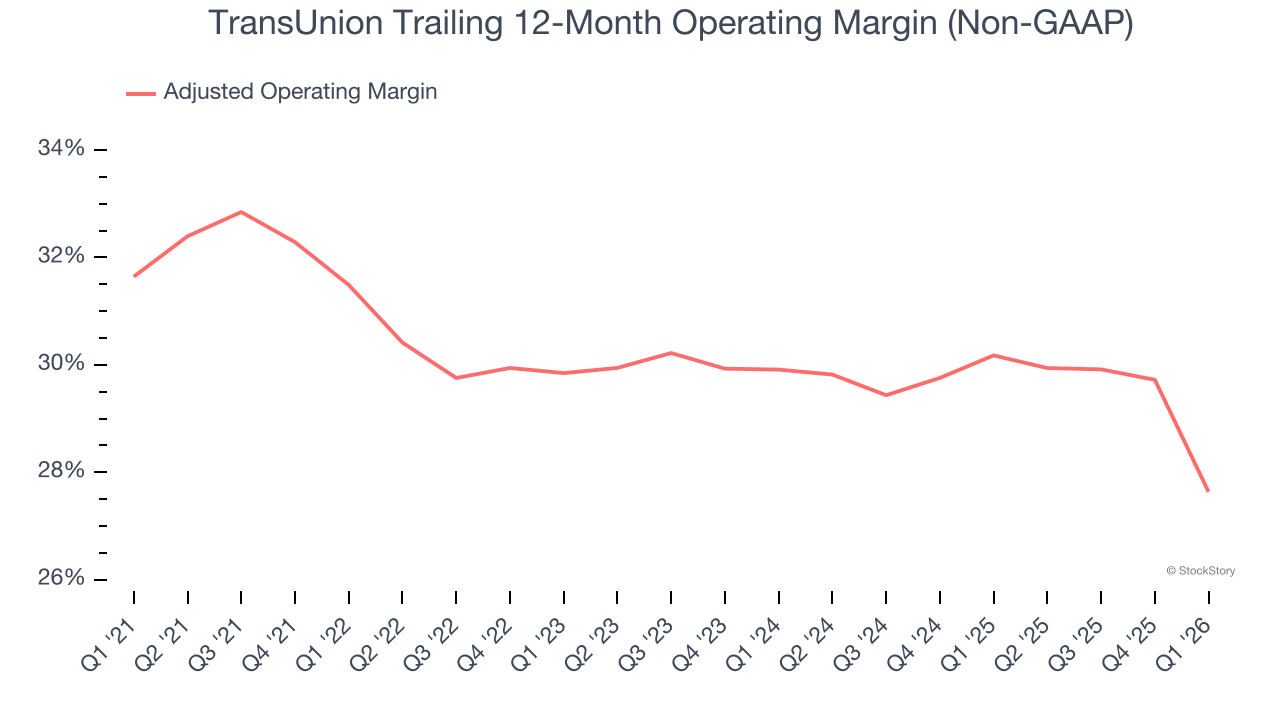
In Q1, TransUnion generated an adjusted operating margin profit margin of 22.7%, down 8 percentage points year on year. This contraction shows it was less efficient because its expenses grew faster than its revenue.
Earnings Per Share
Revenue trends explain a company’s historical growth, but the long-term change in earnings per share (EPS) points to the profitability of that growth – for example, a company could inflate its sales through excessive spending on advertising and promotions.
TransUnion’s EPS grew at an unimpressive 6.6% compounded annual growth rate over the last five years, lower than its 11.6% annualized revenue growth. This tells us the company became less profitable on a per-share basis as it expanded.
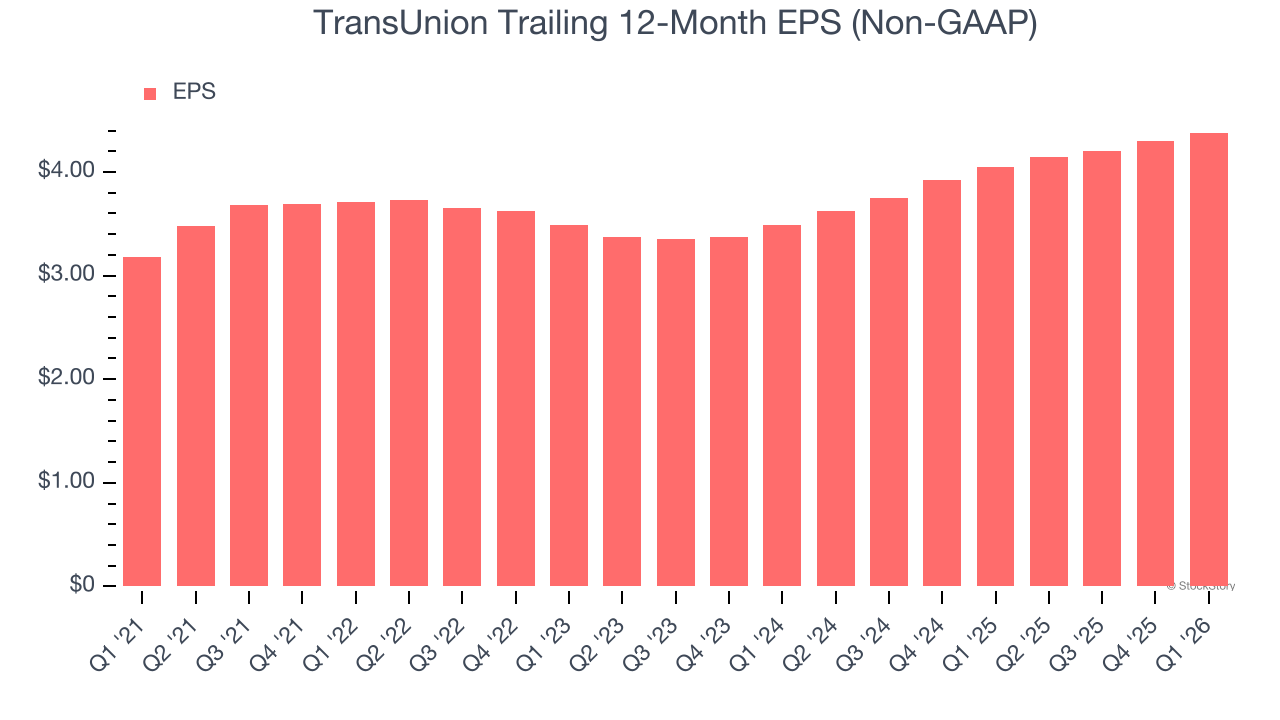
Diving into the nuances of TransUnion’s earnings can give us a better understanding of its performance. As we mentioned earlier, TransUnion’s adjusted operating margin declined by 3.9 percentage points over the last five years. Its share count also grew by 1%, meaning the company not only became less efficient with its operating expenses but also diluted its shareholders. 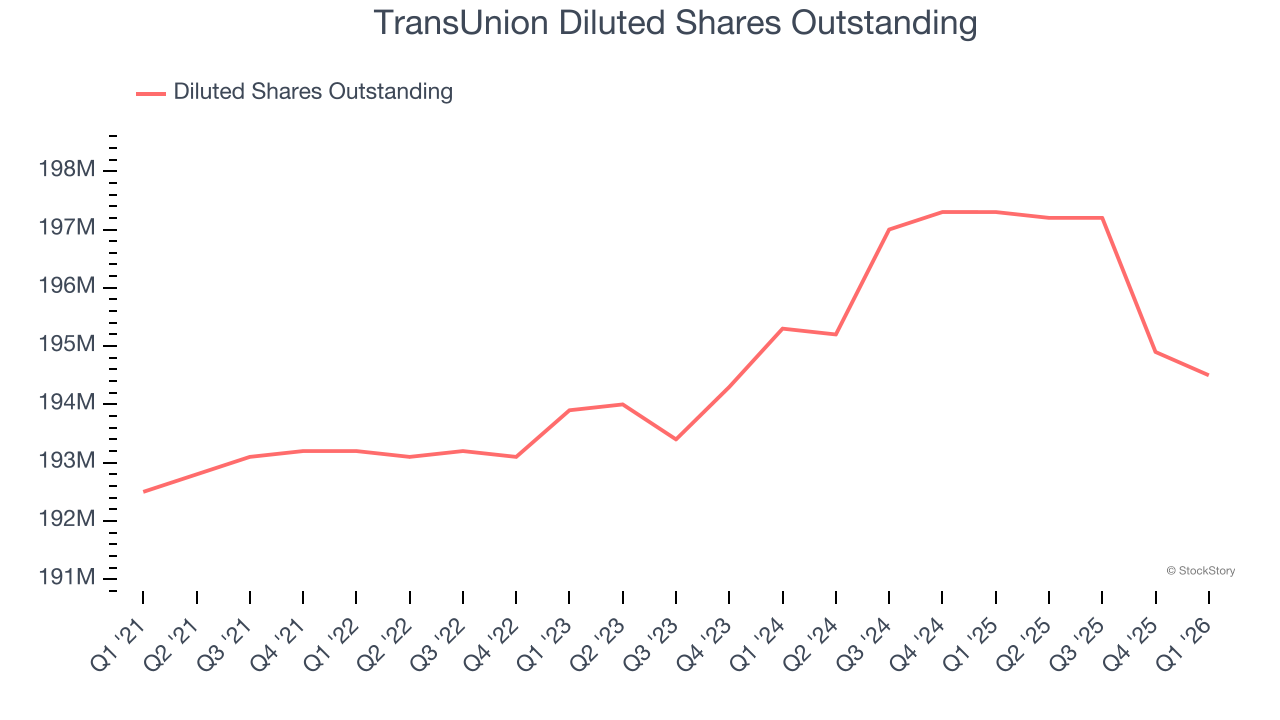
Like with revenue, we analyze EPS over a more recent period because it can provide insight into an emerging theme or development for the business.
For TransUnion, its two-year annual EPS growth of 12% was higher than its five-year trend. This acceleration made it one of the faster-growing business services companies in recent history.
In Q1, TransUnion reported adjusted EPS of $1.13, up from $1.05 in the same quarter last year. This print beat analysts’ estimates by 1.7%. Over the next 12 months, Wall Street expects TransUnion’s full-year EPS of $4.38 to grow 13.6%.
Key Takeaways from TransUnion’s Q1 Results
We enjoyed seeing TransUnion beat analysts’ revenue expectations this quarter. We were also glad its revenue guidance for next quarter slightly exceeded Wall Street’s estimates. On the other hand, its full-year EPS guidance missed and its EPS guidance for next quarter fell short of Wall Street’s estimates. Zooming out, we think this was a mixed quarter. The stock traded up 2.2% to $72.75 immediately after reporting.
So should you invest in TransUnion right now? The latest quarter does matter, but not nearly as much as longer-term fundamentals and valuation, when deciding if the stock is a buy. We cover that in our actionable full research report which you can read here (it’s free).


