Industrial products distributor Applied Industrial (NYSE: AIT) reported revenue ahead of Wall Street’s expectations in Q1 CY2026, with sales up 7.3% year on year to $1.25 billion. Guidance for next quarter’s revenue was better than expected at $1.29 billion at the midpoint, 0.8% above analysts’ estimates. Its GAAP profit of $2.65 per share was 0.5% above analysts’ consensus estimates.
Is now the time to buy Applied Industrial? Find out by accessing our full research report, it’s free.
Applied Industrial (AIT) Q1 CY2026 Highlights:
- Revenue: $1.25 billion vs analyst estimates of $1.22 billion (7.3% year-on-year growth, 2.2% beat)
- EPS (GAAP): $2.65 vs analyst estimates of $2.64 (0.5% beat)
- Adjusted EBITDA: $153.9 million vs analyst estimates of $152.1 million (12.3% margin, 1.1% beat)
- Revenue Guidance for Q2 CY2026 is $1.29 billion at the midpoint, above analyst estimates of $1.28 billion
- EPS (GAAP) guidance for the full year is $10.70 at the midpoint, roughly in line with what analysts were expecting
- Operating Margin: 11%, in line with the same quarter last year
- Free Cash Flow Margin: 7.6%, down from 9.8% in the same quarter last year
- Market Capitalization: $11.12 billion
Neil A. Schrimsher, Applied’s President & Chief Executive Officer, commented, “We delivered a solid third quarter underscored by strengthening organic sales growth across both segments. Growth was led by our Engineered Solutions segment where ongoing positive order trends, improving demand across legacy and emerging industry verticals, and our deep application and engineering expertise is accelerating sales momentum. This is an encouraging sign that highlights our differentiated position, as well as distinct growth tailwinds emerging across the segment. In addition, Service Center segment demand is building nicely. Benefits from our sales initiatives and One Applied value proposition are reading through as we support our customers’ heightened technical MRO requirements within an increasingly positive U.S. industrial backdrop. Combined with steady underlying gross margin performance, we reported record quarterly EBITDA at the high end of our expectations. Overall, these are strong results that further demonstrate our favorable industry position and the Applied team’s consistent execution.”
Company Overview
Formerly called The Ohio Ball Bearing Company, Applied Industrial (NYSE: AIT) distributes industrial products–everything from power tools to industrial valves–and services to a wide variety of industries.
Revenue Growth
A company’s long-term sales performance is one signal of its overall quality. Any business can put up a good quarter or two, but the best consistently grow over the long haul. Thankfully, Applied Industrial’s 9.6% annualized revenue growth over the last five years was solid. Its growth beat the average industrials company and shows its offerings resonate with customers.
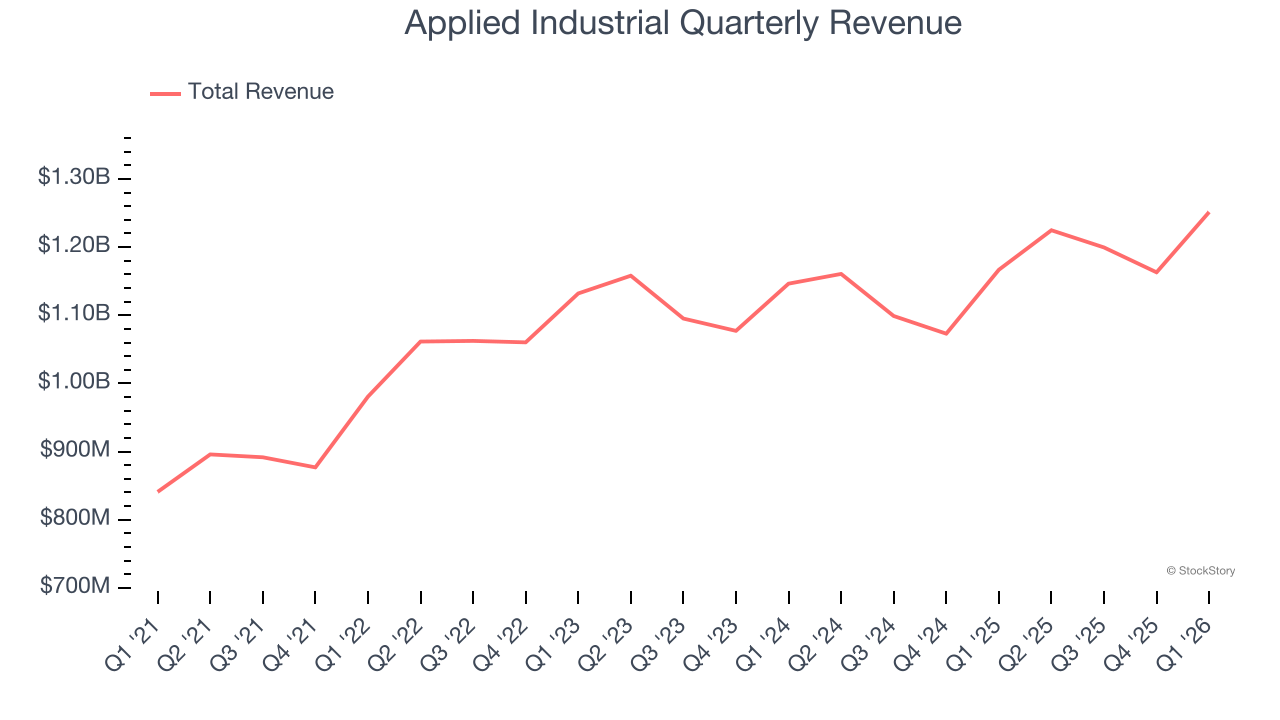
Long-term growth is the most important, but within industrials, a half-decade historical view may miss new industry trends or demand cycles. Applied Industrial’s recent performance shows its demand has slowed as its annualized revenue growth of 4% over the last two years was below its five-year trend. We’re wary when companies in the sector see decelerations in revenue growth, as it could signal changing consumer tastes aided by low switching costs. 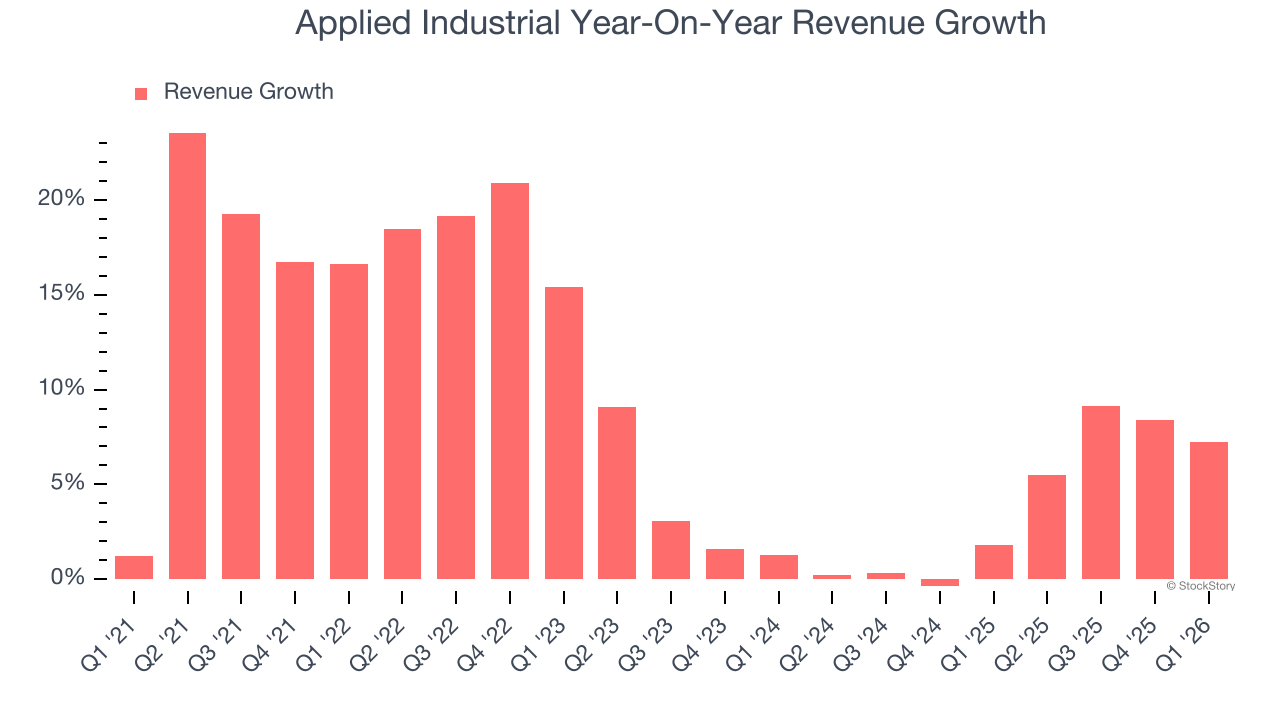
This quarter, Applied Industrial reported year-on-year revenue growth of 7.3%, and its $1.25 billion of revenue exceeded Wall Street’s estimates by 2.2%. Company management is currently guiding for a 5.3% year-on-year increase in sales next quarter.
Looking further ahead, sell-side analysts expect revenue to grow 4.5% over the next 12 months, similar to its two-year rate. This projection is underwhelming and indicates its newer products and services will not accelerate its top-line performance yet.
ONE MORE THING: The $21 AI Application Stock Wall Street Forgot. While Wall Street obsesses over who’s building AI, one company is already using it to print money. And nobody’s paying attention.
AI chip stocks trade at ridiculous valuations. This company processes a trillion consumer signals monthly using AI and trades at a third of the price. The gap won’t last. The institutions will figure it out. You need to see this first. Read the FREE Report Before They Notice.
Operating Margin
Applied Industrial has managed its cost base well over the last five years. It demonstrated solid profitability for an industrials business, producing an average operating margin of 10.5%. This result was particularly impressive because of its low gross margin, which is mostly a factor of what it sells and takes huge shifts to move meaningfully. Companies have more control over their operating margins, and it’s a show of well-managed operations if they’re high when gross margins are low.
Analyzing the trend in its profitability, Applied Industrial’s operating margin rose by 1.8 percentage points over the last five years, as its sales growth gave it operating leverage.
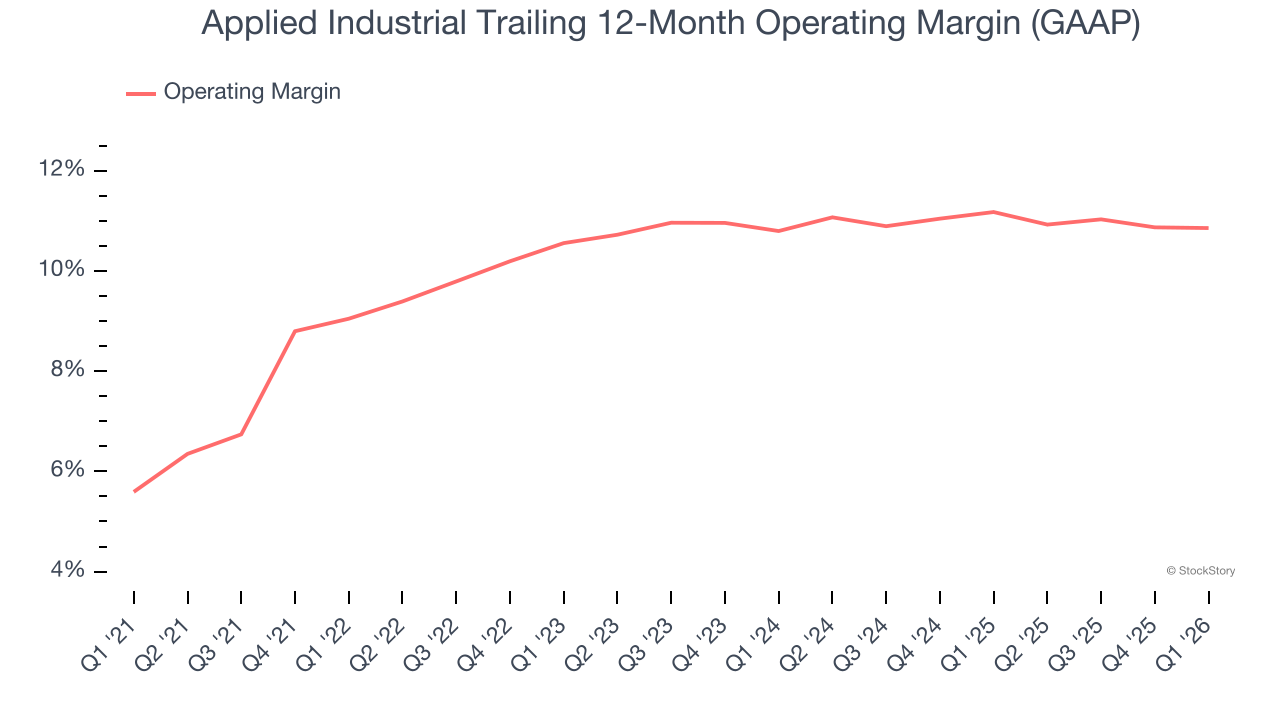
In Q1, Applied Industrial generated an operating margin profit margin of 11%, in line with the same quarter last year. This indicates the company’s cost structure has recently been stable.
Earnings Per Share
We track the long-term change in earnings per share (EPS) for the same reason as long-term revenue growth. Compared to revenue, however, EPS highlights whether a company’s growth is profitable.
Applied Industrial’s EPS grew at 29.2% compounded annual growth rate over the last five years, higher than its 9.6% annualized revenue growth. This tells us the company became more profitable on a per-share basis as it expanded.
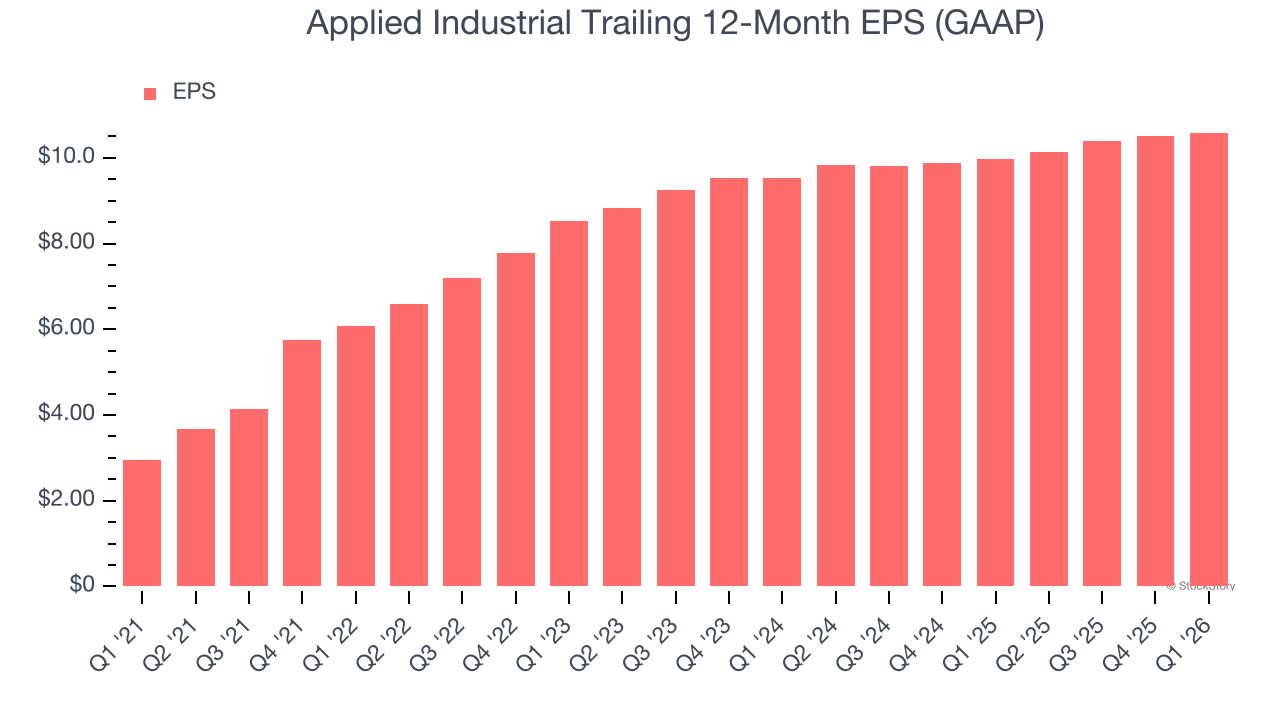
We can take a deeper look into Applied Industrial’s earnings quality to better understand the drivers of its performance. As we mentioned earlier, Applied Industrial’s operating margin was flat this quarter but expanded by 1.8 percentage points over the last five years. On top of that, its share count shrank by 4.4%. These are positive signs for shareholders because improving profitability and share buybacks turbocharge EPS growth relative to revenue growth. 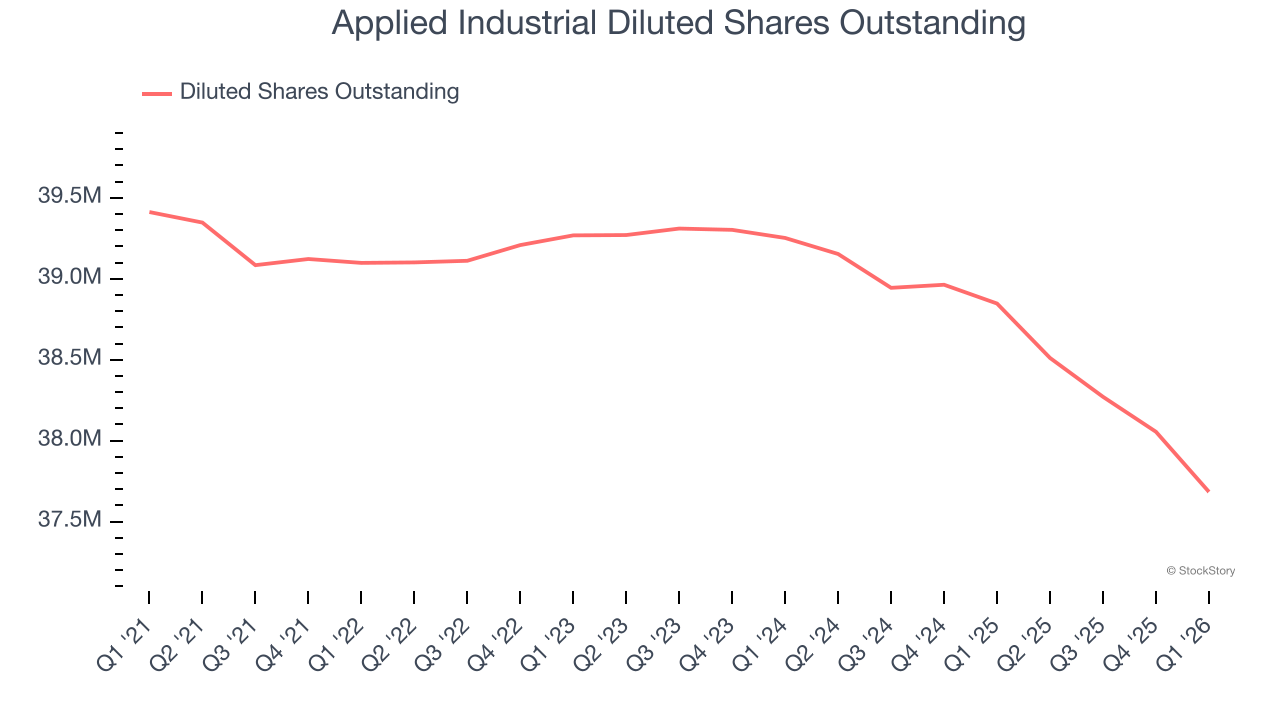
Like with revenue, we analyze EPS over a more recent period because it can provide insight into an emerging theme or development for the business.
For Applied Industrial, its two-year annual EPS growth of 5.4% was lower than its five-year trend. We hope its growth can accelerate in the future.
In Q1, Applied Industrial reported EPS of $2.65, up from $2.57 in the same quarter last year. This print was close to analysts’ estimates. Over the next 12 months, Wall Street expects Applied Industrial’s full-year EPS of $10.59 to grow 6.9%.
Key Takeaways from Applied Industrial’s Q1 Results
We enjoyed seeing Applied Industrial beat analysts’ revenue expectations this quarter. We were also happy its adjusted operating income outperformed Wall Street’s estimates. EPS also beat, although by a narrow margin. Overall, this print had some key positives. The stock remained flat at $298.10 immediately after reporting.
Applied Industrial may have had a good quarter, but does that mean you should invest right now? We think that the latest quarter is only one piece of the longer-term business quality puzzle. Quality, when combined with valuation, can help determine if the stock is a buy. We cover that in our actionable full research report which you can read here (it’s free).