Glass and electronic component manufacturer Corning (NYSE: GLW) fell short of the market’s revenue expectations in Q3 2026, but revenue rose 13.6% year on year to $4.86 billion. On the other hand, next quarter’s outlook exceeded expectations with revenue guided to $5.25 billion at the midpoint, or 1% above analysts’ consensus estimates. Its non-GAAP profit of $0.91 per share was 3.4% above analysts’ consensus estimates.
For more on Corning, read the full research report for free.
Corning (GLW) Q3 2026 highlights:
- Revenue $4.86 billion vs S&P analysts’ consensus estimates of $5.05 billion (13.6% year-on-year growth, 3.8% miss)
- Adjusted EPS $0.91 vs S&P analysts’ consensus estimates of $0.88 (3.4% beat)
- Revenue guidance $5.25 billion at the midpoint for Q4 2026, above analysts’ consensus estimates of $5.20 billion
- Adjusted EPS guidance $0.98 at the midpoint for Q4 2026, above analysts’ consensus estimates of $0.93
- Market capitalization $110 billion
Wendell P. Weeks, chairman, chief executive officer and president, said, “We delivered an outstanding third quarter. Year over year, core sales grew 19% to $5.08 billion, and core EPS grew 36% to $0.91. We expanded core gross margin 150 basis points to 40.5%, core operating margin 310 basis points to 22.7%, and core ROIC 330 basis points to 16.7% – with strong adjusted free cash flow of $661 million, while investing more than half a billion in capital expenditures to address demand for our innovations. Our strong results provide excellent proof points of the acceleration of growth outlined in our ‘20-30-40’ Springboard Plan.”
Revenue growth
A company’s long-term performance is an indicator of its overall quality. Any business can deliver a good quarter or two, but the best consistently grow over the long haul. Corning’s tepid 6% compounded annual revenue growth over the last five years fell short of the rest of the industrials sector, but there are still things to like about the company.
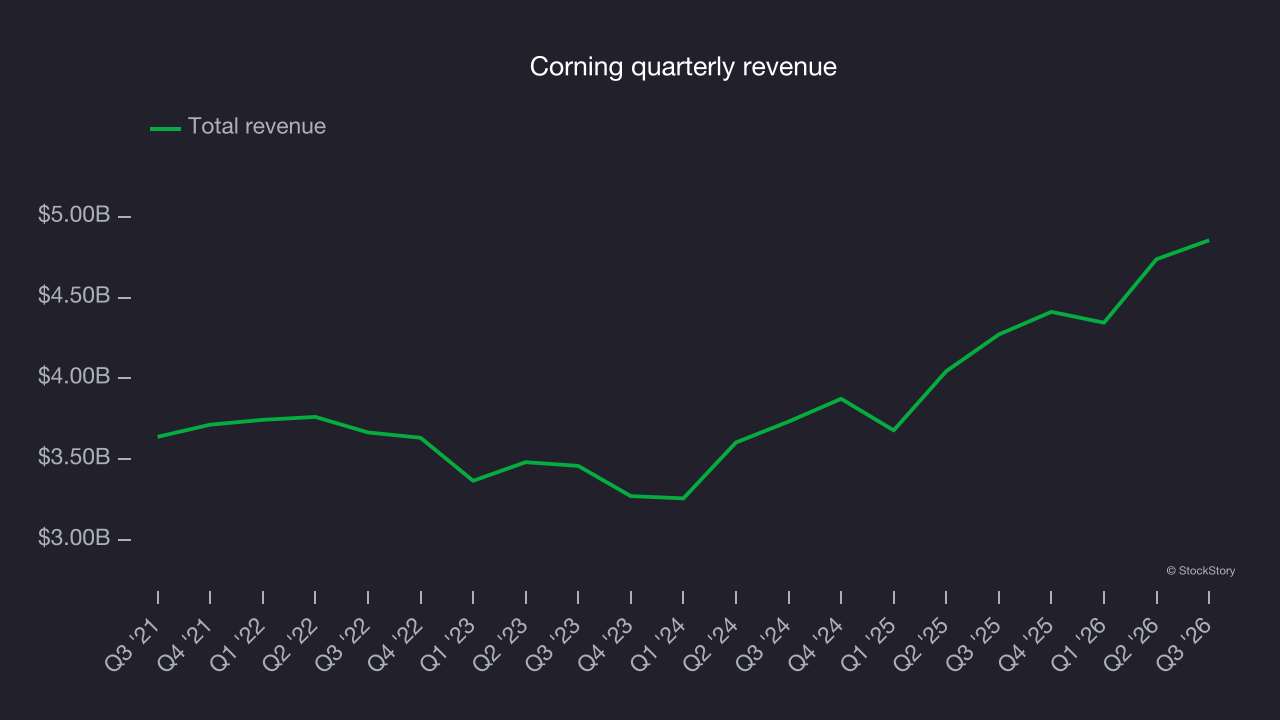
Long-term growth is the most important, but within industrials, a half-decade historical view may miss new industry trends or demand cycles. Corning’s annualized revenue growth of 15% over the last two years is above its five-year trend, suggesting its demand recently accelerated. 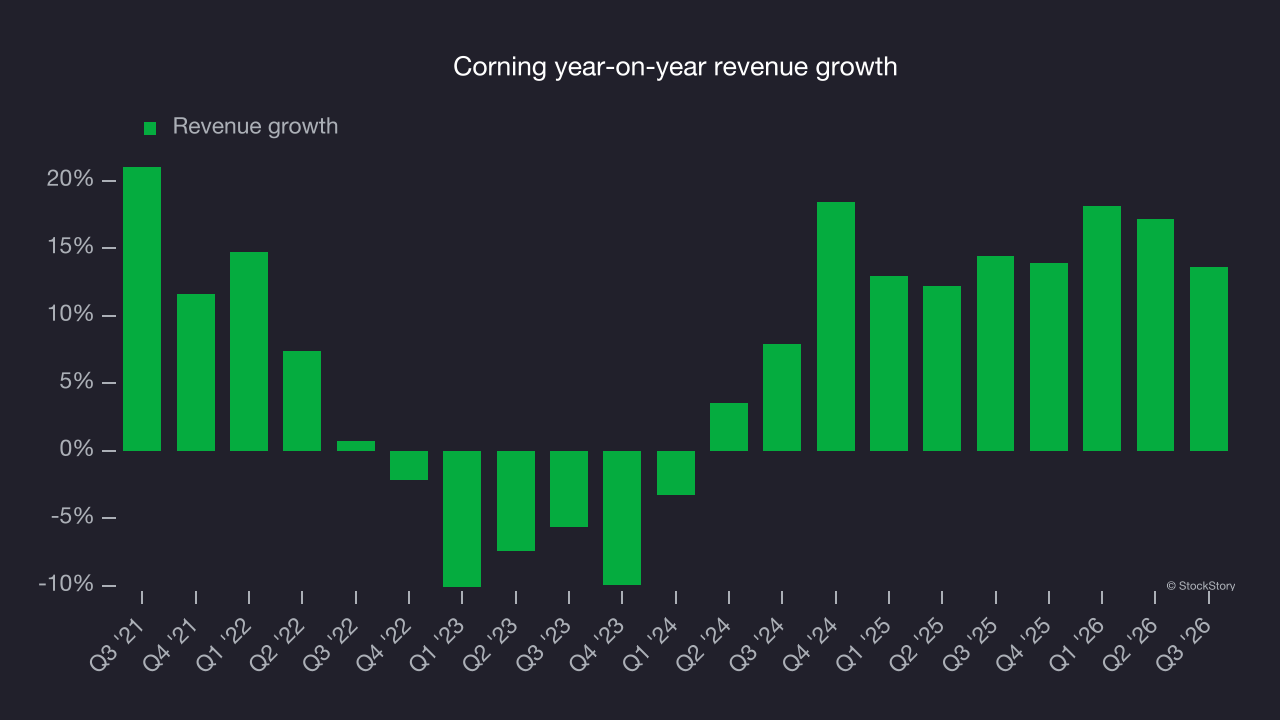
We can better understand the company’s revenue dynamics by analyzing its most important segments, Optical Communications and Display Technologies, which are 49% and 31% of revenue. Over the last two years, Corning’s Optical Communications revenue (optical fiber & cables) averaged 36.6% year-on-year growth while its Display Technologies revenue (glass for flat panel displays) averaged 17.8% growth. 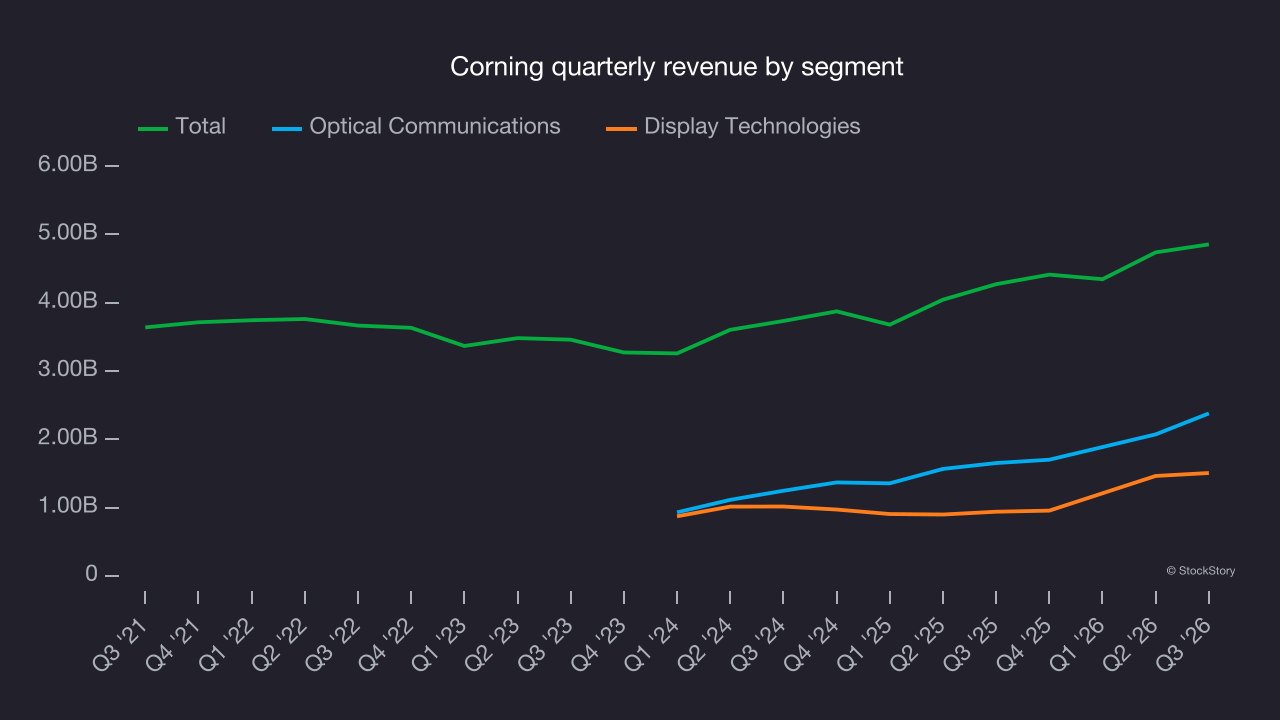
This quarter, Corning’s revenue grew by 13.6% year on year to $4.86 billion but fell short of Wall Street’s consensus estimates. Company management is currently guiding for a 19% year-on-year increase in revenue next quarter.
Looking further ahead, sell-side analysts expect revenue to grow 21.8% over the next 12 months, according to S&P, an improvement versus the last two years. This projection is strong for a company of its scale and suggests its newer products and services will drive faster revenue growth.
Operating margin
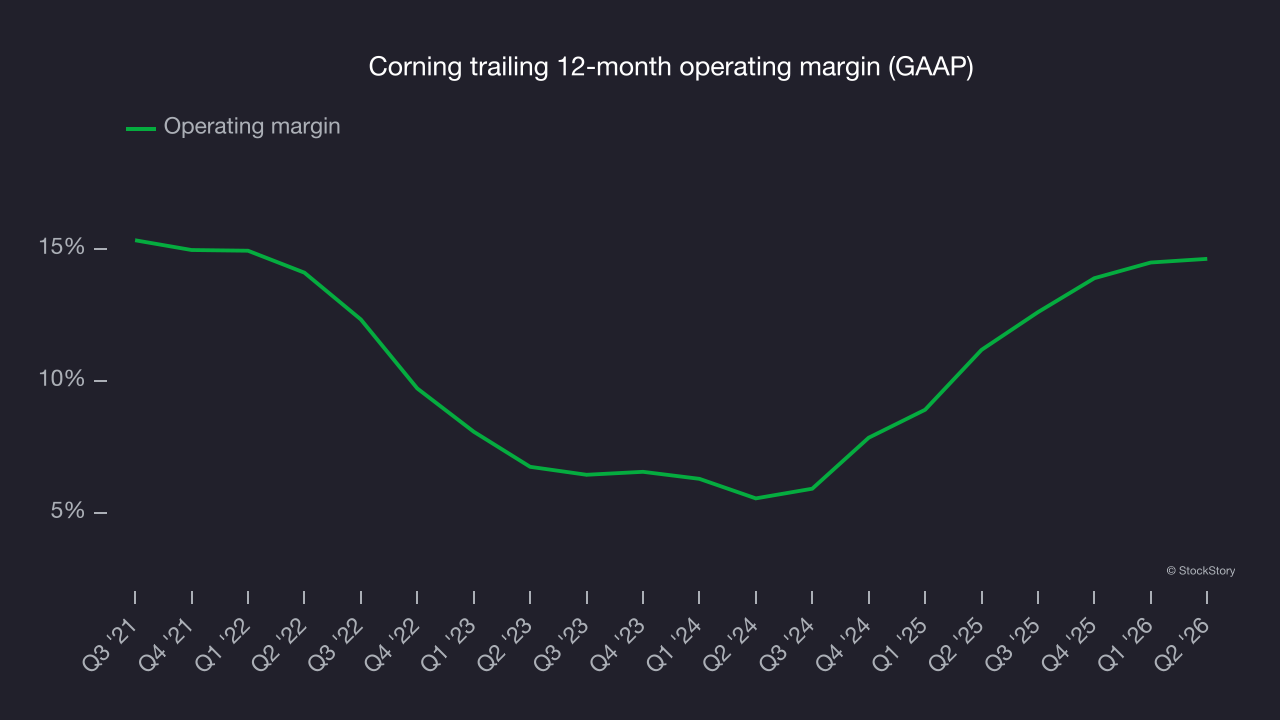
Corning has managed its cost base well over the last five years. It demonstrated solid profitability for an industrials business, producing an average operating margin of 10.5%. That result is unsurprising given its favorable high gross margin baseline.
Corning’s operating margin rose by 1.1 percentage points over the last five years, as its revenue growth gave it operating leverage.
Earnings per share
Revenue trends explain a company’s historical growth, but the long-term change in earnings per share (EPS) points to the profitability of that growth – for example, a company could inflate its revenue through excessive spending on advertising and promotions.
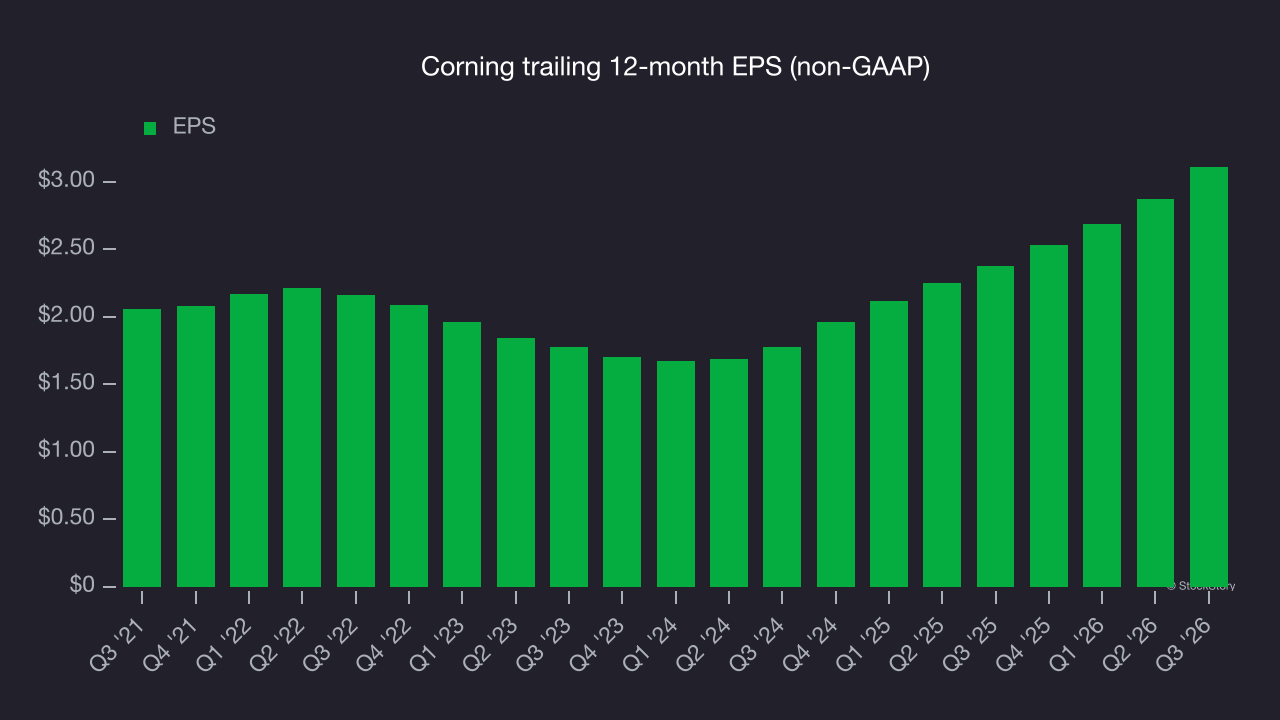
Corning’s EPS grew at an 8.6% compounded annual growth rate over the last five years, higher than its 6% annualized revenue growth. This indicates the company became more profitable on a per-share basis as it expanded.
A closer look at Corning’s earnings helps explain the drivers of its performance. As noted earlier, Corning’s operating margin expanded by 1.1 percentage points over the last five years. This was the most relevant factor (aside from the revenue impact) behind its higher earnings; interest expenses and taxes can also affect EPS but don’t tell us as much about a company’s fundamentals.
As with revenue, we analyze EPS over a more recent period because it can provide insight into an emerging theme or development for the business.
For Corning, its two-year annual EPS growth of 32.2% was higher than its five-year trend. This acceleration made it one of the faster-growing industrials companies in recent history.
In Q3, Corning reported adjusted EPS of $0.91, up from $0.67 in the same quarter last year. This result beat analysts’ consensus estimates by 3.4%. Over the next 12 months, Wall Street expects Corning’s full-year EPS to grow 29.7% from $3.11 to $4.03, according to S&P.
Key takeaways from Corning’s Q3 results
Corning’s quarter was weaker overall, with revenue missing expectations despite better news on earnings. EPS topped Wall Street’s consensus estimates, and next-quarter EPS guidance also exceeded analysts’ consensus estimates. Shares edged higher 1.1% to $130.22 immediately after the release.
When deciding whether to invest in Corning, the latest quarter matters, but not as much as longer-term business quality and valuation. For more on Corning, read our full research report here (it’s free).