

Freight delivery company Knight-Swift Transportation (NYSE: KNX) fell short of the markets revenue expectations in Q4 CY2025, with sales flat year on year at $1.86 billion. Its non-GAAP profit of $0.31 per share was 12.6% below analysts’ consensus estimates.
Is now the time to buy Knight-Swift Transportation? Find out by accessing our full research report, it’s free.
Knight-Swift Transportation (KNX) Q4 CY2025 Highlights:
- Revenue: $1.86 billion vs analyst estimates of $1.90 billion (flat year on year, 2.4% miss)
- Adjusted EPS: $0.31 vs analyst expectations of $0.35 (12.6% miss)
- Adjusted EBITDA: $204.5 million vs analyst estimates of $285.5 million (11% margin, 28.4% miss)
- Adjusted EPS guidance for Q1 CY2026 is $0.30 at the midpoint, below analyst estimates of $0.31
- Operating Margin: 1.4%, down from 4.2% in the same quarter last year
- Free Cash Flow Margin: 33.8%, up from 6.3% in the same quarter last year
- Market Capitalization: $8.94 billion
Company Overview
Covering 1.6 billion loaded miles in 2023 alone, Knight-Swift Transportation (NYSE: KNX) offers less-than-truckload and full truckload delivery services.
Revenue Growth
A company’s long-term performance is an indicator of its overall quality. Any business can put up a good quarter or two, but many enduring ones grow for years. Thankfully, Knight-Swift Transportation’s 9.8% annualized revenue growth over the last five years was solid. Its growth beat the average industrials company and shows its offerings resonate with customers.
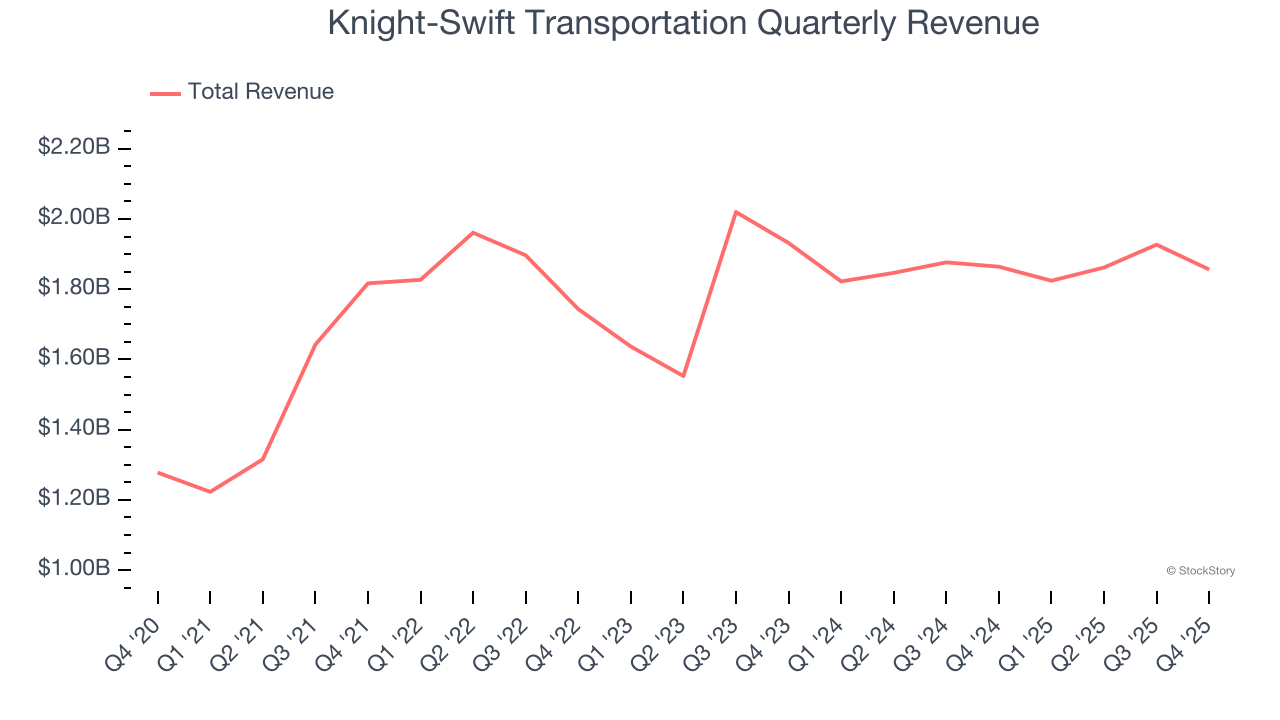
Long-term growth is the most important, but within industrials, a half-decade historical view may miss new industry trends or demand cycles. Knight-Swift Transportation’s recent performance shows its demand has slowed as its annualized revenue growth of 2.3% over the last two years was below its five-year trend. We also note many other Ground Transportation businesses have faced declining sales because of cyclical headwinds. While Knight-Swift Transportation grew slower than we’d like, it did do better than its peers. 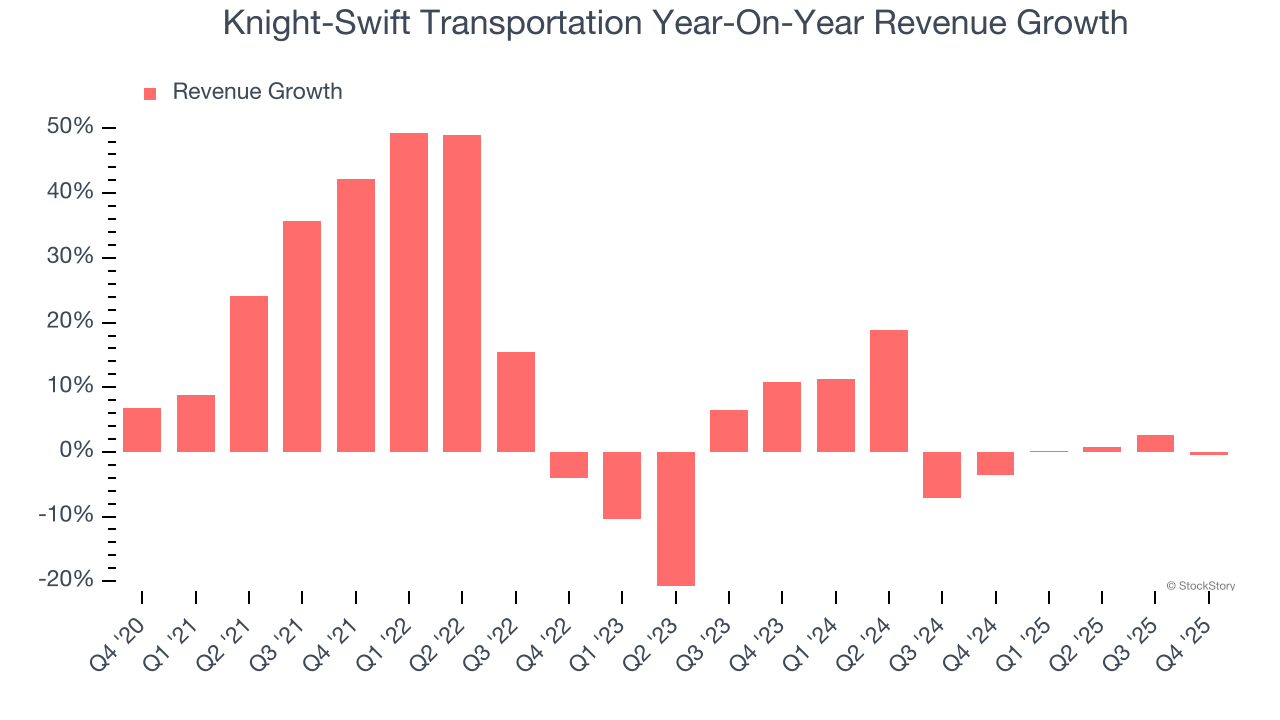
This quarter, Knight-Swift Transportation missed Wall Street’s estimates and reported a rather uninspiring 0.4% year-on-year revenue decline, generating $1.86 billion of revenue.
Looking ahead, sell-side analysts expect revenue to grow 5.8% over the next 12 months. Although this projection suggests its newer products and services will catalyze better top-line performance, it is still below average for the sector.
Software is eating the world and there is virtually no industry left that has been untouched by it. That drives increasing demand for tools helping software developers do their jobs, whether it be monitoring critical cloud infrastructure, integrating audio and video functionality, or ensuring smooth content streaming. Click here to access a free report on our 3 favorite stocks to play this generational megatrend.
Operating Margin
Operating margin is one of the best measures of profitability because it tells us how much money a company takes home after procuring and manufacturing its products, marketing and selling those products, and most importantly, keeping them relevant through research and development.
Knight-Swift Transportation has done a decent job managing its cost base over the last five years. The company has produced an average operating margin of 8.1%, higher than the broader industrials sector.
Analyzing the trend in its profitability, Knight-Swift Transportation’s operating margin decreased by 13.2 percentage points over the last five years. Many Ground Transportation companies also saw their margins fall (along with revenue, as mentioned above) because the cycle turned in the wrong direction. We hope Knight-Swift Transportation can emerge from this a stronger company, as the silver lining of a downturn is that market share can be won and efficiencies found.
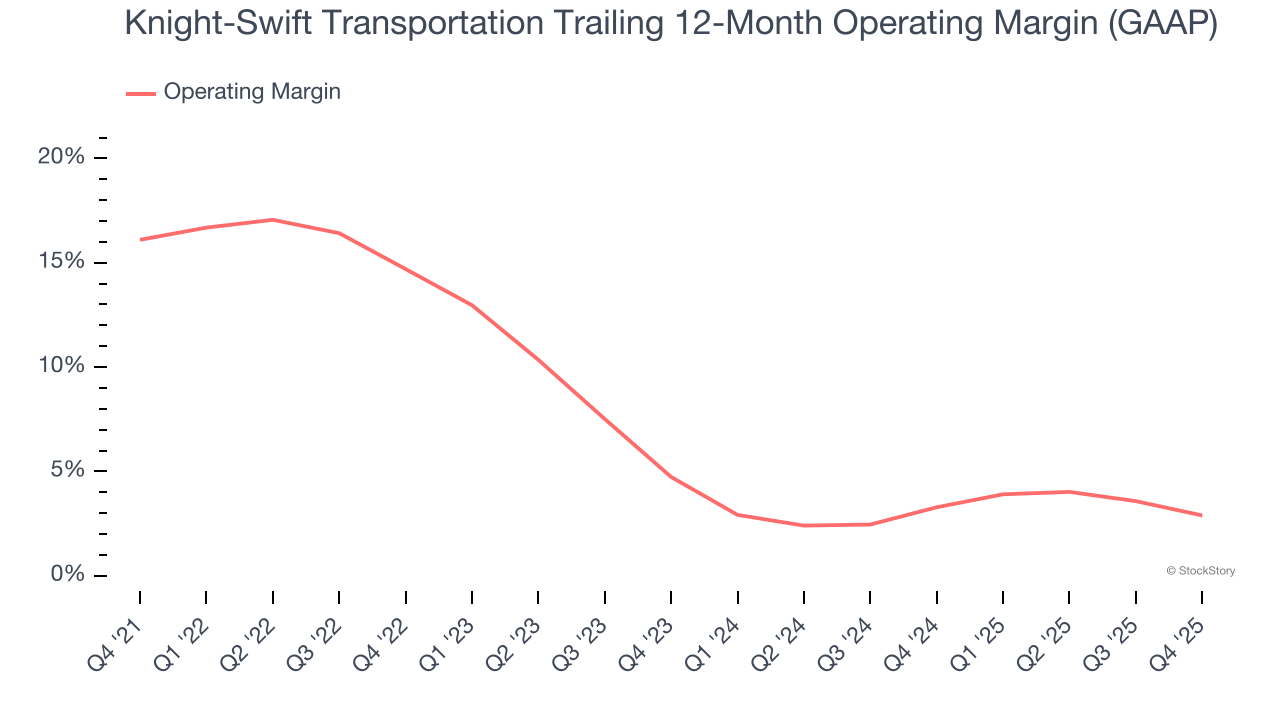
This quarter, Knight-Swift Transportation generated an operating margin profit margin of 1.4%, down 2.8 percentage points year on year. Conversely, its gross margin actually rose, so we can assume its recent inefficiencies were driven by increased operating expenses like marketing, R&D, and administrative overhead.
Earnings Per Share
We track the long-term change in earnings per share (EPS) for the same reason as long-term revenue growth. Compared to revenue, however, EPS highlights whether a company’s growth is profitable.
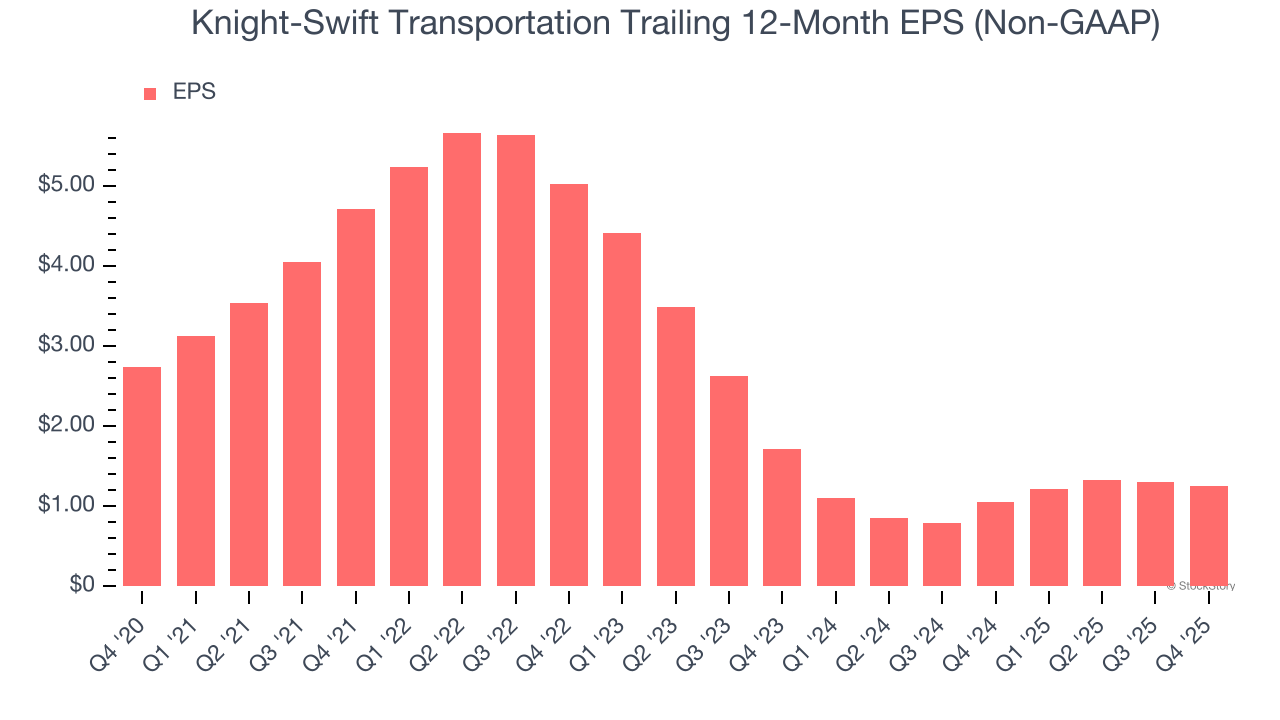
Sadly for Knight-Swift Transportation, its EPS declined by 14.4% annually over the last five years while its revenue grew by 9.8%. This tells us the company became less profitable on a per-share basis as it expanded due to non-fundamental factors such as interest expenses and taxes.
Diving into the nuances of Knight-Swift Transportation’s earnings can give us a better understanding of its performance. As we mentioned earlier, Knight-Swift Transportation’s operating margin declined by 13.2 percentage points over the last five years. This was the most relevant factor (aside from the revenue impact) behind its lower earnings; interest expenses and taxes can also affect EPS but don’t tell us as much about a company’s fundamentals.
Like with revenue, we analyze EPS over a shorter period to see if we are missing a change in the business.
For Knight-Swift Transportation, its two-year annual EPS declines of 14.4% are similar to its five-year trend. These results were bad no matter how you slice the data.
In Q4, Knight-Swift Transportation reported adjusted EPS of $0.31, down from $0.36 in the same quarter last year. This print missed analysts’ estimates. Over the next 12 months, Wall Street expects Knight-Swift Transportation’s full-year EPS of $1.26 to grow 58.6%.
Key Takeaways from Knight-Swift Transportation’s Q4 Results
We struggled to find many positives in these results. Its revenue missed and its EBITDA fell short of Wall Street’s estimates. Overall, this quarter could have been better. The stock traded down 3.1% to $56.13 immediately after reporting.
Knight-Swift Transportation didn’t show it’s best hand this quarter, but does that create an opportunity to buy the stock right now? The latest quarter does matter, but not nearly as much as longer-term fundamentals and valuation, when deciding if the stock is a buy. We cover that in our actionable full research report which you can read here (it’s free).