Packaging manufacturer Ball (NYSE: BLL) reported Q3 CY2025 results topping the market’s revenue expectations, with sales up 9.6% year on year to $3.38 billion. Its GAAP profit of $1.18 per share was 29.2% above analysts’ consensus estimates.
Is now the time to buy Ball? Find out by accessing our full research report, it’s free for active Edge members.
Ball (BALL) Q3 CY2025 Highlights:
- Revenue: $3.38 billion vs analyst estimates of $3.34 billion (9.6% year-on-year growth, 1.3% beat)
- EPS (GAAP): $1.18 vs analyst estimates of $0.91 (29.2% beat)
- Adjusted EBITDA: $650 million vs analyst estimates of $550.4 million (19.2% margin, 18.1% beat)
- Operating Margin: 23.9%, up from 9.1% in the same quarter last year
- Free Cash Flow Margin: 7.6%, down from 16% in the same quarter last year
- Market Capitalization: $12.82 billion
"Ball delivered strong third-quarter results, returning over $1 billion to shareholders in the first nine months of 2025. Our solid financial position, streamlined operating model, and disciplined growth strategy drove higher volumes and operating earnings. As we look to close out the year, we remain vigilant given ongoing geopolitical and macroeconomic volatility, but our team is well-positioned to execute and achieve our 2025 objectives. Continued focus on operational excellence is enhancing manufacturing efficiencies, while investments in innovation and sustainability enable our customers to meet evolving consumer needs. These actions, combined with rigorous cost management, provide resilience in the near term and reinforce our ability to deliver long-term value for our shareholders," said Daniel W. Fisher, chairman and chief executive officer.
Company Overview
Started with a $200 loan in 1880, Ball (NYSE: BLL) manufactures aluminum packaging for beverages, personal care, and household products as well as aerospace systems and other technologies.
Revenue Growth
A company’s long-term sales performance can indicate its overall quality. Any business can put up a good quarter or two, but many enduring ones grow for years. Over the last five years, Ball grew its sales at a sluggish 2.2% compounded annual growth rate. This fell short of our benchmarks and is a poor baseline for our analysis.
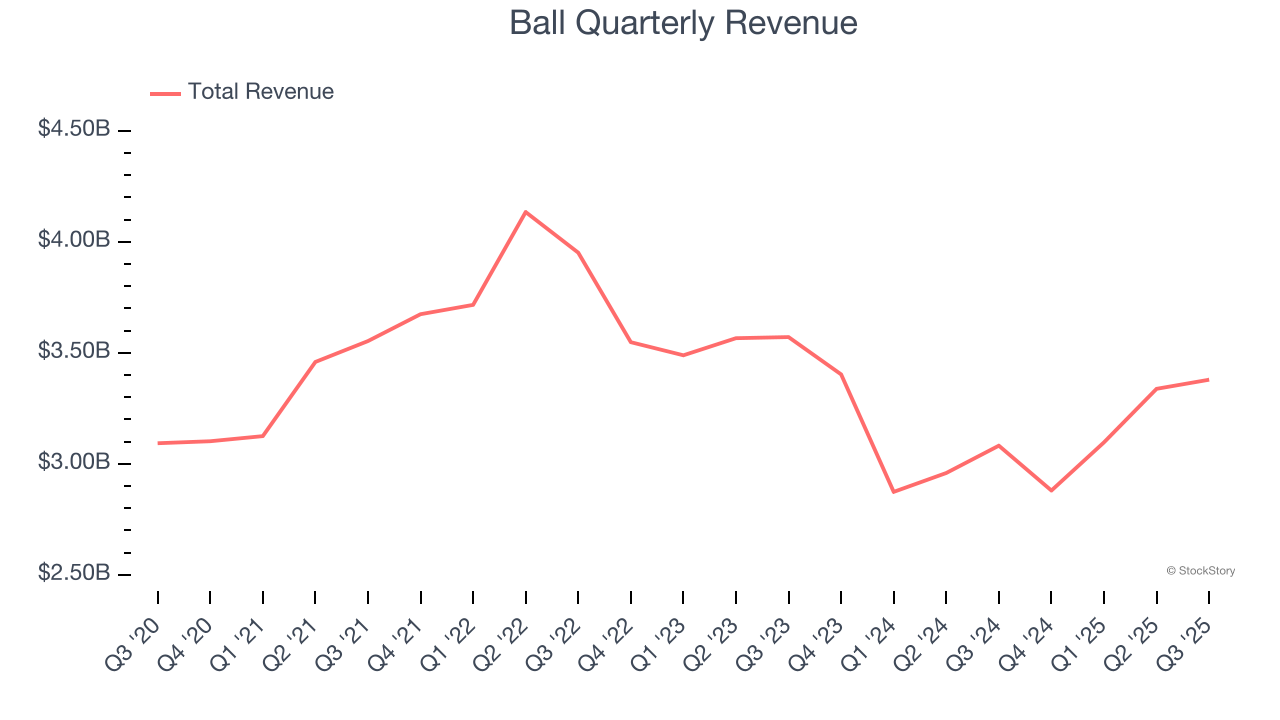
Long-term growth is the most important, but within industrials, a half-decade historical view may miss new industry trends or demand cycles. Ball’s performance shows it grew in the past but relinquished its gains over the last two years, as its revenue fell by 5.4% annually. 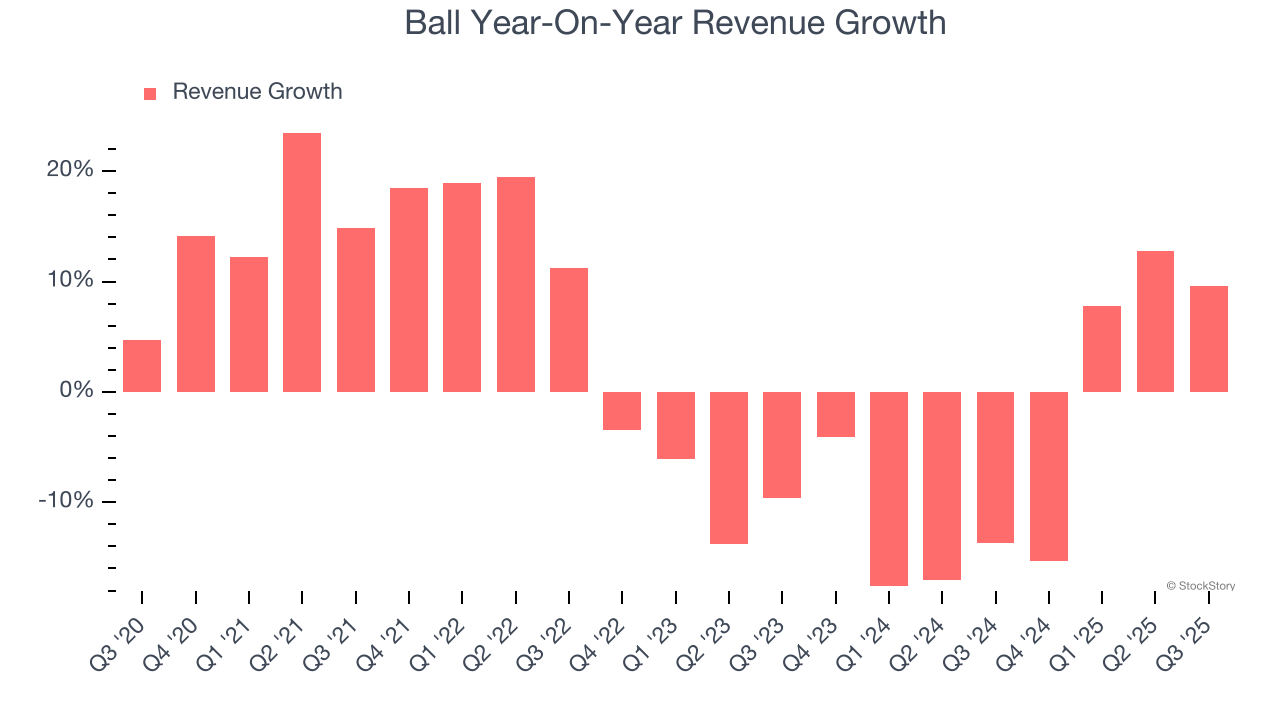
This quarter, Ball reported year-on-year revenue growth of 9.6%, and its $3.38 billion of revenue exceeded Wall Street’s estimates by 1.3%.
Looking ahead, sell-side analysts expect revenue to grow 4.1% over the next 12 months. Although this projection implies its newer products and services will fuel better top-line performance, it is still below the sector average.
Software is eating the world and there is virtually no industry left that has been untouched by it. That drives increasing demand for tools helping software developers do their jobs, whether it be monitoring critical cloud infrastructure, integrating audio and video functionality, or ensuring smooth content streaming. Click here to access a free report on our 3 favorite stocks to play this generational megatrend.
Operating Margin
Ball has done a decent job managing its cost base over the last five years. The company has produced an average operating margin of 9.2%, higher than the broader industrials sector.
Looking at the trend in its profitability, Ball’s operating margin rose by 2.7 percentage points over the last five years, as its sales growth gave it operating leverage. Its expansion was impressive, especially when considering most Industrial Packaging peers saw their margins plummet.
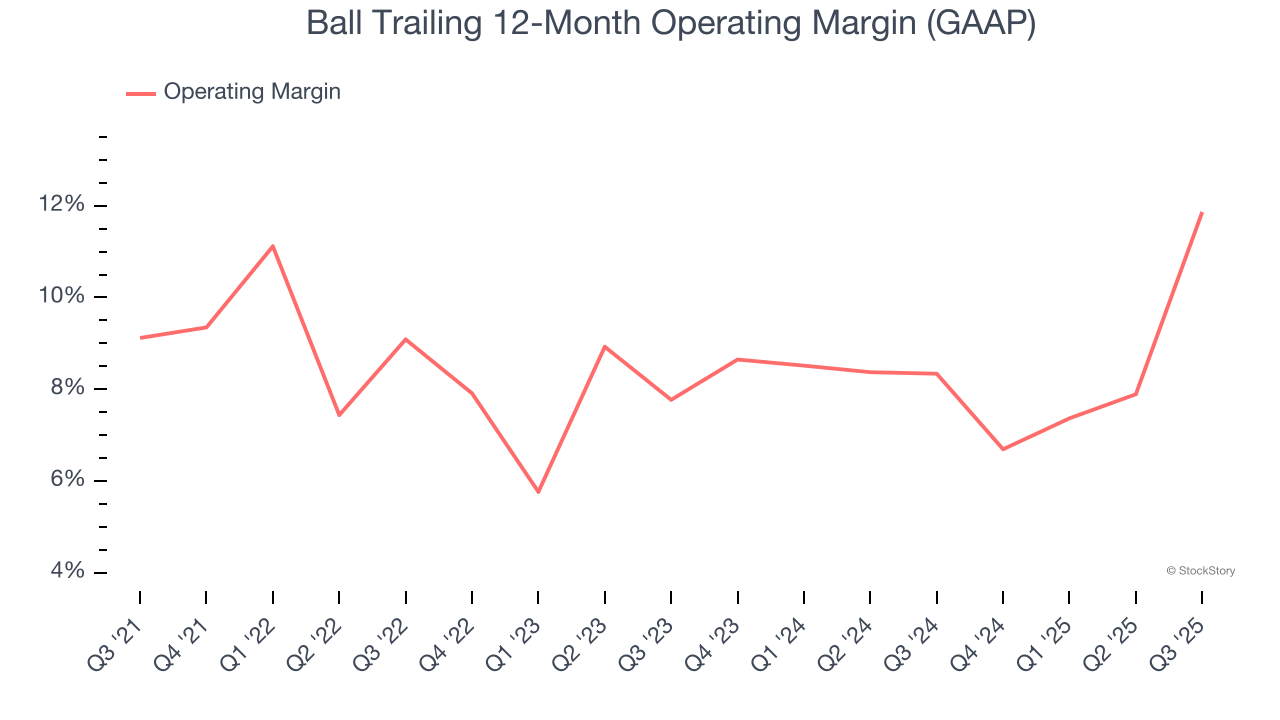
This quarter, Ball generated an operating margin profit margin of 23.9%, up 14.8 percentage points year on year. The increase was solid, and because its gross margin actually decreased, we can assume it was more efficient because its operating expenses like marketing, R&D, and administrative overhead grew slower than its revenue.
Earnings Per Share
We track the long-term change in earnings per share (EPS) for the same reason as long-term revenue growth. Compared to revenue, however, EPS highlights whether a company’s growth is profitable.
Ball’s EPS grew at a decent 9.6% compounded annual growth rate over the last five years, higher than its 2.2% annualized revenue growth. This tells us the company became more profitable on a per-share basis as it expanded.
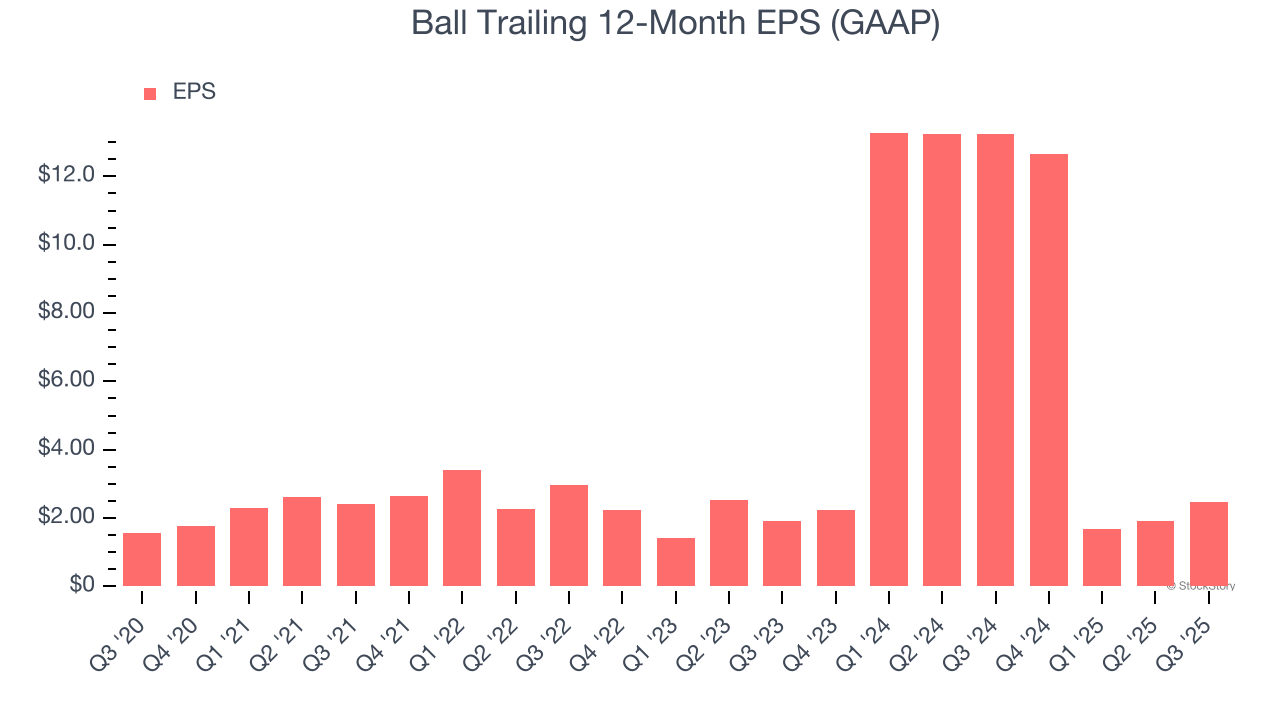
We can take a deeper look into Ball’s earnings to better understand the drivers of its performance. As we mentioned earlier, Ball’s operating margin expanded by 2.7 percentage points over the last five years. On top of that, its share count shrank by 18%. These are positive signs for shareholders because improving profitability and share buybacks turbocharge EPS growth relative to revenue growth. 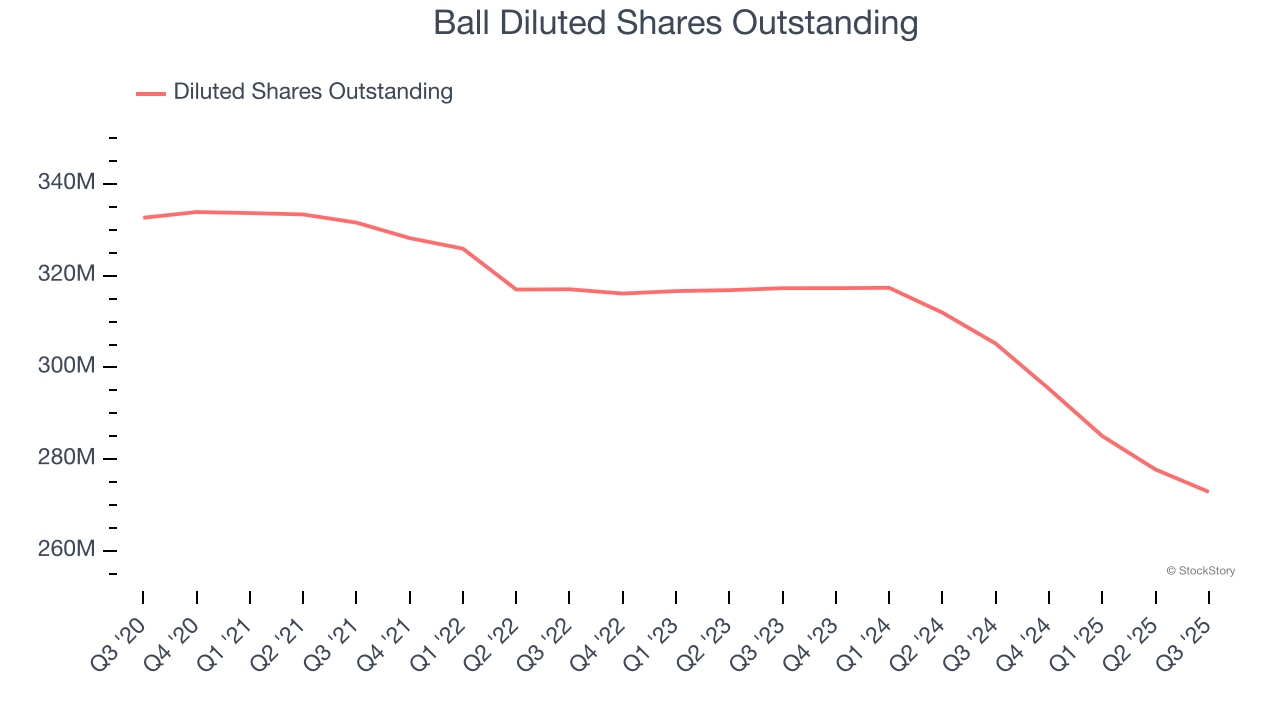
Like with revenue, we analyze EPS over a shorter period to see if we are missing a change in the business.
For Ball, its two-year annual EPS growth of 13.3% was higher than its five-year trend. This acceleration made it one of the faster-growing industrials companies in recent history.
In Q3, Ball reported EPS of $1.18, up from $0.65 in the same quarter last year. This print easily cleared analysts’ estimates, and shareholders should be content with the results. Over the next 12 months, Wall Street expects Ball’s full-year EPS of $2.46 to grow 39.7%.
Key Takeaways from Ball’s Q3 Results
It was good to see Ball beat analysts’ revenue and EPS expectations this quarter. Zooming out, we think this was a good print with some key areas of upside. The stock remained flat at $47.05 immediately following the results.
Big picture, is Ball a buy here and now? If you’re making that decision, you should consider the bigger picture of valuation, business qualities, as well as the latest earnings. We cover that in our actionable full research report which you can read here, it’s free for active Edge members.