
Workforce solutions provider ManpowerGroup (NYSE: MAN) reported Q1 CY2026 results topping the market’s revenue expectations, with sales up 10.3% year on year to $4.51 billion. Its GAAP profit of $0.05 per share was 90.1% below analysts’ consensus estimates.
Is now the time to buy ManpowerGroup? Find out by accessing our full research report, it’s free.
ManpowerGroup (MAN) Q1 CY2026 Highlights:
- Revenue: $4.51 billion vs analyst estimates of $4.42 billion (10.3% year-on-year growth, 2.1% beat)
- EPS (GAAP): $0.05 vs analyst expectations of $0.50 (restructuring costs and strategic transformation program costs which reduced earnings per share by $0.46 in the first quarter, slight beat excluding this)
- Adjusted EBITDA: $54.5 million vs analyst estimates of $75.57 million (1.2% margin, 27.9% miss)
- EPS (GAAP) guidance for Q2 CY2026 is $0.96 at the midpoint, beating analyst estimates by 3.7%
- Operating Margin: 0.6%, in line with the same quarter last year
- Free Cash Flow was -$135.3 million compared to -$166.9 million in the same quarter last year
- Market Capitalization: $1.43 billion
Jonas Prising, ManpowerGroup Chair & CEO, said, "We delivered solid performance in the quarter driven by disciplined execution and stabilization in demand trends across key markets. This marks five consecutive quarters of year over year revenue trend improvement. We grew our pipeline, saw continued momentum across the portfolio within our Manpower brand, and enhanced operating leverage through reductions in SG&A. Building on this progress and our ongoing transformational efforts, we are taking proactive steps to ensure we are positioned to succeed in any operating environment. This includes launching a strategic transformation program that is intended to not only improve our cost and margin profile, yet also enable ManpowerGroup to gain market share and deliver best-in-class client service. Further, we continue to make significant progress in advancing our AI strategy, including improving the candidate and client experience and bringing new products to market to enhance our competitive position and drive long-term value creation."
Company Overview
Founded during the post-World War II economic boom when businesses needed temporary workers, ManpowerGroup (NYSE: MAN) connects millions of people to employment opportunities through its global network of staffing, recruitment, and workforce management services.
Revenue Growth
A company’s long-term sales performance can indicate its overall quality. Any business can experience short-term success, but top-performing ones enjoy sustained growth for years.
With $18.38 billion in revenue over the past 12 months, ManpowerGroup is a behemoth in the business services sector and benefits from economies of scale, giving it an edge in distribution. This also enables it to gain more leverage on its fixed costs than smaller competitors and the flexibility to offer lower prices. However, its scale is a double-edged sword because it’s challenging to maintain high growth rates when you’ve already captured a large portion of the addressable market. For ManpowerGroup to boost its sales, it likely needs to adjust its prices, launch new offerings, or lean into foreign markets.
As you can see below, ManpowerGroup struggled to increase demand as its $18.38 billion of sales for the trailing 12 months was close to its revenue five years ago. This shows demand was soft, a rough starting point for our analysis.
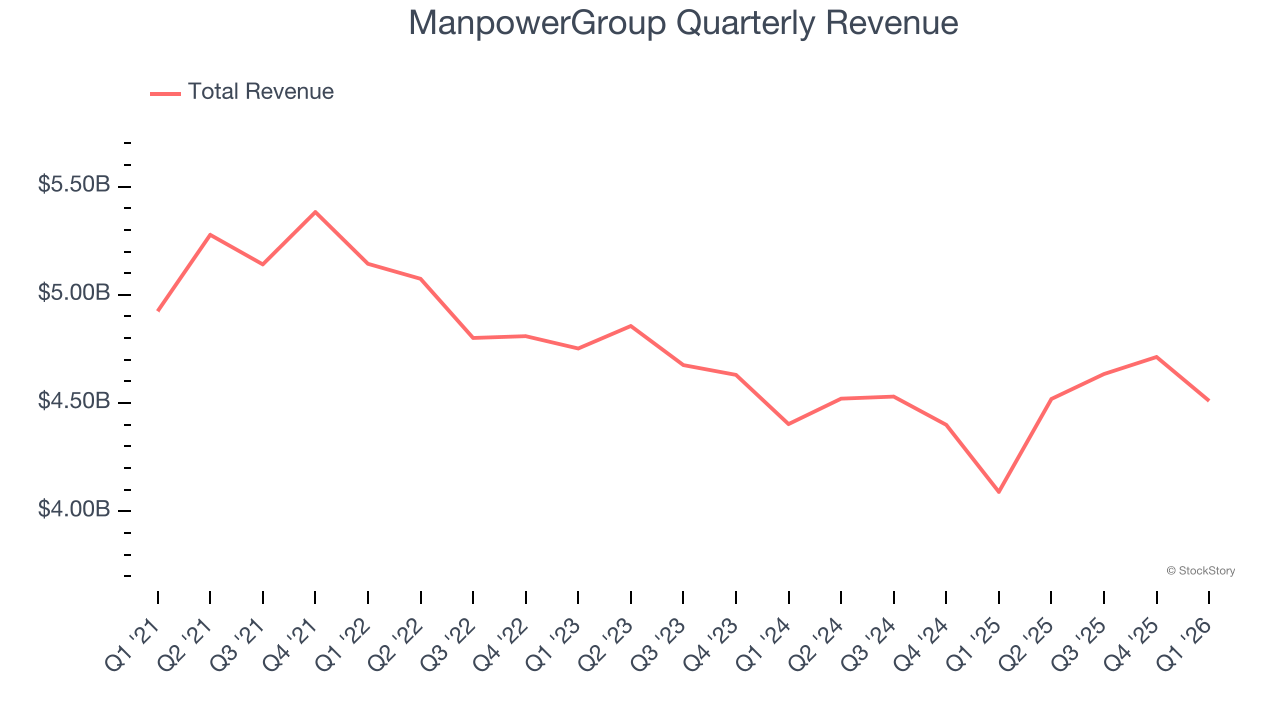
We at StockStory place the most emphasis on long-term growth, but within business services, a half-decade historical view may miss recent innovations or disruptive industry trends. Just like its five-year trend, ManpowerGroup’s revenue over the last two years was flat, suggesting it is in a slump. 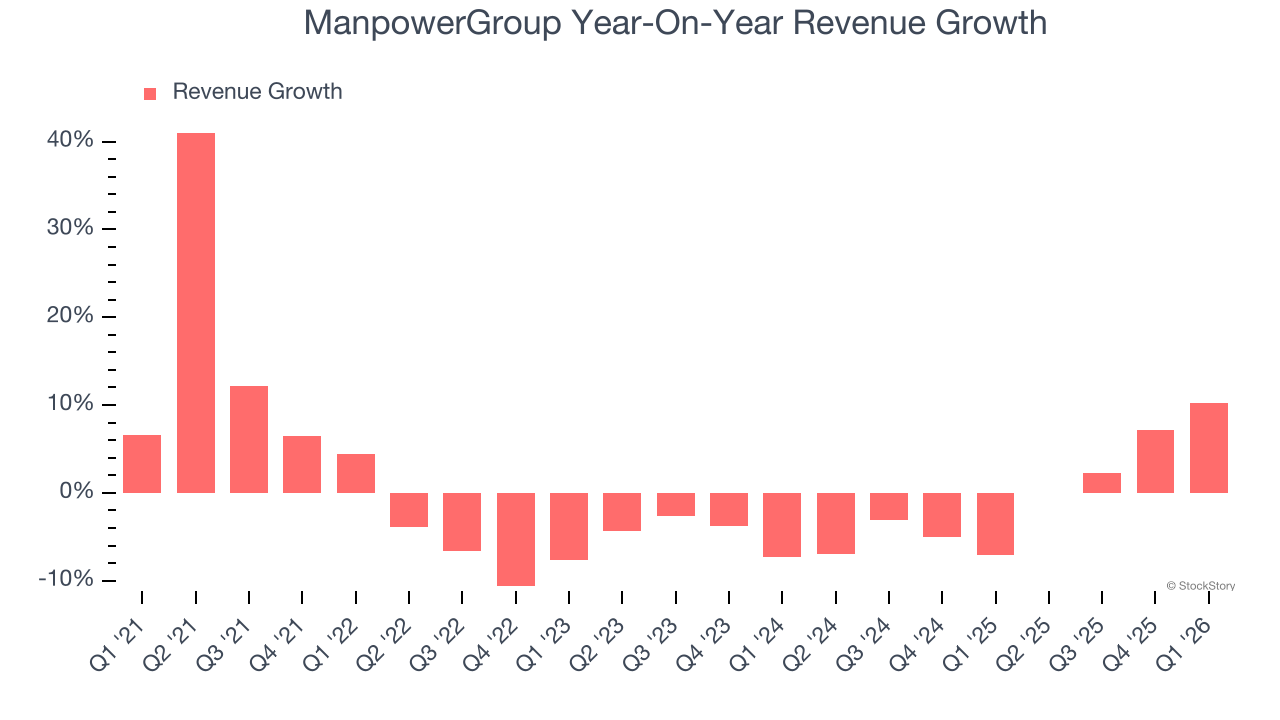
This quarter, ManpowerGroup reported year-on-year revenue growth of 10.3%, and its $4.51 billion of revenue exceeded Wall Street’s estimates by 2.1%.
Looking ahead, sell-side analysts expect revenue to grow 2.8% over the next 12 months. Although this projection indicates its newer products and services will spur better top-line performance, it is still below average for the sector.
ALSO WORTH WATCHING: Nvidia’s Quiet Partner. Nvidia’s chips cost a hundred grand. The connectors that make them work cost even more. One company makes them all.
Every AI server needs specialized infrastructure the chip companies don’t make. High-speed cables. Power connectors. Thermal sensors. This 90-year-old company built a monopoly on it. The AI boom just started. This stock is still flying under the radar. Claim The Stock Ticker Here for FREE.
Adjusted Operating Margin
ManpowerGroup was profitable over the last five years but held back by its large cost base. Its average adjusted operating margin of 2.5% was weak for a business services business.
Analyzing the trend in its profitability, ManpowerGroup’s adjusted operating margin decreased by 1.5 percentage points over the last five years. ManpowerGroup’s performance was poor no matter how you look at it - it shows that costs were rising and it couldn’t pass them onto its customers.
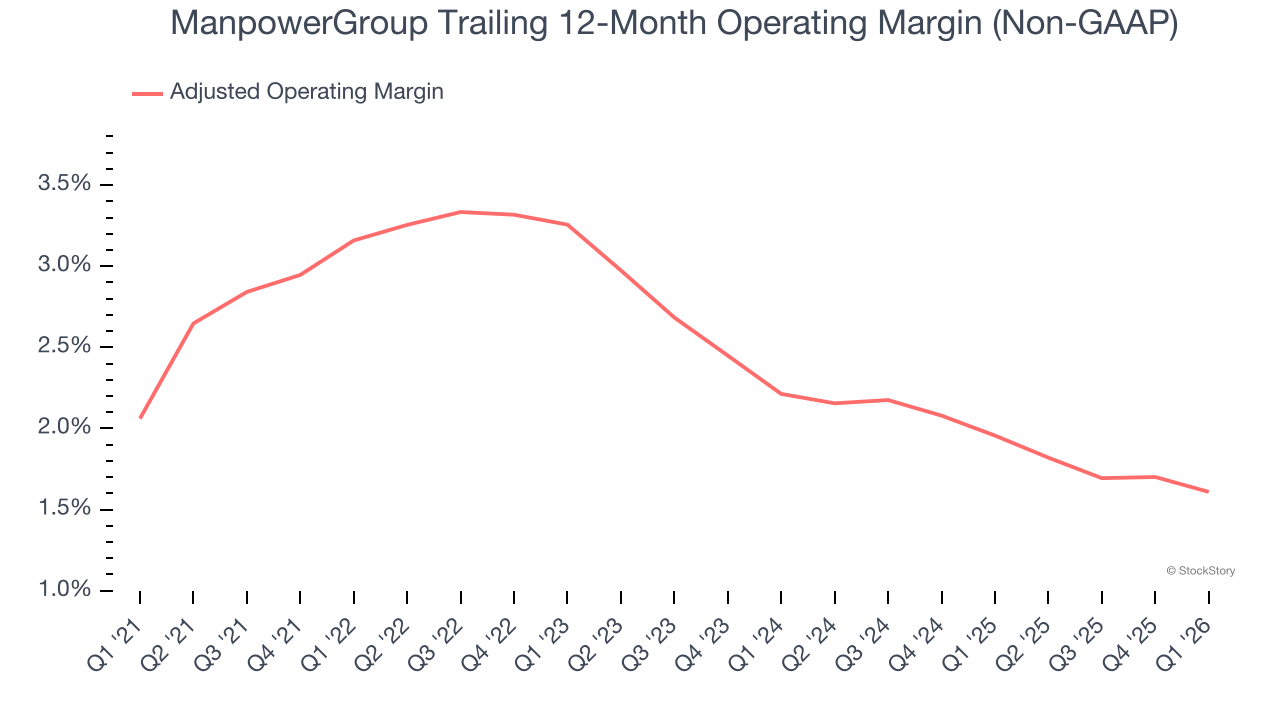
This quarter, ManpowerGroup’s breakeven margin was 0.8%, in line with the same quarter last year. This indicates the company’s overall cost structure has been relatively stable.
Earnings Per Share
We track the long-term change in earnings per share (EPS) for the same reason as long-term revenue growth. Compared to revenue, however, EPS highlights whether a company’s growth is profitable.
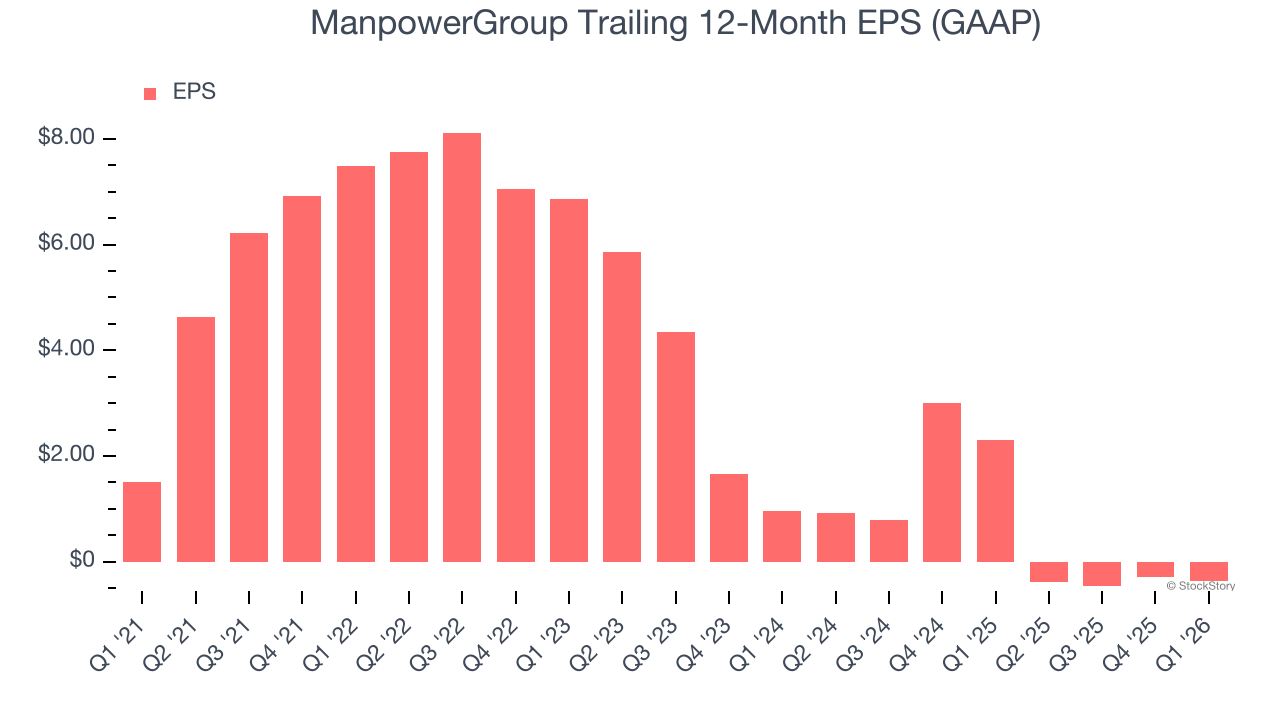
Sadly for ManpowerGroup, its EPS declined by 17.5% annually over the last five years while its revenue was flat. This tells us the company struggled because its fixed cost base made it difficult to adjust to choppy demand.
We can take a deeper look into ManpowerGroup’s earnings to better understand the drivers of its performance. As we mentioned earlier, ManpowerGroup’s adjusted operating margin was flat this quarter but declined by 1.5 percentage points over the last five years. This was the most relevant factor (aside from the revenue impact) behind its lower earnings; interest expenses and taxes can also affect EPS but don’t tell us as much about a company’s fundamentals.
Like with revenue, we analyze EPS over a shorter period to see if we are missing a change in the business.
For ManpowerGroup, its two-year annual EPS declines of 54.2% show it’s continued to underperform. These results were bad no matter how you slice the data.
In Q1, ManpowerGroup reported EPS of $0.05, down from $0.12 in the same quarter last year. This print missed analysts’ estimates. Over the next 12 months, Wall Street is optimistic. Analysts forecast ManpowerGroup’s full-year EPS of negative $0.37 will flip to positive $3.84.
Key Takeaways from ManpowerGroup’s Q1 Results
We enjoyed seeing ManpowerGroup beat analysts’ revenue and EPS in the quarter if the latter excludes a one-time restructuring charge. EPS guidance for next quarter also exceeded expectations. Overall, this was a solid quarter. The stock remained flat at $30.77 immediately after reporting.
Is ManpowerGroup an attractive investment opportunity at the current price? What happened in the latest quarter matters, but not as much as longer-term business quality and valuation, when deciding whether to invest in this stock. We cover that in our actionable full research report which you can read here (it’s free).