
Computer hardware and IT solutions company Dell (NYSE: DELL) reported Q4 CY2025 results beating Wall Street’s revenue expectations, with sales up 39.5% year on year to $33.38 billion. On top of that, next quarter’s revenue guidance ($35.2 billion at the midpoint) was surprisingly good and 21.4% above what analysts were expecting. Its non-GAAP profit of $3.89 per share was 10.4% above analysts’ consensus estimates.
Is now the time to buy Dell? Find out by accessing our full research report, it’s free.
Dell (DELL) Q4 CY2025 Highlights:
- Revenue: $33.38 billion vs analyst estimates of $31.72 billion (39.5% year-on-year growth, 5.2% beat)
- Adjusted EPS: $3.89 vs analyst estimates of $3.52 (10.4% beat)
- Revenue Guidance for Q1 CY2026 is $35.2 billion at the midpoint, above analyst estimates of $28.99 billion
- Adjusted EPS guidance for the upcoming financial year 2027 is $11.52 at the midpoint, in line with analyst estimates
- Operating Margin: 9.3%, in line with the same quarter last year
- Free Cash Flow was $3.95 billion, up from -$117 million in the same quarter last year
- Market Capitalization: $81.83 billion
Company Overview
Founded by Michael Dell in his University of Texas dorm room in 1984 with just $1,000, Dell Technologies (NYSE: DELL) provides hardware, software, and services that help organizations build their IT infrastructure, manage cloud environments, and enable digital transformation.
Revenue Growth
Examining a company’s long-term performance can provide clues about its quality. Even a bad business can shine for one or two quarters, but a top-tier one grows for years.
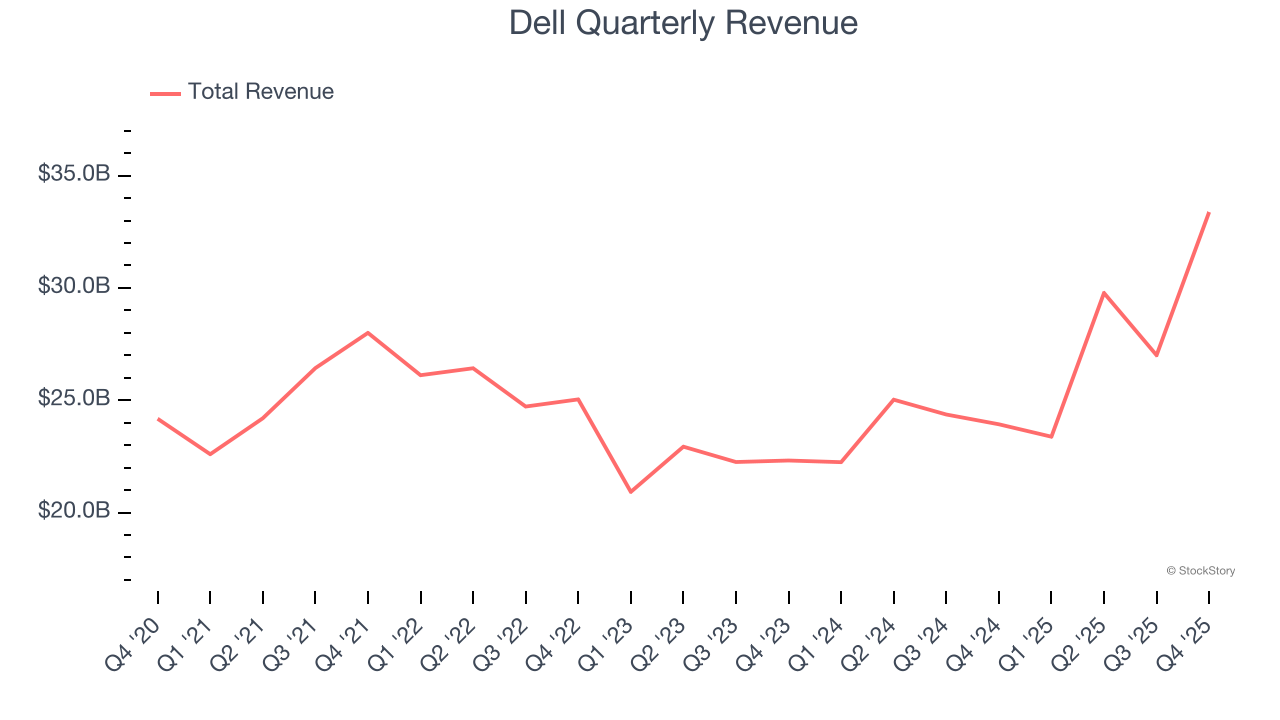
With $113.5 billion in revenue over the past 12 months, Dell is a behemoth in the business services sector and benefits from economies of scale, giving it an edge in distribution. This also enables it to gain more leverage on its fixed costs than smaller competitors and the flexibility to offer lower prices.
As you can see below, Dell’s 5.5% annualized revenue growth over the last five years was decent. This shows its offerings generated slightly more demand than the average business services company, a useful starting point for our analysis.
We at StockStory place the most emphasis on long-term growth, but within business services, a half-decade historical view may miss recent innovations or disruptive industry trends. Dell’s annualized revenue growth of 13.3% over the last two years is above its five-year trend, suggesting its demand recently accelerated. 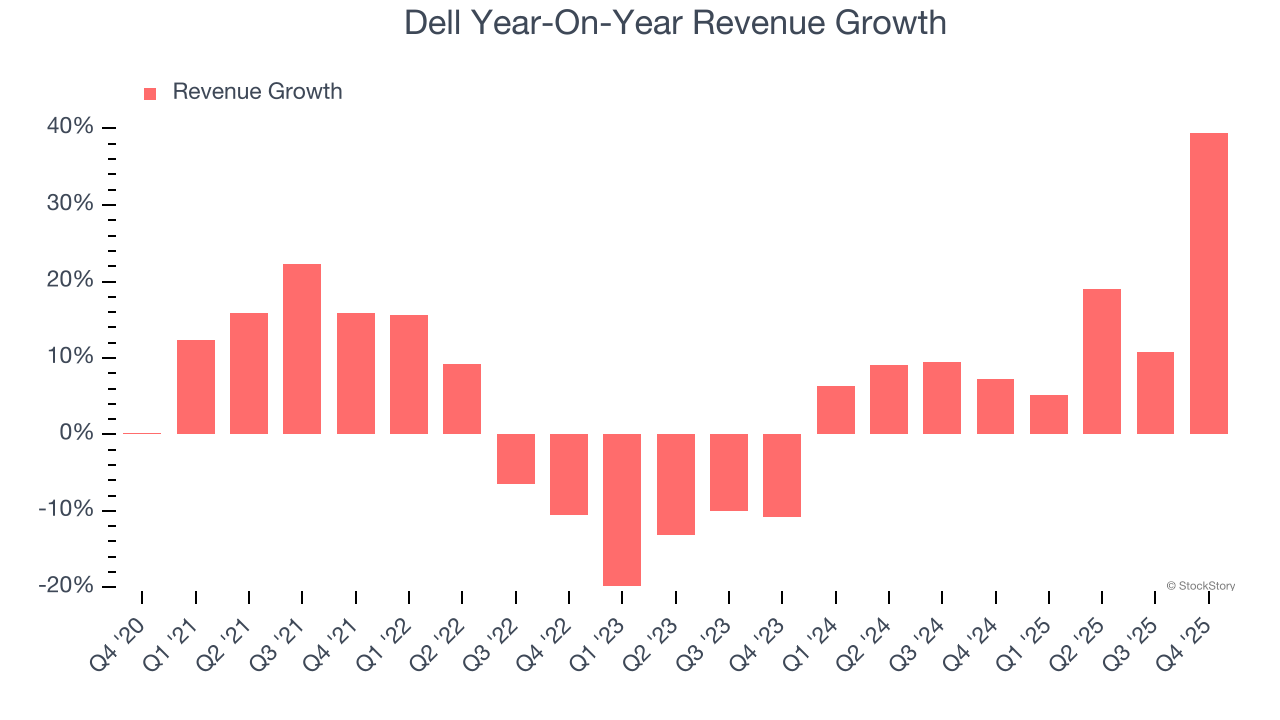
We can dig further into the company’s revenue dynamics by analyzing its most important segments, Infrastructure Solutions and Client Solutions, which are 58.7% and 40.4% of revenue. Over the last two years, Dell’s Infrastructure Solutions revenue (servers and storage) averaged 32.3% year-on-year growth while its Client Solutions revenue (PCs, monitors, displays) averaged 5.5% growth. 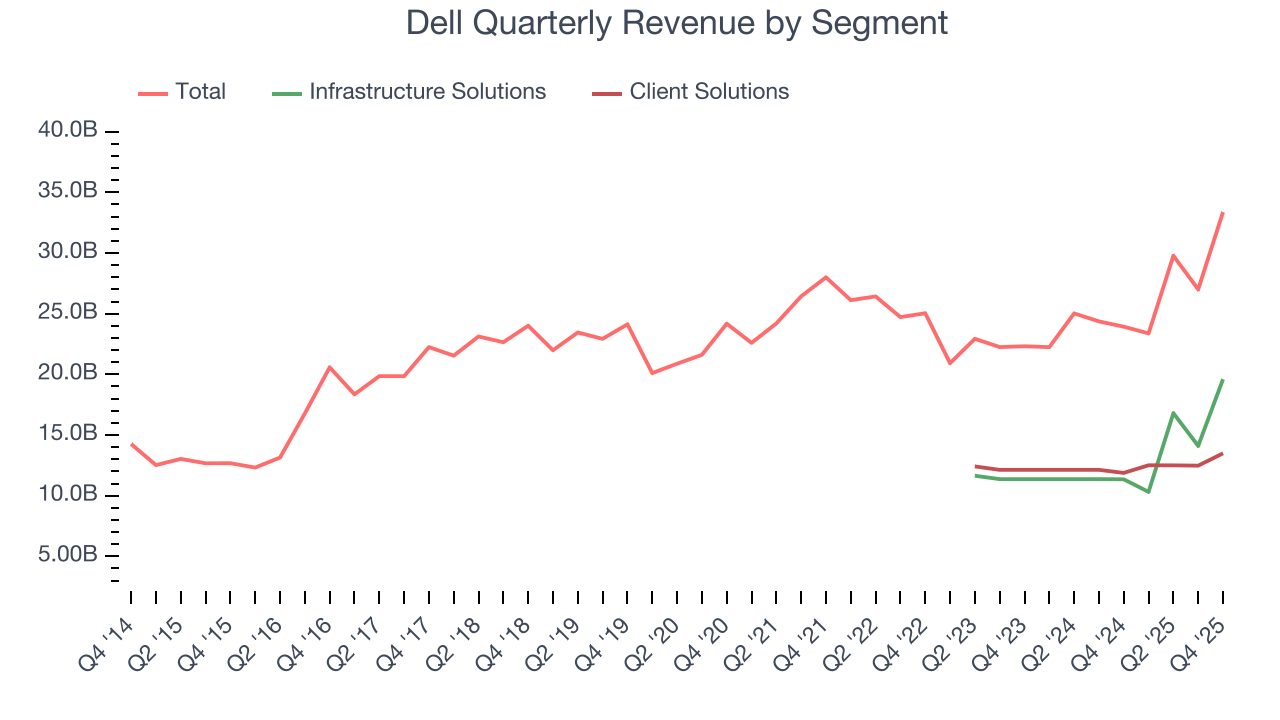
This quarter, Dell reported wonderful year-on-year revenue growth of 39.5%, and its $33.38 billion of revenue exceeded Wall Street’s estimates by 5.2%. Company management is currently guiding for a 50.6% year-on-year increase in sales next quarter.
Looking further ahead, sell-side analysts expect revenue to grow 9.9% over the next 12 months, a deceleration versus the last two years. We still think its growth trajectory is attractive given its scale and suggests the market sees success for its products and services.
Software is eating the world and there is virtually no industry left that has been untouched by it. That drives increasing demand for tools helping software developers do their jobs, whether it be monitoring critical cloud infrastructure, integrating audio and video functionality, or ensuring smooth content streaming. Click here to access a free report on our 3 favorite stocks to play this generational megatrend.
Operating Margin
Dell was profitable over the last five years but held back by its large cost base. Its average operating margin of 6% was weak for a business services business.
On the plus side, Dell’s operating margin rose by 2.6 percentage points over the last five years, as its sales growth gave it operating leverage.
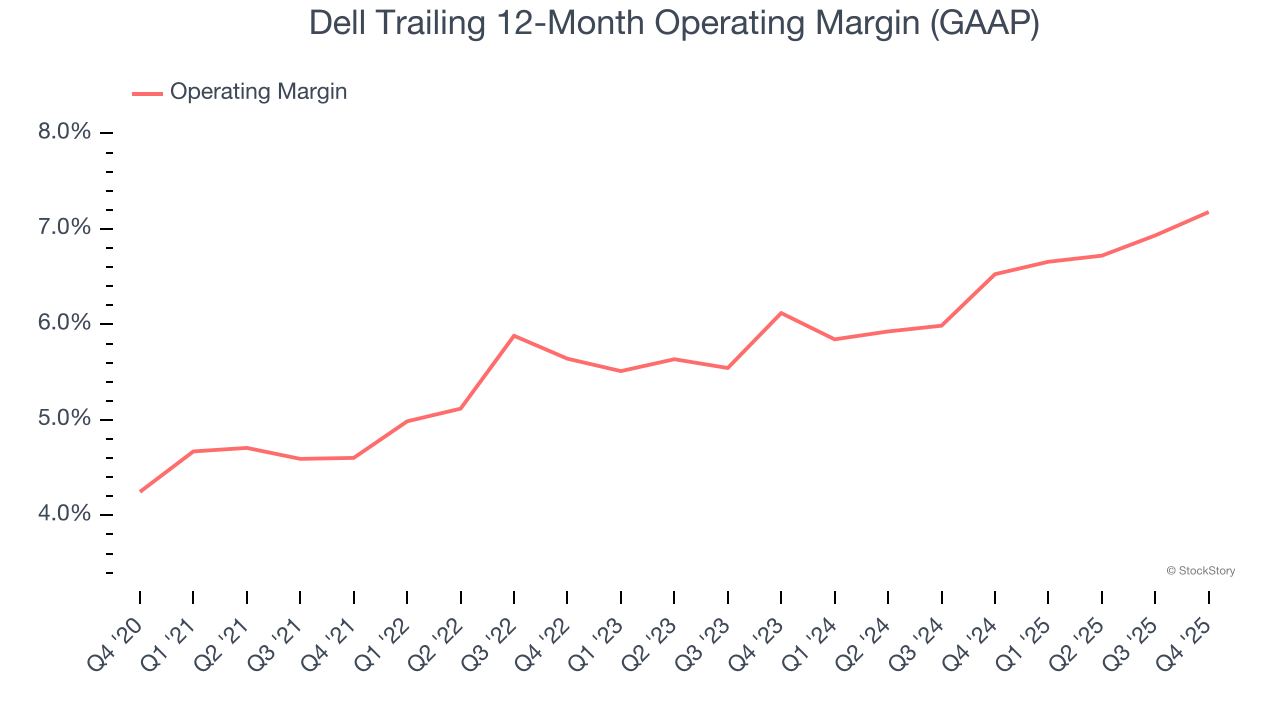
In Q4, Dell generated an operating margin profit margin of 9.3%, in line with the same quarter last year. This indicates the company’s overall cost structure has been relatively stable.
Earnings Per Share
We track the long-term change in earnings per share (EPS) for the same reason as long-term revenue growth. Compared to revenue, however, EPS highlights whether a company’s growth is profitable.
Dell’s unimpressive 5.3% annual EPS growth over the last five years aligns with its revenue performance. On the bright side, this tells us its incremental sales were profitable.
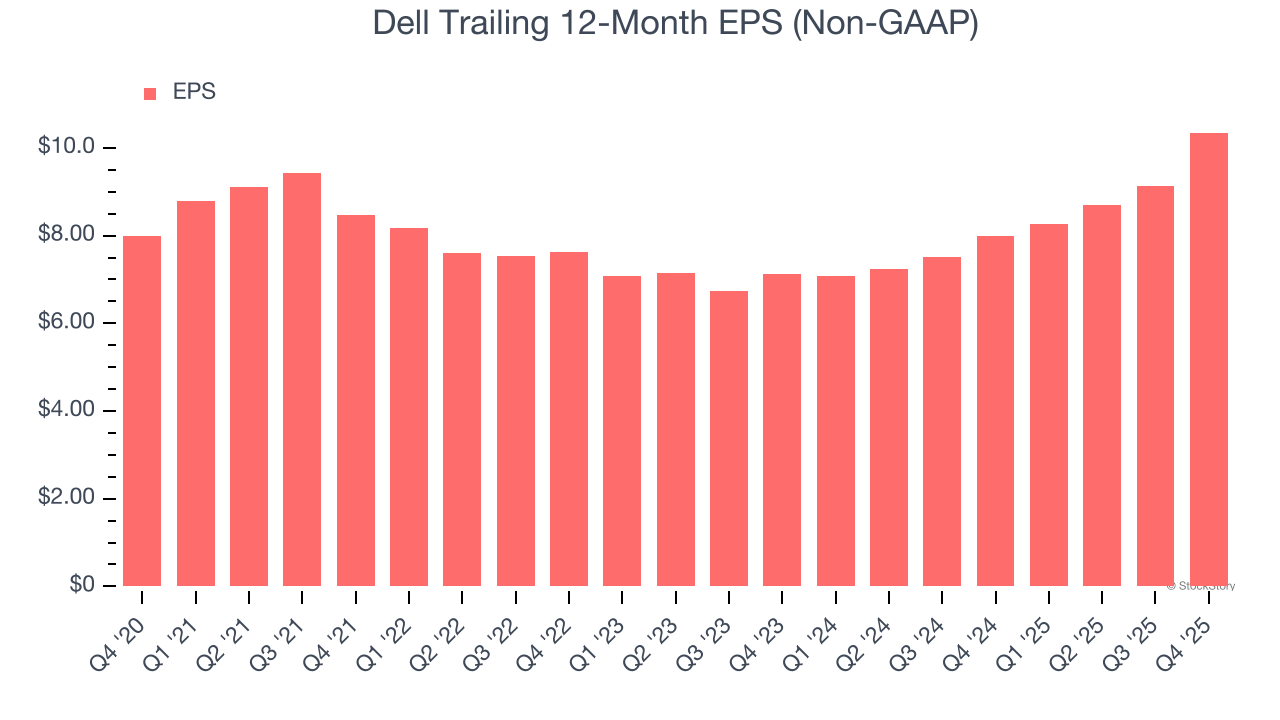
Like with revenue, we analyze EPS over a shorter period to see if we are missing a change in the business.
Dell’s two-year annual EPS growth of 20.5% was fantastic and topped its 13.3% two-year revenue growth.
Diving into Dell’s quality of earnings can give us a better understanding of its performance. While we mentioned earlier that Dell’s operating margin was flat this quarter, a two-year view shows its margin has expanded. This was the most relevant factor (aside from the revenue impact) behind its higher earnings; interest expenses and taxes can also affect EPS but don’t tell us as much about a company’s fundamentals.
In Q4, Dell reported adjusted EPS of $3.89, up from $2.68 in the same quarter last year. This print easily cleared analysts’ estimates, and shareholders should be content with the results. Over the next 12 months, Wall Street expects Dell’s full-year EPS of $10.35 to grow 10.6%.
Key Takeaways from Dell’s Q4 Results
We were impressed by how significantly Dell blew past analysts’ EPS guidance for next quarter expectations this quarter. We were also excited its revenue outperformed Wall Street’s estimates by a wide margin. Zooming out, we think this quarter featured some important positives. The stock traded up 9.9% to $134.16 immediately after reporting.
Dell may have had a good quarter, but does that mean you should invest right now? If you’re making that decision, you should consider the bigger picture of valuation, business qualities, as well as the latest earnings. We cover that in our actionable full research report which you can read here (it’s free).