Financial derivatives exchange CME Group (NASDAQ: CME) reported Q3 2026 results beating Wall Street’s revenue expectations, with sales up 13% year on year to $1.74 billion. Its non-GAAP profit of $3.02 per share was 1% above analysts’ consensus estimates.
Is now the time to buy CME Group? Find out by accessing our full research report, it’s free.
CME Group (CME) Q3 2026 Highlights:
- Revenue: $1.74 billion vs analyst estimates of $1.72 billion (13% year-on-year growth, 0.9% beat)
- Pre-tax Profit: $1.35 billion (78% margin)
- Adjusted EPS: $3.02 vs analyst estimates of $2.99 (1% beat)
- Market Capitalization: $106.2 billion
"As uncertainty intensified in Q3, clients turned to CME Group in record numbers to manage risk and capitalize on opportunities," said CME Group Chairman and Chief Executive Officer Terry Duffy. "Our average daily volume reached 29.4 million contracts, the highest Q3 ADV on record. With double-digit volume growth across all six asset classes, Q3 was our second highest quarter ever for revenue and adjusted net income. We launched several innovative new products and generated a new high of $100 billion in average daily capital efficiencies. We also made strong progress in our cloud migration, making CME Group the only exchange to offer clients the choice of both co-location and cloud-managed services to expand access to our markets for years to come."
Company Overview
Born from the Chicago Mercantile Exchange founded in 1898 as a butter and egg trading venue, CME Group (NASDAQ: CME) operates the world's largest derivatives marketplace where traders can buy and sell futures and options contracts across interest rates, equities, currencies, commodities, and more.
Revenue Growth
A company’s long-term sales performance can indicate its overall quality. Any business can experience short-term success, but top-performing ones enjoy sustained growth for years. Luckily, CME Group’s revenue grew at a decent 8.5% compounded annual growth rate over the last five years. Its growth was slightly above the average financials company and shows its offerings resonate with customers.
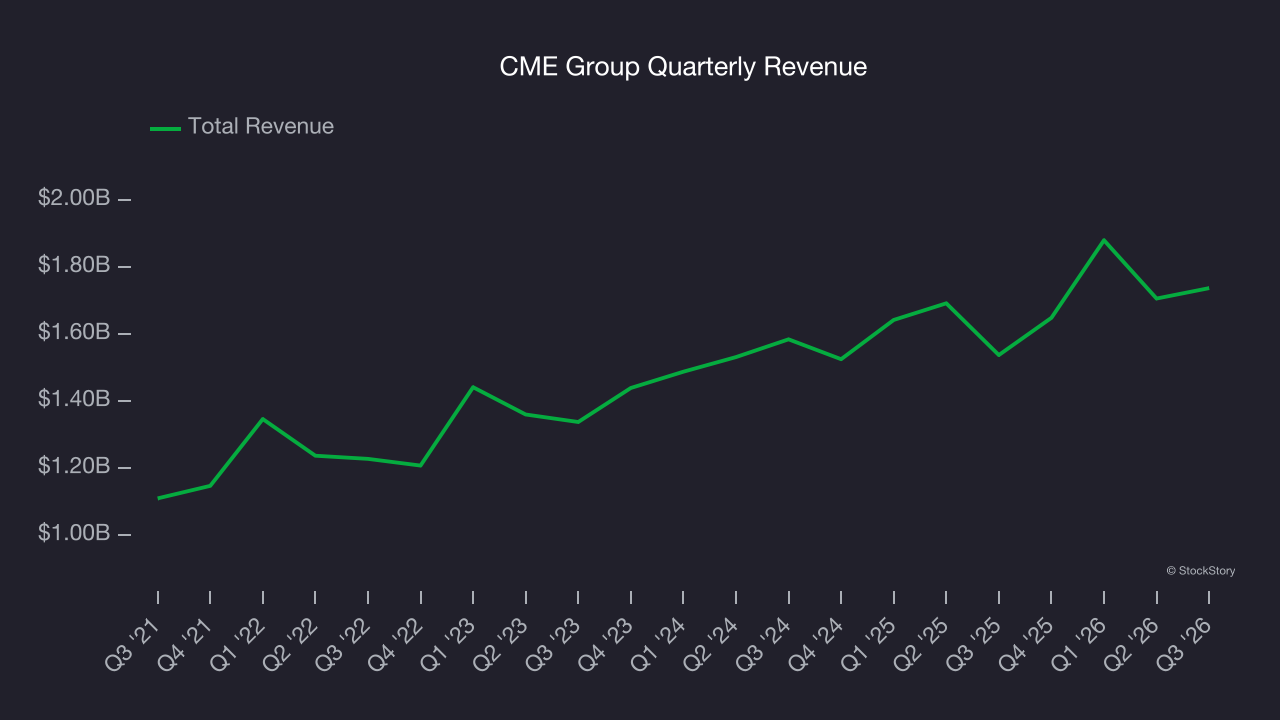
We at StockStory place the most emphasis on long-term growth, but within financials, a half-decade historical view may miss recent interest rate changes, market returns, and industry trends. CME Group’s recent performance shows its demand has slowed as its annualized revenue growth of 7.4% over the last two years was below its five-year trend. We’re wary when companies in the sector see decelerations in revenue growth, as it could signal changing consumer tastes aided by low switching costs. 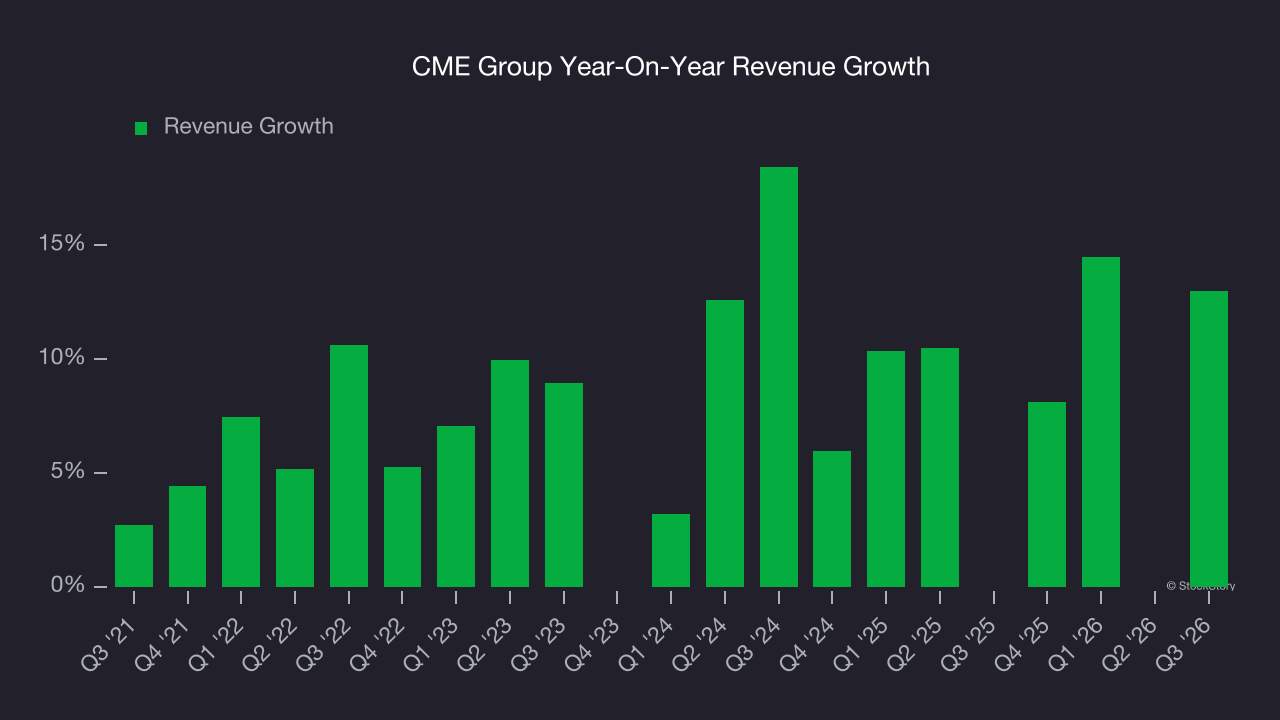 Note: Quarters not shown were determined to be outliers because they were impacted by outsized investment gains/losses that are not indicative of the recurring fundamentals of the business.
This quarter, CME Group reported year-on-year revenue growth of 13%, and its $1.74 billion of revenue exceeded Wall Street’s estimates by 0.9%.
WHILE YOU’RE HERE: The Next Palantir? One satellite company captures images of every point on Earth. Every single day. The Pentagon wants it. Hedge funds are using it to beat earnings. You’ve probably never heard of it.
This is what the early days of Palantir looked like before it became a giant. Same playbook. Different technology. If you missed Palantir, you need to see this. Claim The Stock Ticker for Free HERE.
Key Takeaways from CME Group’s Q3 Results
It was good to see CME Group narrowly top analysts’ revenue expectations this quarter. On the other hand, its EBITDA missed. Zooming out, we think this was a mixed quarter. The stock remained flat at $292.74 immediately following the results.
Is CME Group an attractive investment opportunity right now? If you’re making that decision, you should consider the bigger picture of valuation, business qualities, as well as the latest earnings. We cover that in our actionable full research report which you can read here (it’s free).