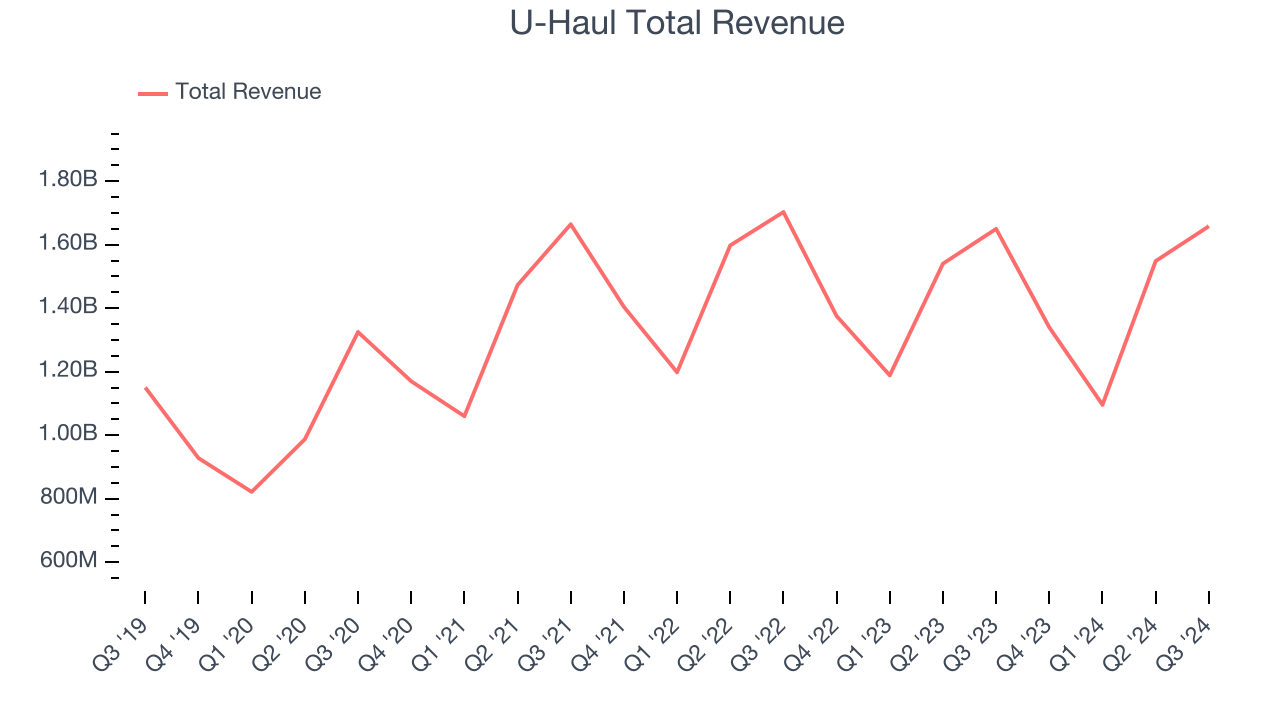
Moving and storage solutions provider U-Haul (NYSE: UHAL) missed Wall Street’s revenue expectations in Q3 CY2024, with sales flat year on year at $1.66 billion. Its GAAP profit of $0.91 per share was also 31.1% below analysts’ consensus estimates.
Is now the time to buy U-Haul? Find out by accessing our full research report, it’s free.
U-Haul (UHAL) Q3 CY2024 Highlights:
- Revenue: $1.66 billion vs analyst estimates of $1.69 billion (1.7% miss)
- EPS: $0.91 vs analyst expectations of $1.32 (31.1% miss)
- Gross Margin (GAAP): 96.2%, up from 35% in the same quarter last year
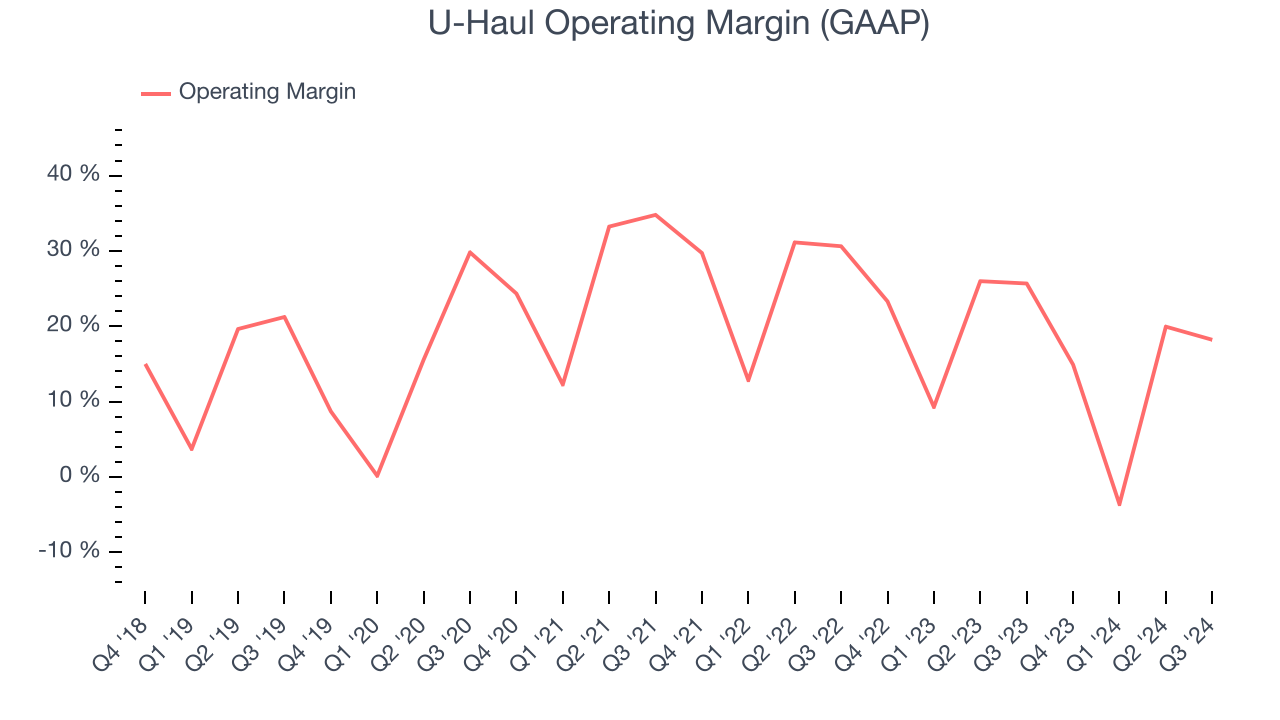
- Operating Margin: 18.2%, down from 25.7% in the same quarter last year
- Market Capitalization: $13.73 billion
“We are continuing to fine tune our U-Move efforts. Customers remain uncertain and conservative,” stated Joe Shoen, Chairman of U-Haul Holding Company.
Company Overview
Founded by a husband and wife, U-Haul (NYSE: UHAL) offers truck and trailer rentals and self storage units.
Ground Transportation
The growth of e-commerce and global trade continues to drive demand for shipping services, especially last-mile delivery, presenting opportunities for ground transportation companies. The industry continues to invest in data, analytics, and autonomous fleets to optimize efficiency and find the most cost-effective routes. Despite the essential services this industry provides, ground transportation companies are still at the whim of economic cycles. Consumer spending, for example, can greatly impact the demand for these companies’ offerings while fuel costs can influence profit margins.
Sales Growth
A company’s long-term performance can give signals about its business quality. Even a bad business can shine for one or two quarters, but a top-tier one grows for years. Over the last five years, U-Haul grew its sales at a decent 7.8% compounded annual growth rate. This is a useful starting point for our analysis.

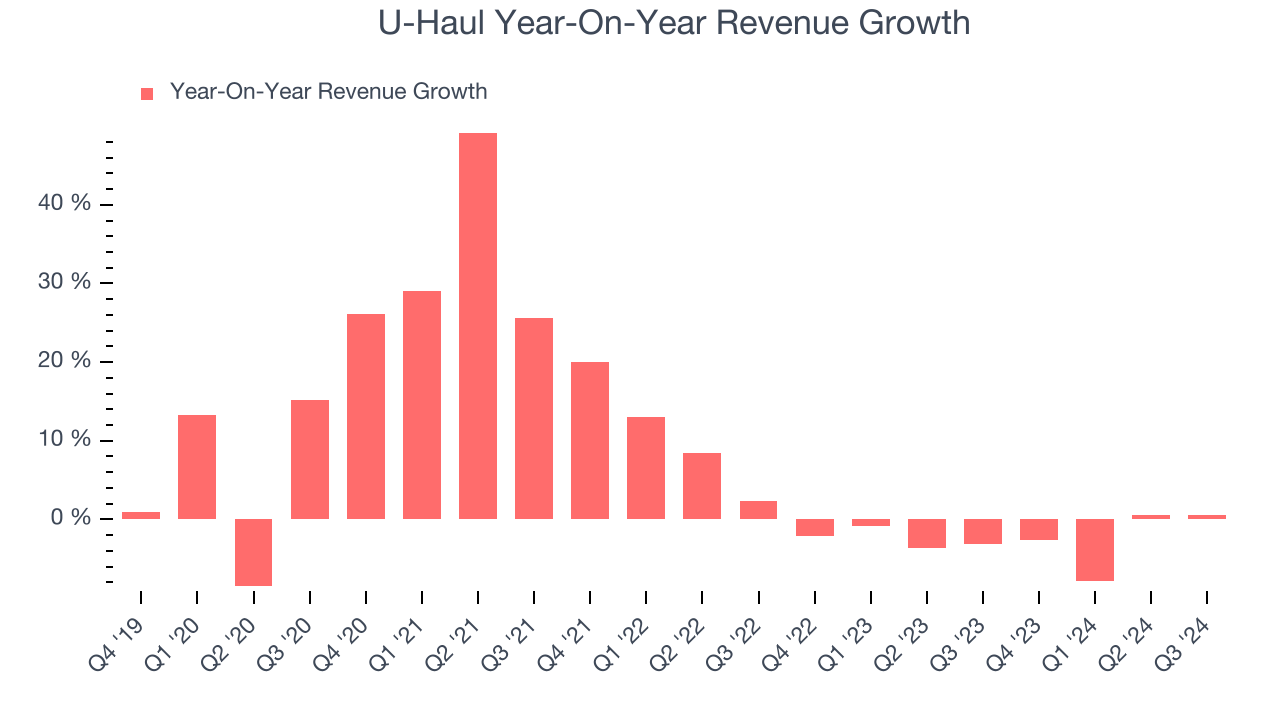
Long-term growth is the most important, but within industrials, a half-decade historical view may miss new industry trends or demand cycles. U-Haul’s recent history marks a sharp pivot from its five-year trend as its revenue has shown annualized declines of 2.2% over the last two years. U-Haul isn’t alone in its struggles as the Ground Transportation industry experienced a cyclical downturn, with many similar businesses seeing lower sales at this time. 
This quarter, U-Haul’s $1.66 billion of revenue was flat year on year, falling short of Wall Street’s estimates.
We also like to judge companies based on their projected revenue growth, but not enough Wall Street analysts cover the company for it to have reliable consensus estimates.
When a company has more cash than it knows what to do with, buying back its own shares can make a lot of sense–as long as the price is right. Luckily, we’ve found one, a low-priced stock that is gushing free cash flow AND buying back shares. Click here to claim your Special Free Report on a fallen angel growth story that is already recovering from a setback.
Operating Margin
U-Haul has been a well-oiled machine over the last five years. It demonstrated elite profitability for an industrials business, boasting an average operating margin of 21.4%. This result isn’t surprising as its high gross margin gives it a favorable starting point.
Analyzing the trend in its profitability, U-Haul’s annual operating margin decreased by 1.9 percentage points over the last five years. Even though its margin is still high, shareholders will want to see U-Haul become more profitable in the future.

In Q3, U-Haul generated an operating profit margin of 18.2%, down 7.5 percentage points year on year. Conversely, its gross margin actually rose, so we can assume its recent inefficiencies were driven by increased operating expenses like marketing, R&D, and administrative overhead.
Earnings Per Share
Analyzing revenue trends tells us about a company’s historical growth, but the long-term change in its earnings per share (EPS) points to the profitability of that growth – for example, a company could inflate its sales through excessive spending on advertising and promotions.
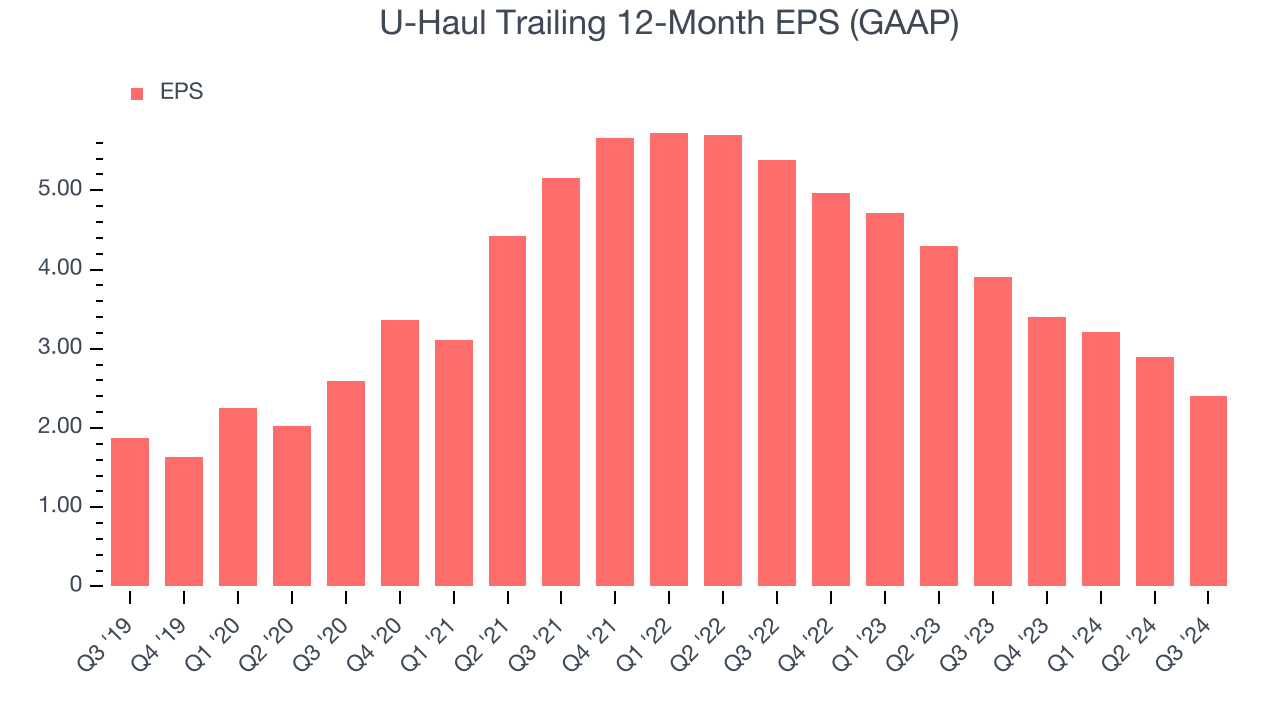
U-Haul’s EPS grew at an unimpressive 5.1% compounded annual growth rate over the last five years, lower than its 7.8% annualized revenue growth. This tells us the company became less profitable on a per-share basis as it expanded.

Diving into the nuances of U-Haul’s earnings can give us a better understanding of its performance. As we mentioned earlier, U-Haul’s operating margin declined by 1.9 percentage points over the last five years. This was the most relevant factor (aside from the revenue impact) behind its lower earnings; taxes and interest expenses can also affect EPS but don’t tell us as much about a company’s fundamentals.
Like with revenue, we analyze EPS over a shorter period to see if we are missing a change in the business.
For U-Haul, its two-year annual EPS declines of 33.1% show it’s continued to underperform. These results were bad no matter how you slice the data.In Q3, U-Haul reported EPS at $0.91, down from $1.39 in the same quarter last year. This print missed analysts’ estimates. We also like to analyze expected EPS growth based on Wall Street analysts’ consensus projections, but there is insufficient data.
Key Takeaways from U-Haul’s Q3 Results
We struggled to find many strong positives in these results as its revenue and EPS missed Wall Street’s estimates. Overall, this quarter could have been better. The stock traded down 2.9% to $74.14 immediately after reporting.
The latest quarter from U-Haul’s wasn’t that good. One earnings report doesn’t define a company’s quality, though, so let’s explore whether the stock is a buy at the current price. When making that decision, it’s important to consider its valuation, business qualities, as well as what has happened in the latest quarter. We cover that in our actionable full research report which you can read here, it’s free.


