
The Barchart platform is rich with tools and information for investors wanting to gain an edge in the market. And that’s regardless if your focus is exclusive to stocks, options or both.
One excellent feature is the ability to easily screen for larger institutional options activity or the collective and forceful action of individual traders buying and selling calls and puts.
The powerful tools on Barchart even allow, with just a modicum of detective work, for users to track options spreads.
For options traders, this type of information offers a stronger understanding of what the market’s largest derivatives players are doing, and possibly worth pursuing in our own trading accounts.
A Simple and Effective Stock Screener for Unusual Options Activity
For keeping a pulse on the U.S. options market and whose company’s shares are part of the Nasdaq-100 ($IUXX), I begin with a basic stock screener.
That’s correct. My search starts with Barchart’s screening tool for stocks, not options.
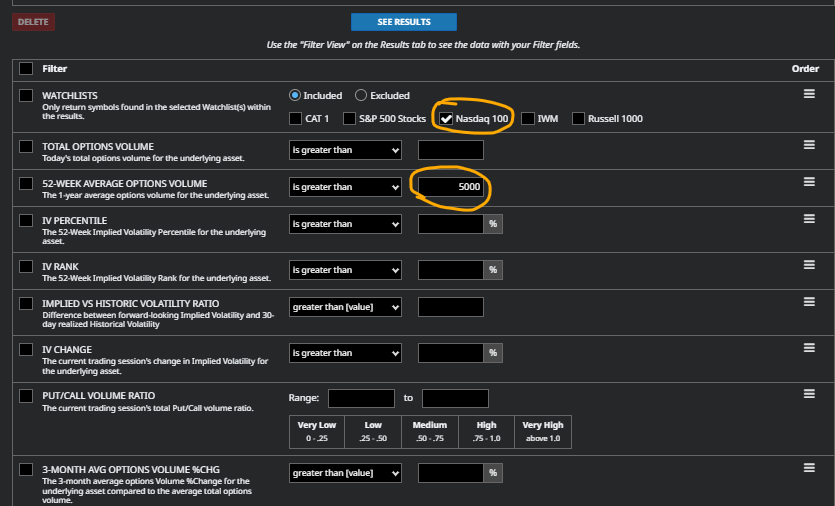
On this stock “options” screener the first order of business is putting in the individual filter criteria.
Shown above, there’s a total of nine inputs beginning with “Watchlists” at the top and “3-Month Avg Options Volume %Chg” at the bottom.
To provide a clearer and unbiased picture of what’s going on, nearly all of these criteria are entered without any filter values.
From the Watchlists criteria, and as this unusual options activity scan is solely for Nasdaq-100 stocks, that index is clicked on for confirmation.
The only other item that’s tweaked is the 52-week average options activity.
As an options trader I want to stay at arm’s length from stocks, even if it’s a larger-cap Nasdaq-100 company whose calls and puts aren’t typically active.
For options markets that are thinly traded on average, as a general rule, it’s best to avoid getting involved or otherwise risk intolerable and costly slippage.
To avoid those situations I set a baseline of 5,000 contracts. It’s a guesstimate input. But that level of daily options activity does a sufficient job at weeding while delivering plenty of unusual transactions to investigate further.
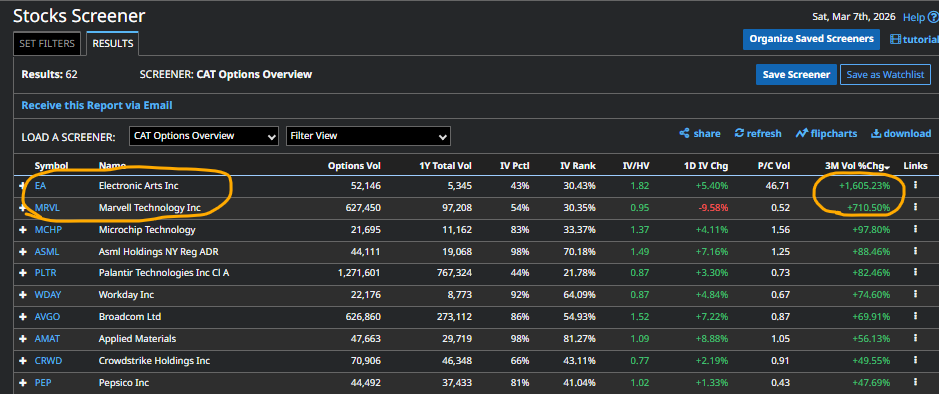
Today this simple but effective scan has helped unearth a couple of interesting options spreads with unusual activity in Electronic Arts (EA) and Marvell Technology (MRVL).
EA Stock’s April Butterfly Spread
Video game giant Electronic Arts landed itself in the top spot of our screener after toggling the “3M Vol %Chg criteria.”
Volume in EA’s options surged more than 1,600% above average on Friday on a tally of more than 52,500 contracts traded.
What also quickly stands out is the stock’s put activity. A heavily lopsided “P/C Vol” criteria of 46.71 indicates that for every one call traded, nearly 47 puts changed hands.
That’s interesting, but the devil is in the details as the saying goes.
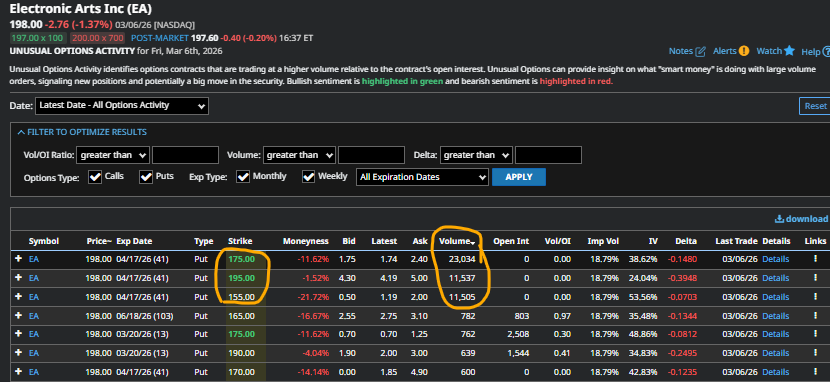
The next layer of investigation shown above uses Barchart’s Unusual Options Activity page for EA stock.
As I’ve highlighted, it appears an exceptionally large put butterfly spread of just more than 11,500 contracts is behind the session’s unusual volume.
That’s definitely even more interesting to spread traders. But there’s one additional step in order to see more important details.
By taking the investigation onto Barchart’s Options Flow page for EA stock’s options, then filtering for the April contract responsible for the butterfly, users can review key details such as the number of trades involved and spread pricing.
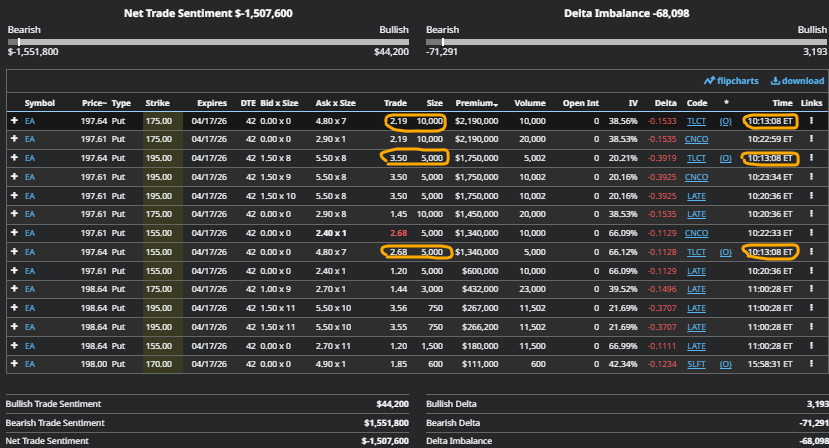
On the flow page, I’ve highlighted one of the larger butterfly transactions. At 10:13:08 ET, a 5,000 contract April 155-175-195 put spread went up for $4.01.
For this spread’s buyer, the maximum payoff of $15.99 is nearly 12% below Friday’s closing price of $198 in EA stock at the sold $175 put center strike.
Some may consider buying this butterfly quite the speculation. That’s especially true given that Electronic Arts has reached a definitive agreement with private equity, including Jared Kushner’s Affinity Partners, for $210 cash per share.
The EA deal is expected to close in mid-2026.
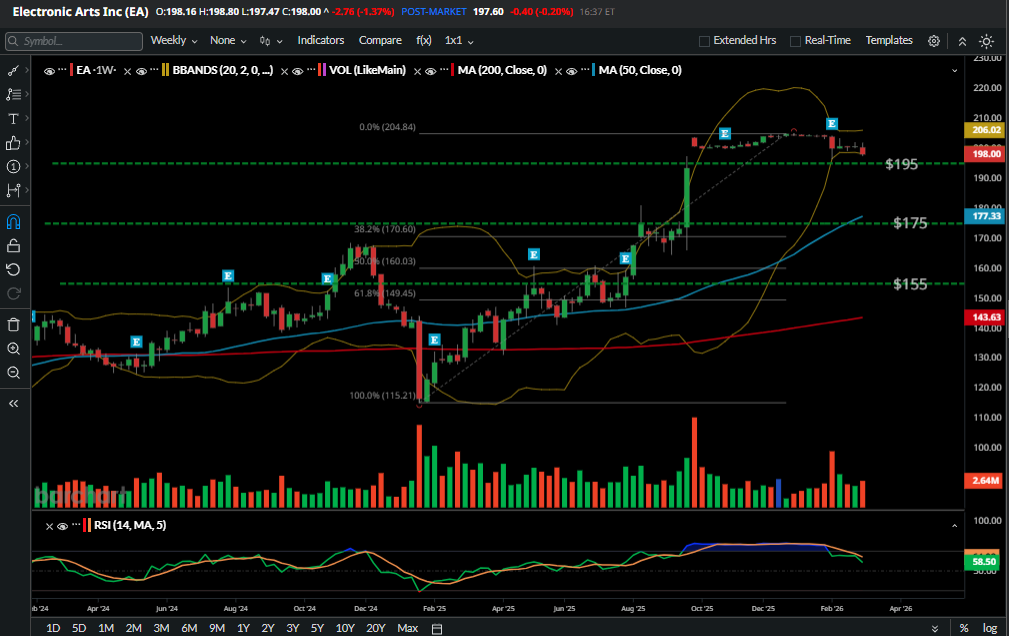
For more technical-oriented traders, there’s EA stock’s weekly price chart.
The weekly view of Electronic Arts shares shows a tired-looking Bollinger Band squeeze in conjunction with stochastics establishing a bearish crossover in overbought territory a short time ago.
Without considering any additional information on EA stock, the technical picture appears poised to resolve the squeeze with a bearish move to the downside.
The butterfly spread’s buyer or buyers may have one other ace up their sleeve too.
Despite EA’s definitive sounding agreement, there are still contingencies and critical fine print to make it through to the finish line.
Most pertinent is that Electronic Art’s leveraged buyout is made up of a consortium. This group includes Saudi Arabia’s Public Investment Fund (PIF).
With EA’s massive 700 million accounts and that user data a key selling point, lawmakers have been quick to warn of national security risks in front of an intense review from the Committee on Foreign Investment in the United States (CFIUS) that’s still waiting in the “wings.” So, how’s the risk-to-reward on a long butterfly look now?
A ‘Marvellous’ Technologies Bullish Put-Dominated Ratio Spread
A larger and likely institutional player appears to be extremely optimistic on Marvell stock.
To be fair, that party isn’t entirely alone.
Aside from the obvious well-received 18.35% share jump in MRVL following the semiconductor company’s earnings beat and strong outlook on Friday, options traders remained net bullish in the event’s immediate aftermath.
The Nasdaq-100 screener from earlier showed MRVL options topped more than 625,000 contracts and more than 700% above the 3-month average.
The heavy activity was enough to put the name into the second spot behind EA’s unusually active session.
Also, other Marvell stock investors continued to gravitate towards call contracts by a roughly two-to-one margin.
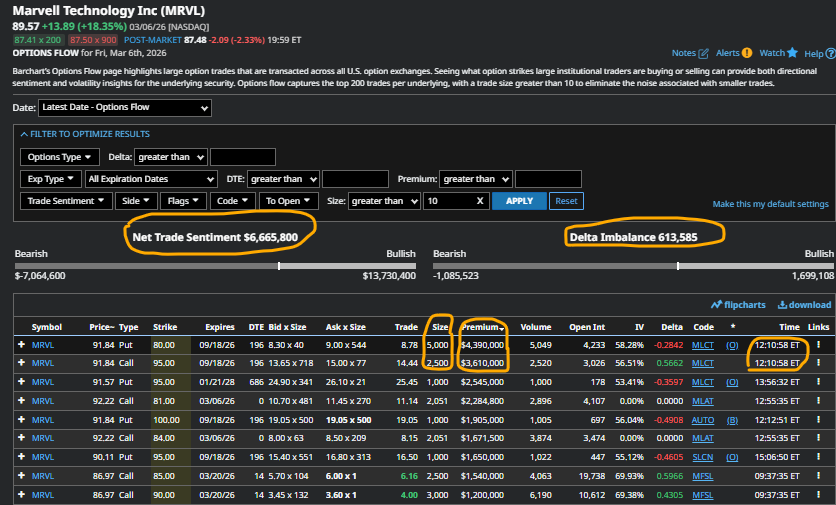
At the same time, positive “Net Trade Sentiment” and “Delta Imbalance” affirmed the bullish positioning.
But it was during the lunch hour that a bullish-looking spread trade was consummated which caught my eye as I dug into Barchart’s Options Flow data for MRVL.
It wasn’t the largest trade by contract size, though its 2,500 x 5,000 contracts is significant.
Where it was the top trade was its transactional value.
The September 80 put’s 5,000 contracts priced at $8.78 totaled $4,390,000.
At the same time, the September 95 call’s 2,500 contracts at $14.44 each, add up to $3,610,000.
If in fact the put options were sold and the calls purchased, the bullish put-dominated ratio spread results in a credit of $3.12.
The credit’s math is simple. Multiply the put premium by two ($8.78 x 2 = $17.56) as the sold contract count is twice the purchased call contracts. Then subtract the call’s debit from the larger debit ($17.56 - $14.44) to arrive at the net credit.
That credit is kept in its entirety at expiration if MRVL shares remain above $80.
Below a breakeven of $76.88, unmanaged losses could turn ugly in the blink of an eye with this trader short 5,000 puts, i.e., long 500,000 MRVL stock.
However, if the stock climbs above $95, that larger credit, which also maintains a nice downside cushion today of 14% (MRVL stock @ $89.57 – B/E $76.88 / $89.57) could begin to look insignificant.
Open-ended profits, should MRVL shares reclaim prices commensurate with 2025’s best days or better, would prove to be a truly massive payday given 2,500 long calls paid for by the short puts.
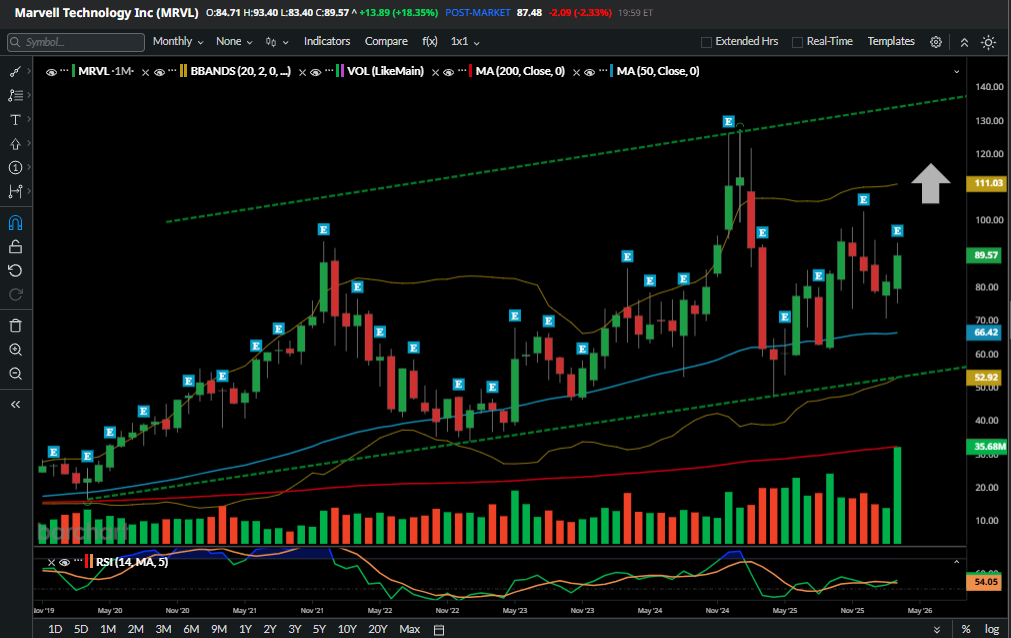
And with a monthly chart whose newly-minted bullish RSI crossover points at more good times ahead within Marvell’s extended up channel pattern, this could be a “Marvellous” put-dominated ratio spread indeed.
The Bottom Line
There’s a ton of options activity out there. But by taking advantage of Barchart’s scanning tools and a small bit of legwork, investors can gain powerful insights, be introduced to new position ideas that make sense and even follow the big money as a smarter money trader in your own account.
On the date of publication, Chris Tyler did not have (either directly or indirectly) positions in any of the securities mentioned in this article. All information and data in this article is solely for informational purposes. For more information please view the Barchart Disclosure Policy here.
More news from Barchart