What a time it’s been for Rush Street Interactive. In the past six months alone, the company’s stock price has increased by a massive 69.3%, reaching $28.39 per share. This was partly due to its solid quarterly results, and the performance may have investors wondering how to approach the situation.
Is now the time to buy Rush Street Interactive, or should you be careful about including it in your portfolio? Get the full breakdown from our expert analysts, it’s free.
Why Do We Think Rush Street Interactive Will Underperform?
Despite the momentum, we’re passing on Rush Street Interactive for now. Here are three reasons why RSI doesn’t excite us, plus one stock we’d rather own.
1. Long-Term Revenue Growth Disappoints
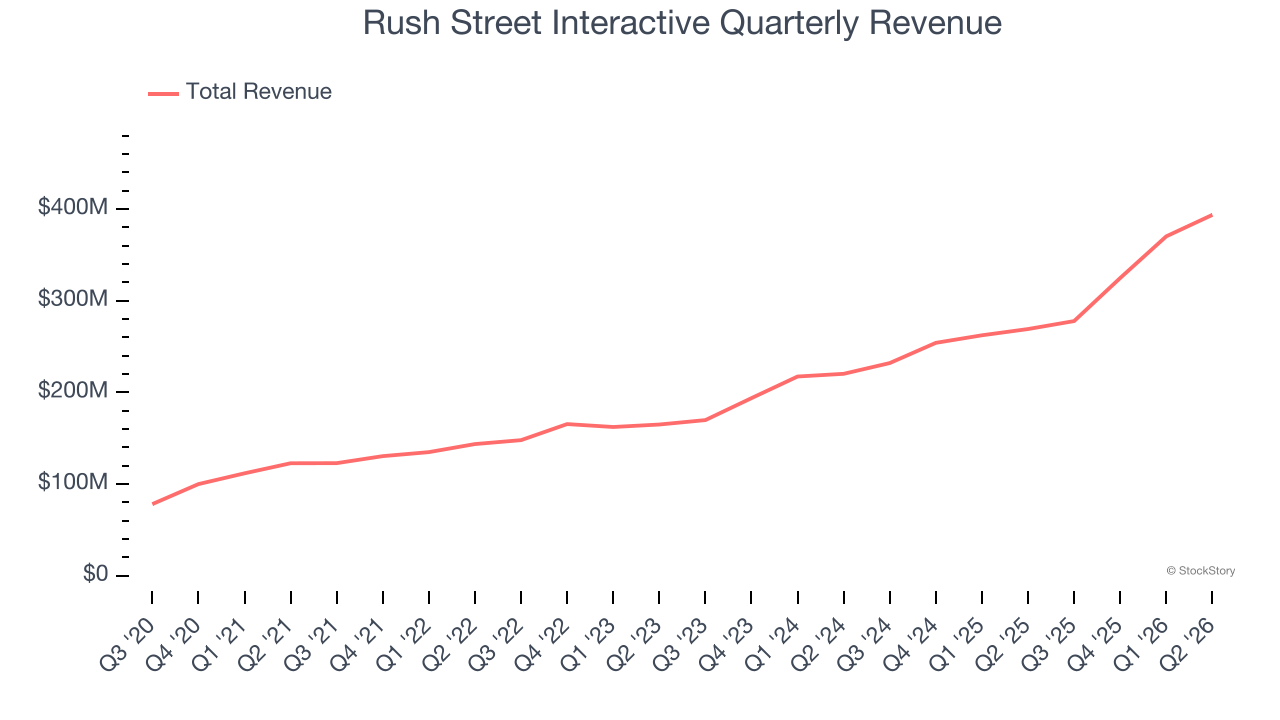
A company’s long-term performance is an indicator of its overall quality. Even a bad business can shine for one or two quarters, but a top-tier one grows for years. Over the last five years, Rush Street Interactive grew its sales at a 27.1% compounded annual growth rate. Although this growth is acceptable on an absolute basis, it fell slightly short of our standards for the consumer discretionary sector, which enjoys a number of secular tailwinds.
2. Weak Operating Margin Could Cause Trouble
Operating margin is a key measure of profitability. Think of it as net income - the bottom line - excluding the impact of taxes and interest on debt, which are less connected to business fundamentals.
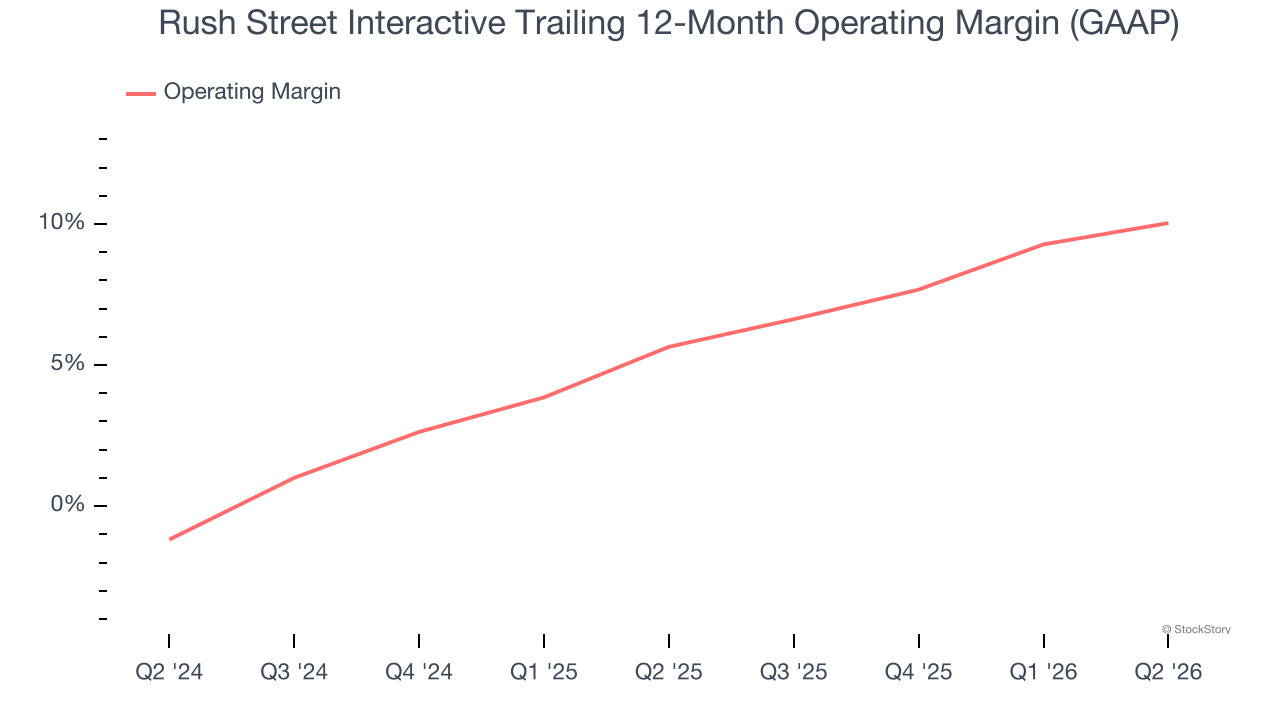
Rush Street Interactive’s operating margin has risen over the last 12 months and averaged 8.2% over the last two years. The company’s higher efficiency is a breath of fresh air, but its suboptimal cost structure means it still sports inadequate profitability for a consumer discretionary business.
3. Mediocre Free Cash Flow Margin Limits Reinvestment Potential
Free cash flow isn’t a prominently featured metric in company financials and earnings releases, but we think it’s telling because it accounts for all operating and capital expenses, making it tough to manipulate. Cash is king.
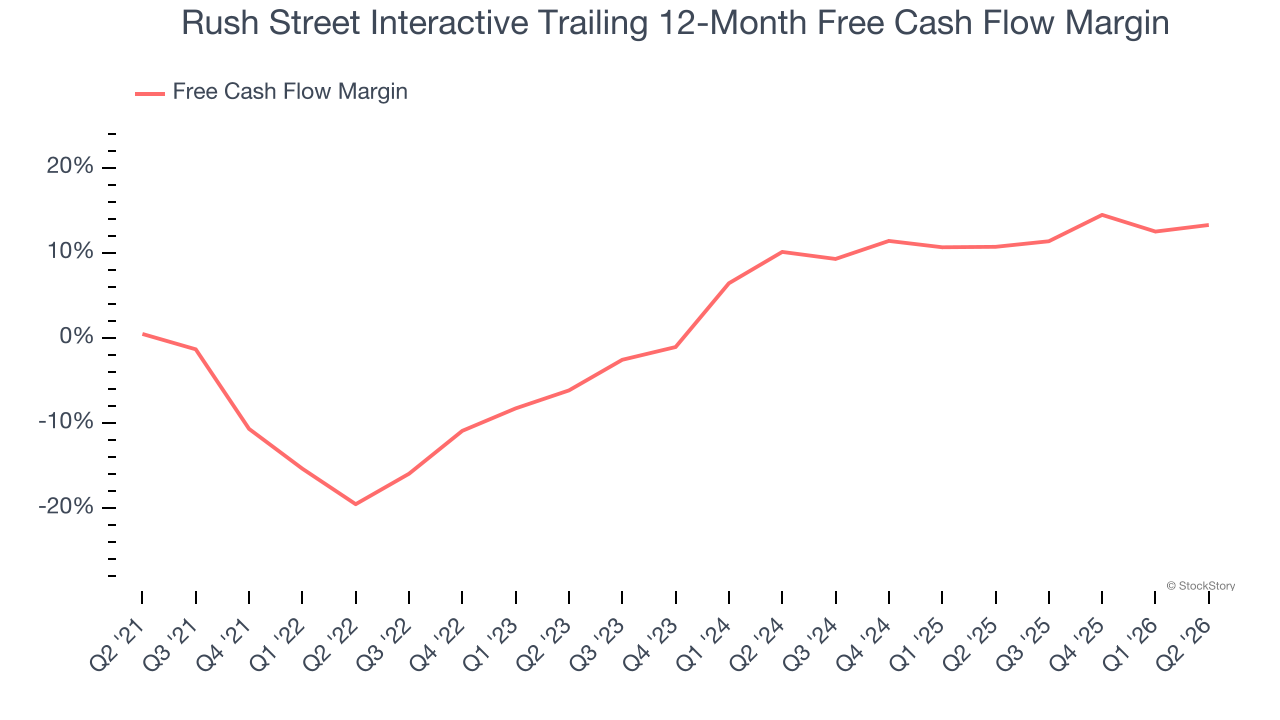
Rush Street Interactive has shown poor cash profitability relative to peers over the last two years, giving the company fewer opportunities to return capital to shareholders. Its free cash flow margin averaged 12.2%, below what we’d expect for a consumer discretionary business.
Final Judgment
Rush Street Interactive doesn’t pass our quality test. After the recent surge, the stock trades at 37.3× forward P/E (or $28.39 per share). This valuation multiple is fair, but we don’t have much confidence in the company. There are better stocks to buy right now. Let us point you toward a dominant aerospace business that has perfected its M&A strategy.
Stocks We Like More Than Rush Street Interactive
ONE MORE THING: Top 6 Stocks for This Week. This market is separating quality stocks from expensive ones fast. AI is taking down whole sectors with no warning. In a rotation this fast, you need more than a list of good companies.
Our AI system flagged Palantir before it ran 1,662% between October 2022 and February 2026. AppLovin before it ran 753% between February 2024 and February 2026. Nvidia before it ran 1,178% between January 2023 and February 2026. Each week it produces 6 new names that pass the same tests. Get Our Top 6 Stocks for Free HERE.
Stocks that have made our list include now familiar names such as Nvidia (+1,460% between June 2020 and June 2025) as well as under-the-radar businesses like the once-micro-cap company Kadant (+214% between June 2020 and June 2025). Find your next big winner with StockStory today.