Banking and retail technology provider Diebold Nixdorf (NYSE: DBD) met Wall Street’s revenue expectations in Q2 CY2026, with sales up 1.7% year on year to $930.8 million. The company’s outlook for the full year was close to analysts’ estimates with revenue guided to $3.9 billion at the midpoint. Its non-GAAP profit of $1.10 per share was in line with analysts’ consensus estimates.
Is now the time to buy Diebold Nixdorf? Find out by accessing our full research report, it’s free.
Diebold Nixdorf (DBD) Q2 CY2026 Highlights:
- Revenue: $930.8 million vs analyst estimates of $933.5 million (1.7% year-on-year growth, in line)
- Adjusted EPS: $1.10 vs analyst estimates of $1.10 (in line)
- Adjusted EBITDA: $120.6 million vs analyst estimates of $114.3 million (13% margin, 5.5% beat)
- The company reconfirmed its revenue guidance for the full year of $3.9 billion at the midpoint
- Management reiterated its full-year Adjusted EPS guidance of $5.50 at the midpoint
- EBITDA guidance for the full year is $522.5 million at the midpoint, in line with analyst expectations
- Operating Margin: 6.2%, in line with the same quarter last year
- Free Cash Flow was -$28.9 million, down from $12.6 million in the same quarter last year
- Market Capitalization: $3.14 billion
Company Overview
With roots dating back to 1859 and a presence in over 100 countries, Diebold Nixdorf (NYSE: DBD) provides automated self-service technology, software, and services that help banks and retailers digitize their customer transactions.
Revenue Growth
A company’s long-term sales performance can indicate its overall quality. Even a bad business can shine for one or two quarters, but a top-tier one grows for years.
With $3.87 billion in revenue over the past 12 months, Diebold Nixdorf is one of the larger companies in the business services industry and benefits from a well-known brand that influences purchasing decisions. However, its scale is a double-edged sword because it’s harder to find incremental growth when you’ve penetrated most of the market. For Diebold Nixdorf to boost its sales, it likely needs to adjust its prices, launch new offerings, or lean into foreign markets.
As you can see below, Diebold Nixdorf struggled to increase demand as its $3.87 billion of sales for the trailing 12 months was close to its revenue five years ago. This shows demand was soft, a poor baseline for our analysis.
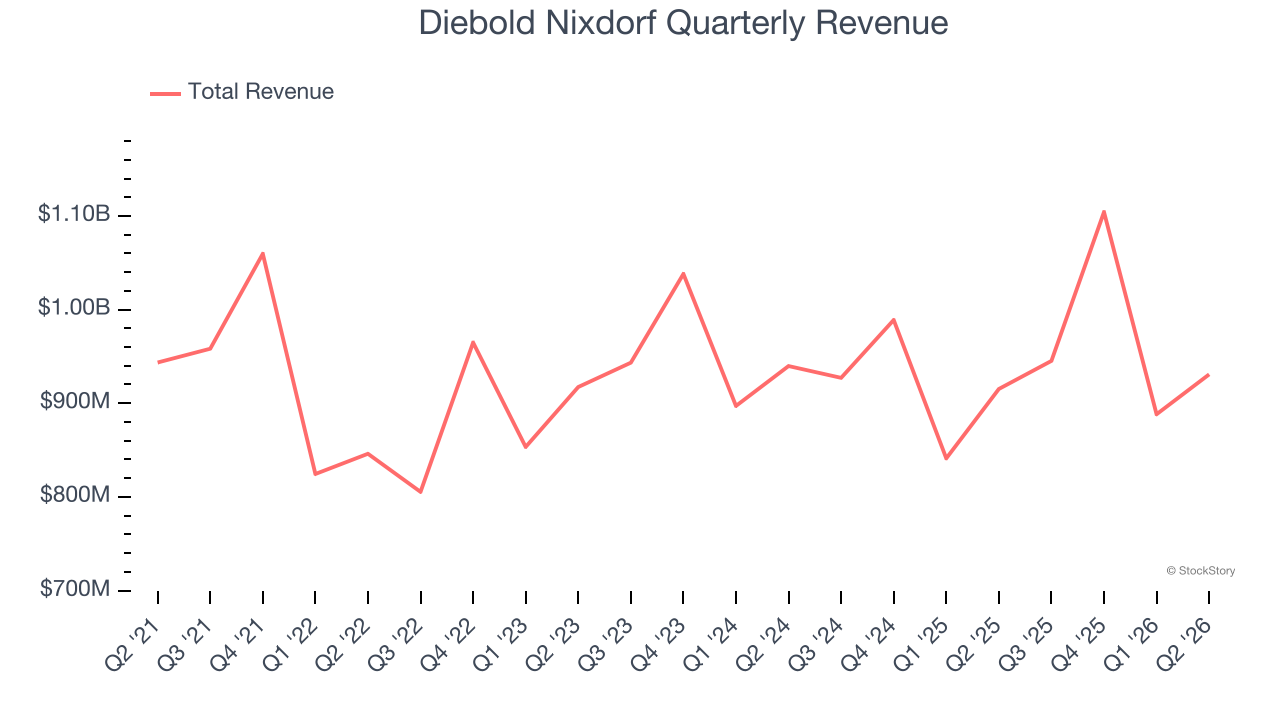
We at StockStory place the most emphasis on long-term growth, but within business services, a half-decade historical view may miss recent innovations or disruptive industry trends. Just like its five-year trend, Diebold Nixdorf’s revenue over the last two years was flat, suggesting it is in a slump. 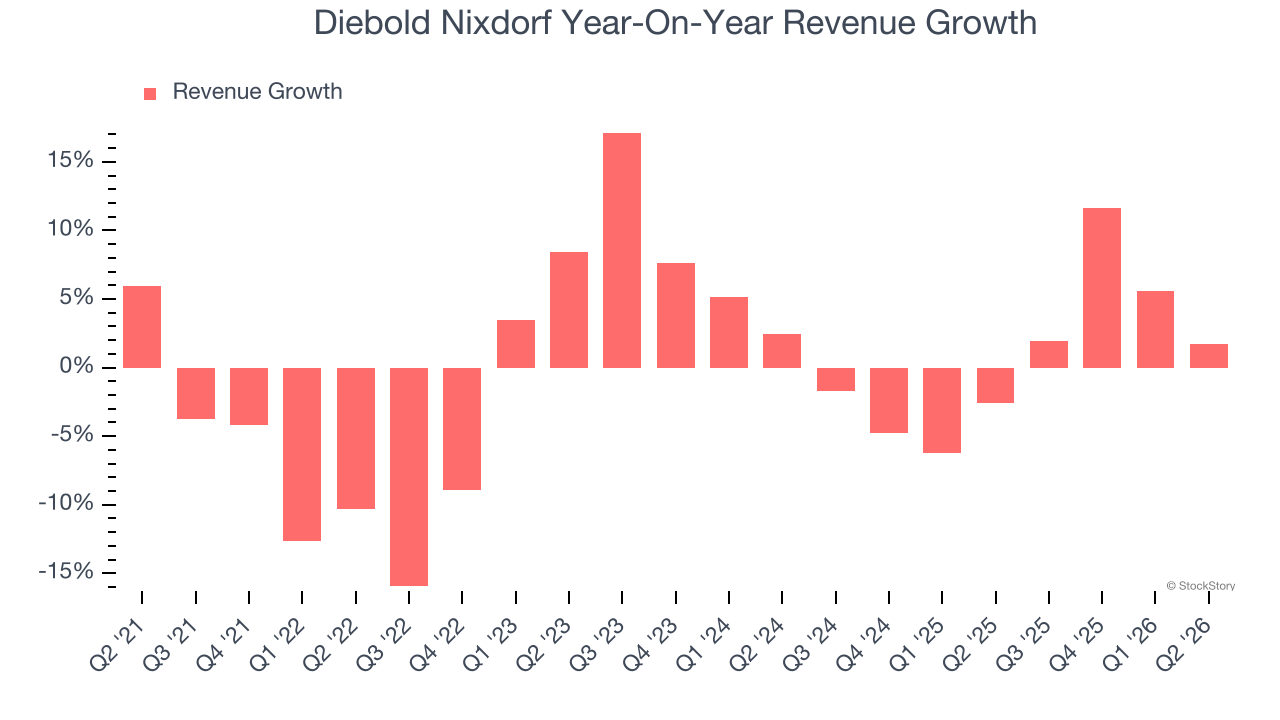
This quarter, Diebold Nixdorf grew its revenue by 1.7% year on year, and its $930.8 million of revenue was in line with Wall Street’s estimates.
Looking ahead, sell-side analysts expect revenue to grow 2.2% over the next 12 months. While this projection suggests its newer products and services will catalyze better top-line performance, it is still below the sector average.
ONE MORE THING: 3 Hidden Platforms Growing 3X Faster than Amazon, Google, and PayPal. Amazon, Google, and Meta all followed the same playbook: Dominate an ignored market. Build an unbeatable moat. Scale until you’re unstoppable.
These three platforms are running that exact playbook right now. The early investors in Amazon made fortunes. The early investors in these could do the same. Get All 3 Stocks Here for FREE.
Adjusted Operating Margin
Diebold Nixdorf was profitable over the last five years but held back by its large cost base. Its average adjusted operating margin of 7.8% was weak for a business services business.
On the plus side, Diebold Nixdorf’s adjusted operating margin rose by 2.2 percentage points over the last five years.
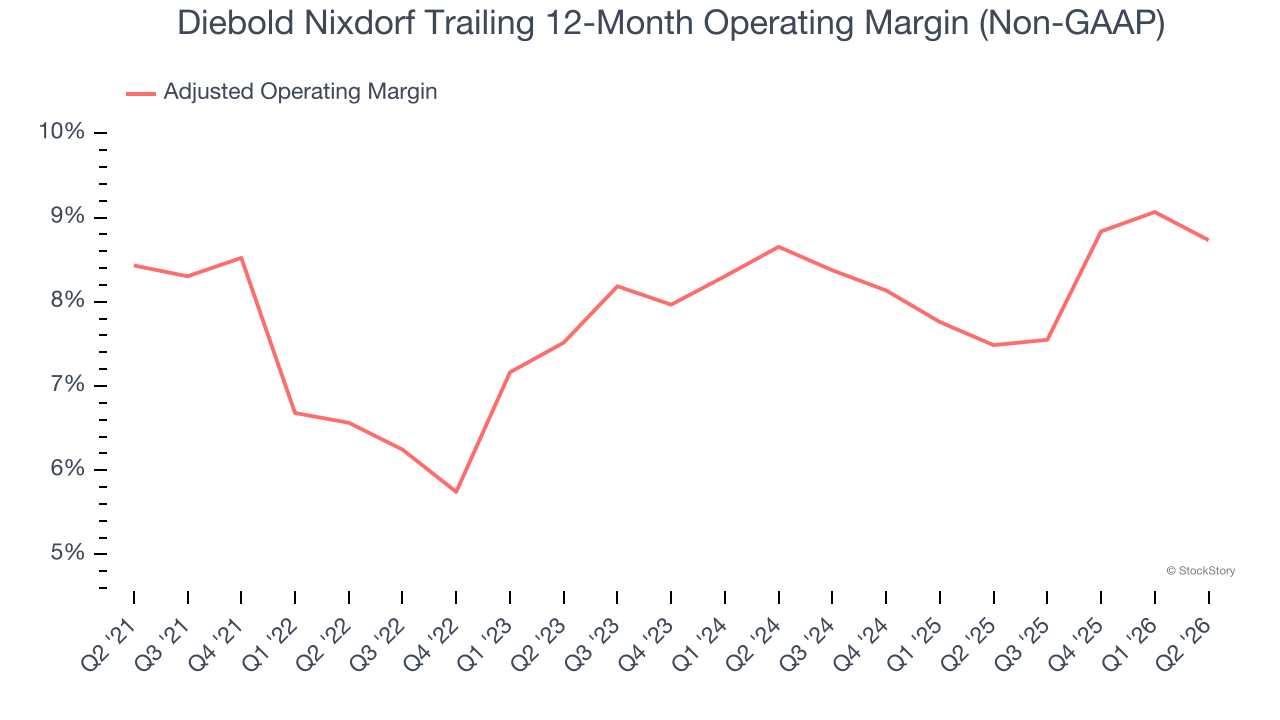
In Q2, Diebold Nixdorf generated an adjusted operating margin profit margin of 6.6%, down 1.4 percentage points year on year. This reduction is quite minuscule and indicates the company’s overall cost structure has been relatively stable.
Cash Is King
If you’ve followed StockStory for a while, you know we emphasize free cash flow. Why, you ask? We believe that in the end, cash is king, and you can’t use accounting profits to pay the bills.
Diebold Nixdorf broke even from a free cash flow perspective over the last five years, giving the company limited opportunities to return capital to shareholders.
Taking a step back, an encouraging sign is that Diebold Nixdorf’s margin expanded by 7.5 percentage points during that time. The company’s improvement shows it’s heading in the right direction, and we can see it became a less capital-intensive business because its free cash flow profitability rose more than its operating profitability.
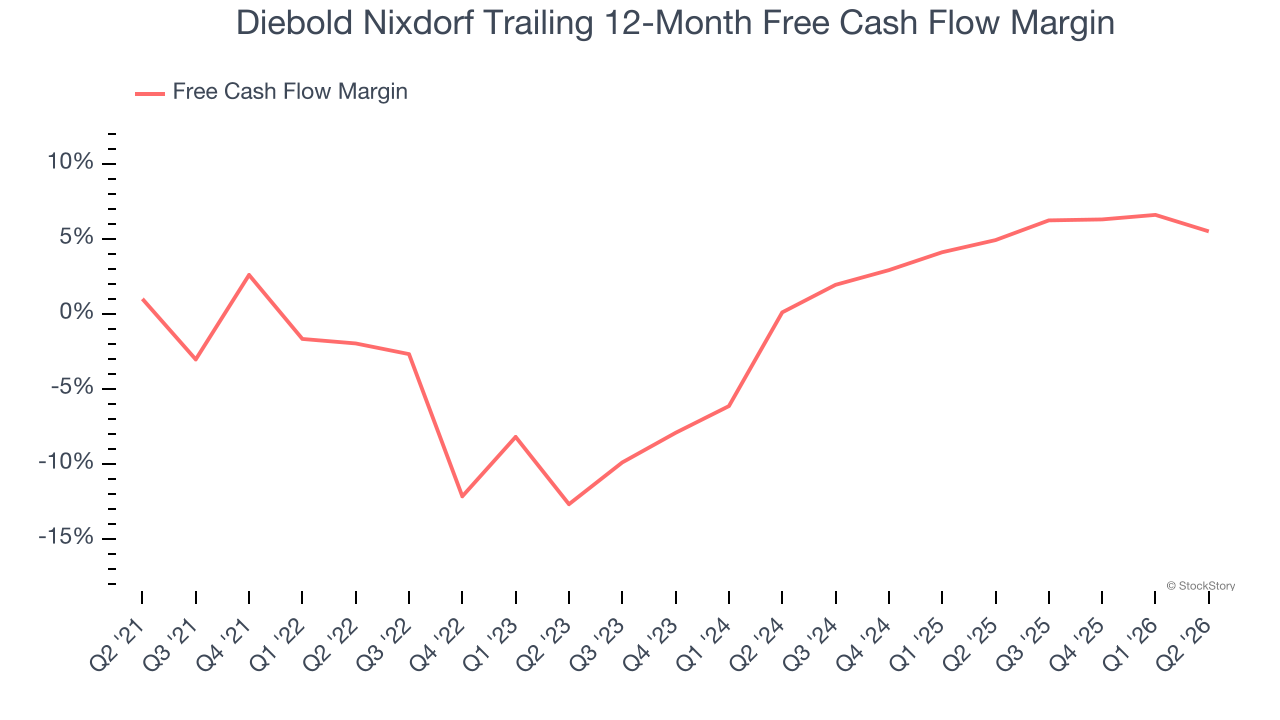
Diebold Nixdorf burned through $28.9 million of cash in Q2, equivalent to a negative 3.1% margin. The company’s cash flow turned negative after being positive in the same quarter last year, prompting us to pay closer attention. Short-term fluctuations typically aren’t a big deal because investment needs can be seasonal, but we’ll be watching to see if the trend extrapolates into future quarters.
Key Takeaways from Diebold Nixdorf’s Q2 Results
We struggled to find many positives in these results. Its revenue was in line and its full-year revenue guidance was in line with Wall Street’s estimates. Overall, this quarter could have been better. The stock remained flat at $90.75 immediately after reporting.
So should you invest in Diebold Nixdorf right now? If you’re making that decision, you should consider the bigger picture of valuation, business qualities, as well as the latest earnings. We cover that in our actionable full research report which you can read here (it’s free).