
Regional banking company Regions Financial (NYSE: RF) fell short of the market’s revenue expectations in Q2 CY2026, with sales flat year on year at $1.91 billion. Its non-GAAP profit of $0.68 per share was 7.9% above analysts’ consensus estimates.
Is now the time to buy Regions Financial? Find out by accessing our full research report, it’s free.
Regions Financial (RF) Q2 CY2026 Highlights:
- Net Interest Income: $1.28 billion vs analyst estimates of $1.28 billion (1.4% year-on-year growth, in line)
- Net Interest Margin: 3.7% vs analyst estimates of 3.7% (in line)
- Revenue: $1.91 billion vs analyst estimates of $1.95 billion (flat year on year, 2% miss)
- Efficiency Ratio: 58.3% vs analyst estimates of 57% (125.3 basis point miss)
- Adjusted EPS: $0.68 vs analyst estimates of $0.63 (7.9% beat)
- Tangible Book Value per Share: $13.78 vs analyst estimates of $13.82 (7.9% year-on-year growth, in line)
- Market Capitalization: $27.65 billion
Company Overview
Tracing its roots back to 1971 and operating in a region known as the "heart of Dixie," Regions Financial (NYSE: RF) is a financial holding company that provides banking services, wealth management, and specialty financial solutions across the South, Midwest, and Texas.
Sales Growth
In general, banks make money from two primary sources. The first is net interest income, which is interest earned on loans, mortgages, and investments in securities minus interest paid out on deposits. The second source is non-interest income, which can come from bank account, credit card, wealth management, investment banking, and trading fees. Unfortunately, Regions Financial’s 3.5% annualized revenue growth over the last five years was sluggish. This fell short of our benchmark for the banking sector and is a poor baseline for our analysis.
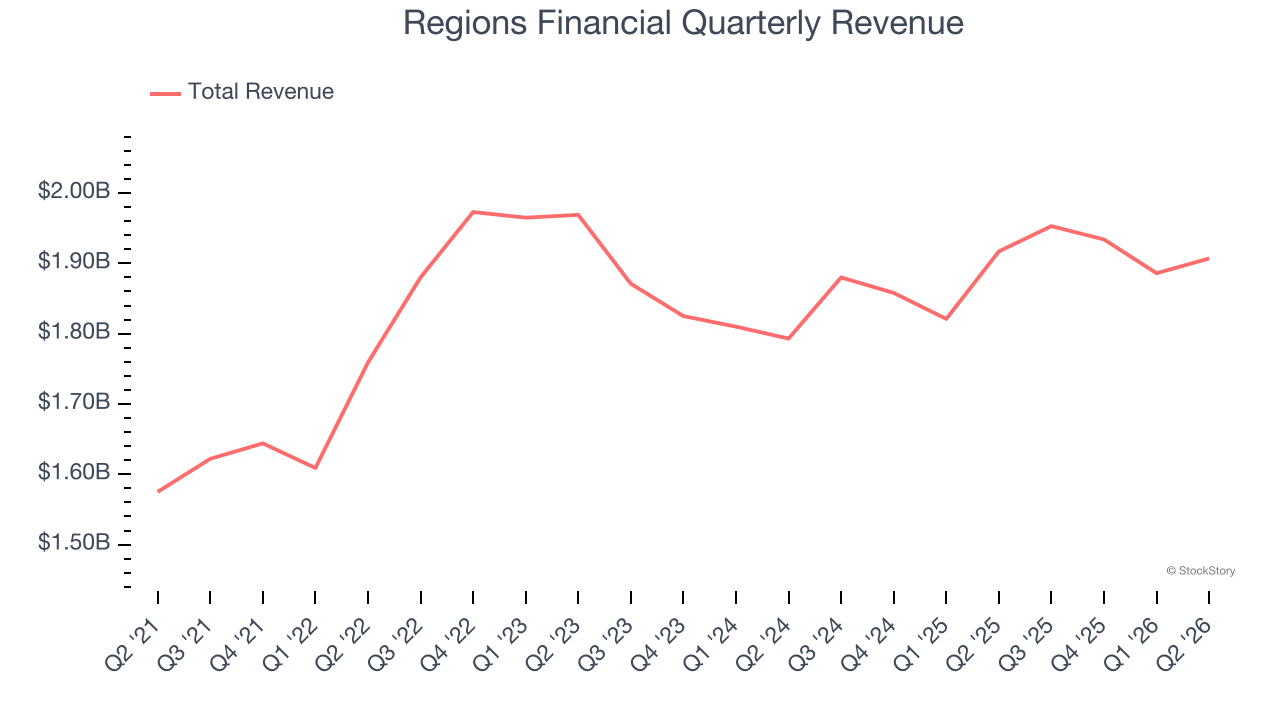
Long-term growth is the most important, but within financials, a half-decade historical view may miss recent interest rate changes and market returns. Regions Financial’s annualized revenue growth of 2.6% over the last two years aligns with its five-year trend, suggesting its demand was consistently weak. 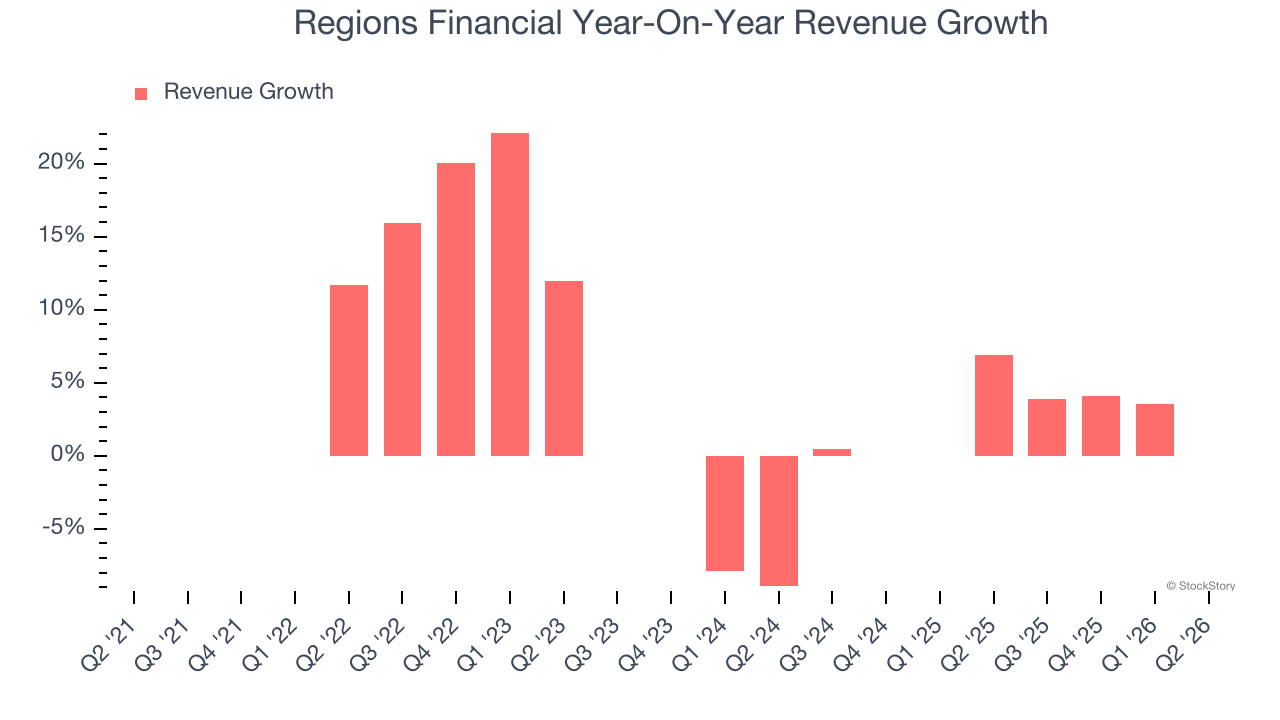 Note: Quarters not shown were determined to be outliers because they were impacted by outsized investment gains/losses that are not indicative of the recurring fundamentals of the business.
This quarter, Regions Financial missed Wall Street’s estimates and reported a rather uninspiring 0.5% year-on-year revenue decline, generating $1.91 billion of revenue.
Net interest income made up 66.1% of the company’s total revenue during the last five years, meaning lending operations are Regions Financial’s largest source of revenue.
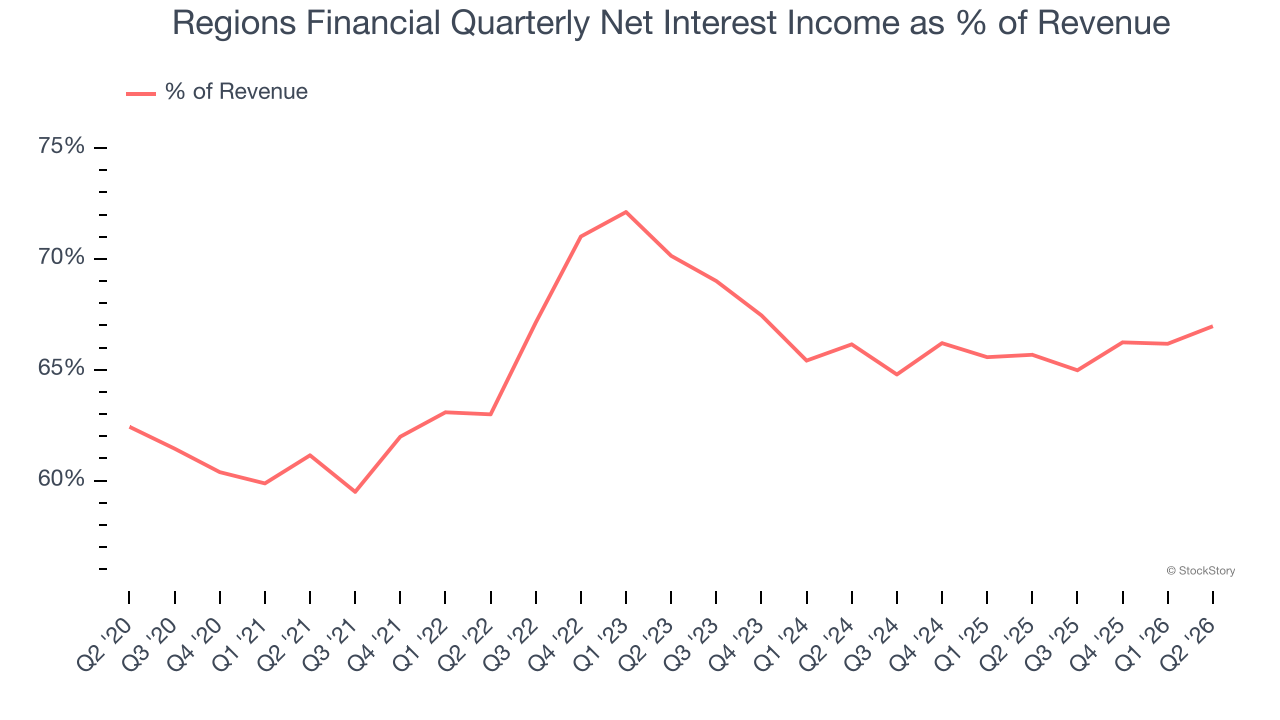
Markets consistently prioritize net interest income growth over fee-based revenue, recognizing its superior quality and recurring nature compared to the more unpredictable non-interest income streams.
ONE MORE THING: 3 Hidden Platforms Growing 3X Faster than Amazon, Google, and PayPal. Amazon, Google, and Meta all followed the same playbook: Dominate an ignored market. Build an unbeatable moat. Scale until you’re unstoppable.
These three platforms are running that exact playbook right now. The early investors in Amazon made fortunes. The early investors in these could do the same. Get All 3 Stocks Here for FREE.
Tangible Book Value Per Share (TBVPS)
Banks profit by intermediating between depositors and borrowers, making them fundamentally balance sheet-driven enterprises. Market participants emphasize balance sheet quality and sustained book value growth when evaluating these institutions.
Because of this, tangible book value per share (TBVPS) emerges as the critical performance benchmark. By excluding intangible assets with uncertain liquidation values, this metric captures real, liquid net worth per share. EPS can become murky due to acquisition impacts or accounting flexibility around loan provisions, and TBVPS resists financial engineering manipulation.
Regions Financial’s TBVPS grew at a tepid 3.1% annual clip over the last five years. However, TBVPS growth has accelerated recently, growing by 14.7% annually over the last two years from $10.48 to $13.78 per share.
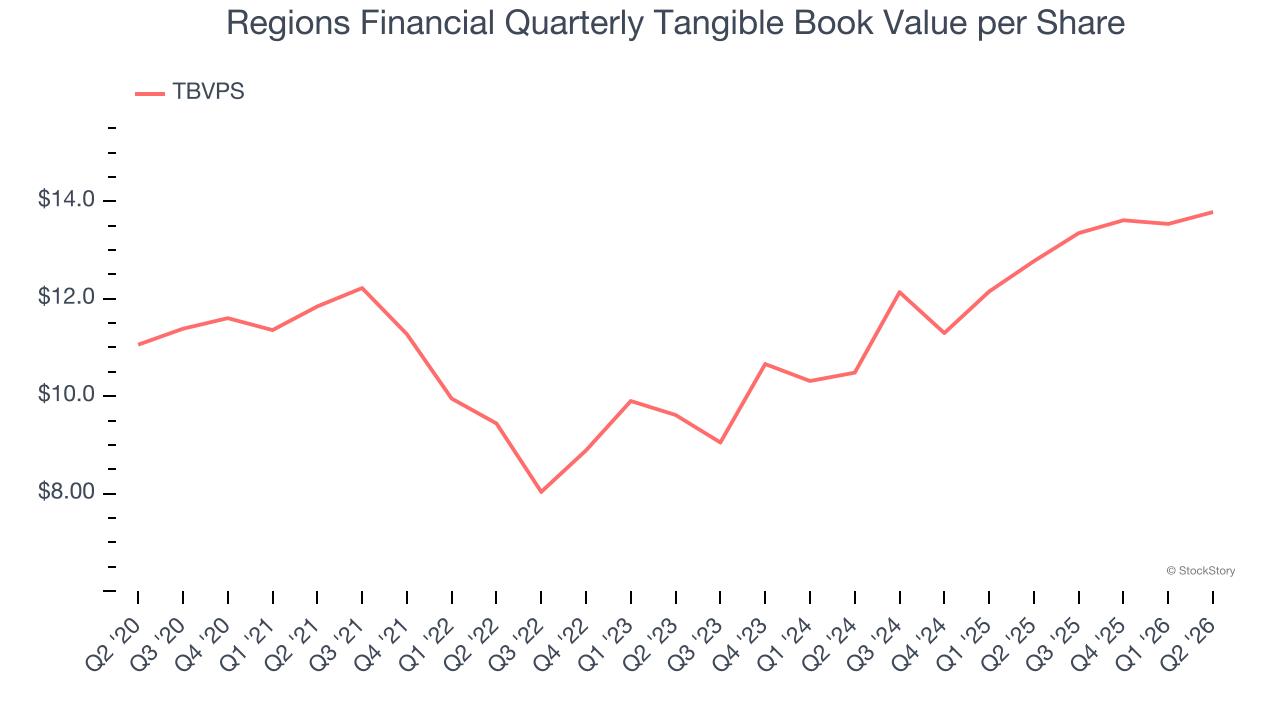
Over the next 12 months, Consensus estimates call for Regions Financial’s TBVPS to grow by 11% to $15.30, mediocre growth rate.
Key Takeaways from Regions Financial’s Q2 Results
It was good to see Regions Financial beat analysts’ EPS expectations this quarter. On the other hand, its revenue missed. Overall, this was a weaker quarter. The stock remained flat at $32.27 immediately after reporting.
The latest quarter from Regions Financial’s wasn’t that good. One earnings report doesn’t define a company’s quality, though, so let’s explore whether the stock is a buy at the current price. When making that decision, it’s important to consider its valuation, business qualities, as well as what has happened in the latest quarter. We cover that in our actionable full research report which you can read here (it’s free).