

Financial services giant PNC (NYSE: PNC) fell short of the market’s revenue expectations in Q1 CY2026, but sales rose 12.5% year on year to $6.17 billion. Its non-GAAP profit of $4.32 per share was 3.8% above analysts’ consensus estimates.
Is now the time to buy PNC Financial Services Group? Find out by accessing our full research report, it’s free.
PNC Financial Services Group (PNC) Q1 CY2026 Highlights:
- Net Interest Income: $3.96 billion vs analyst estimates of $3.97 billion (14% year-on-year growth, in line)
- Net Interest Margin: 3% vs analyst estimates of 3% (in line)
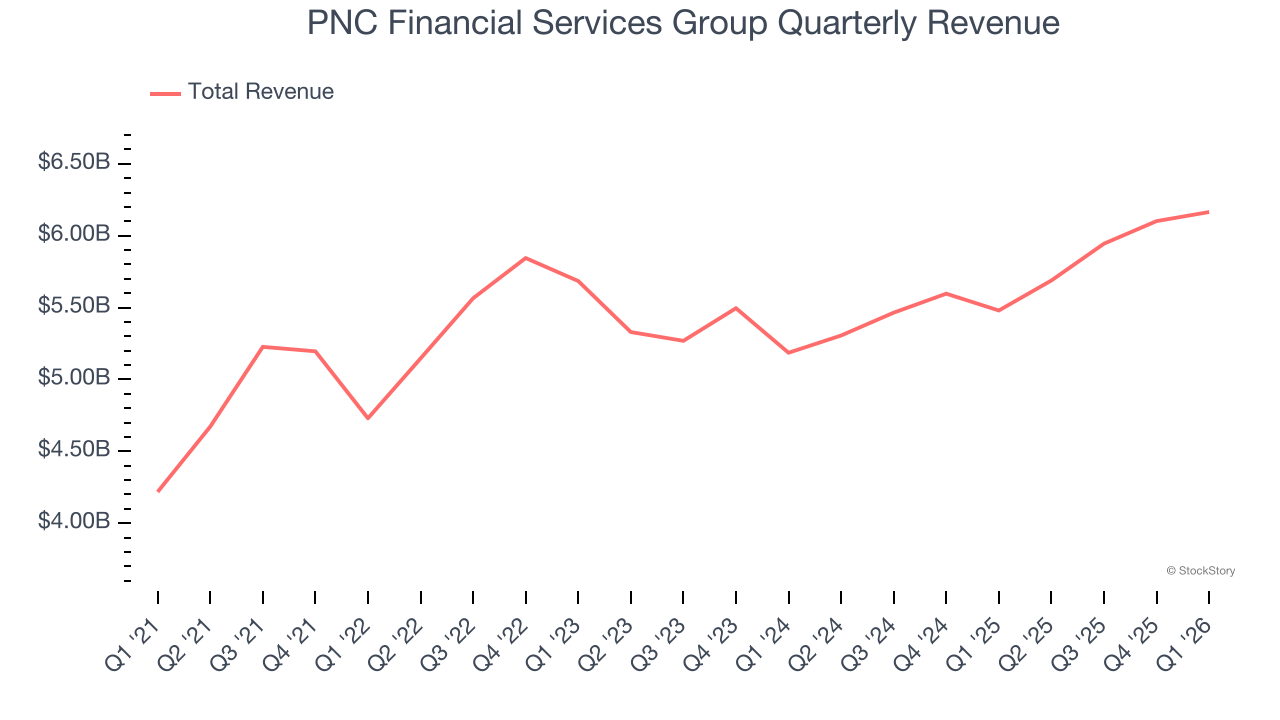
- Revenue: $6.17 billion vs analyst estimates of $6.26 billion (12.5% year-on-year growth, 1.6% miss)
- Efficiency Ratio: 61% vs analyst estimates of 60.8% (22.7 basis point miss)
- Adjusted EPS: $4.32 vs analyst estimates of $4.16 (3.8% beat)
- Tangible Book Value per Share: $109.42 vs analyst estimates of $110.01 (9% year-on-year growth, 0.5% miss)
- Market Capitalization: $89.23 billion
Company Overview
Tracing its roots back to 1852 when Pittsburgh's industrial boom demanded stronger financial institutions, PNC (NYSE: PNC) is a diversified financial institution that provides retail banking, corporate banking, and asset management services through a coast-to-coast branch network.
Sales Growth
In general, banks make money from two primary sources. The first is net interest income, which is interest earned on loans, mortgages, and investments in securities minus interest paid out on deposits. The second source is non-interest income, which can come from bank account, credit card, wealth management, investing banking, and trading fees. Over the last five years, PNC Financial Services Group grew its revenue at a tepid 7% compounded annual growth rate. This was below our standard for the banking sector and is a tough starting point for our analysis.
We at StockStory place the most emphasis on long-term growth, but within financials, a half-decade historical view may miss recent interest rate changes, market returns, and industry trends. PNC Financial Services Group’s recent performance shows its demand has slowed as its annualized revenue growth of 6% over the last two years was below its five-year trend. We’re wary when companies in the sector see decelerations in revenue growth, as it could signal changing consumer tastes aided by low switching costs. 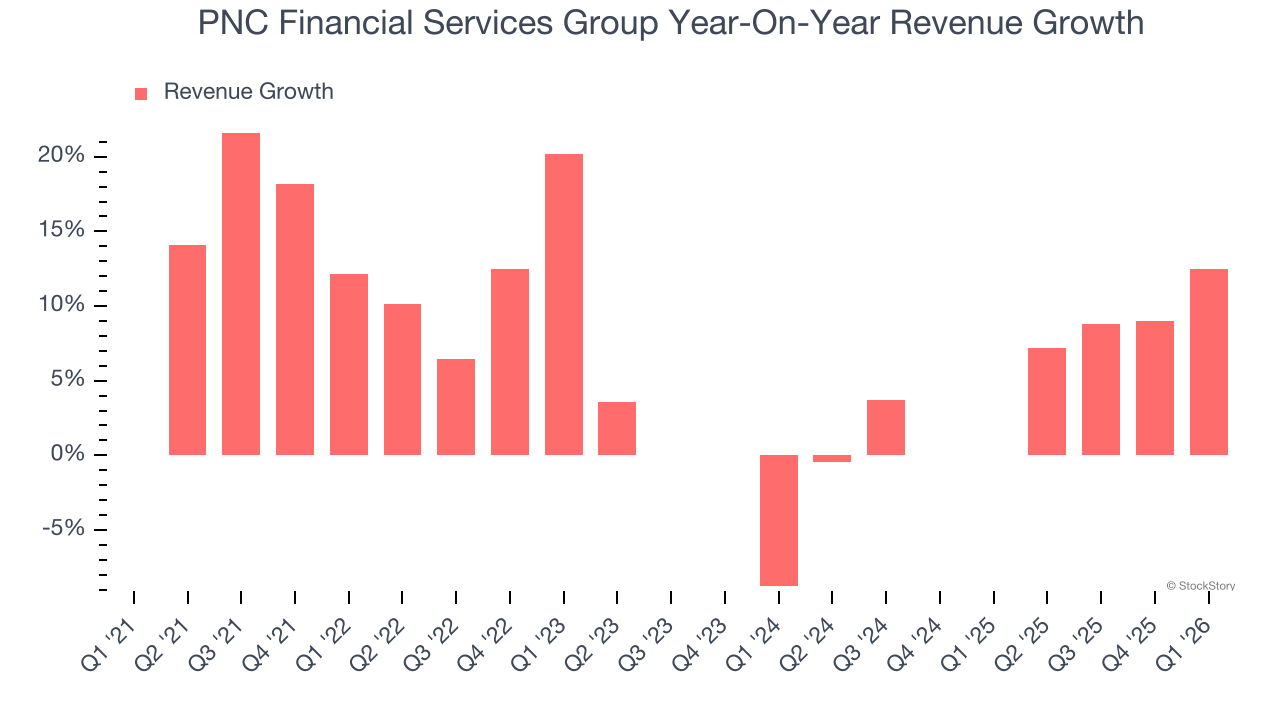 Note: Quarters not shown were determined to be outliers, impacted by outsized investment gains/losses that are not indicative of the recurring fundamentals of the business.
This quarter, PNC Financial Services Group’s revenue grew by 12.5% year on year to $6.17 billion but fell short of Wall Street’s estimates.
Net interest income made up 61.4% of the company’s total revenue during the last five years, meaning lending operations are PNC Financial Services Group’s largest source of revenue.
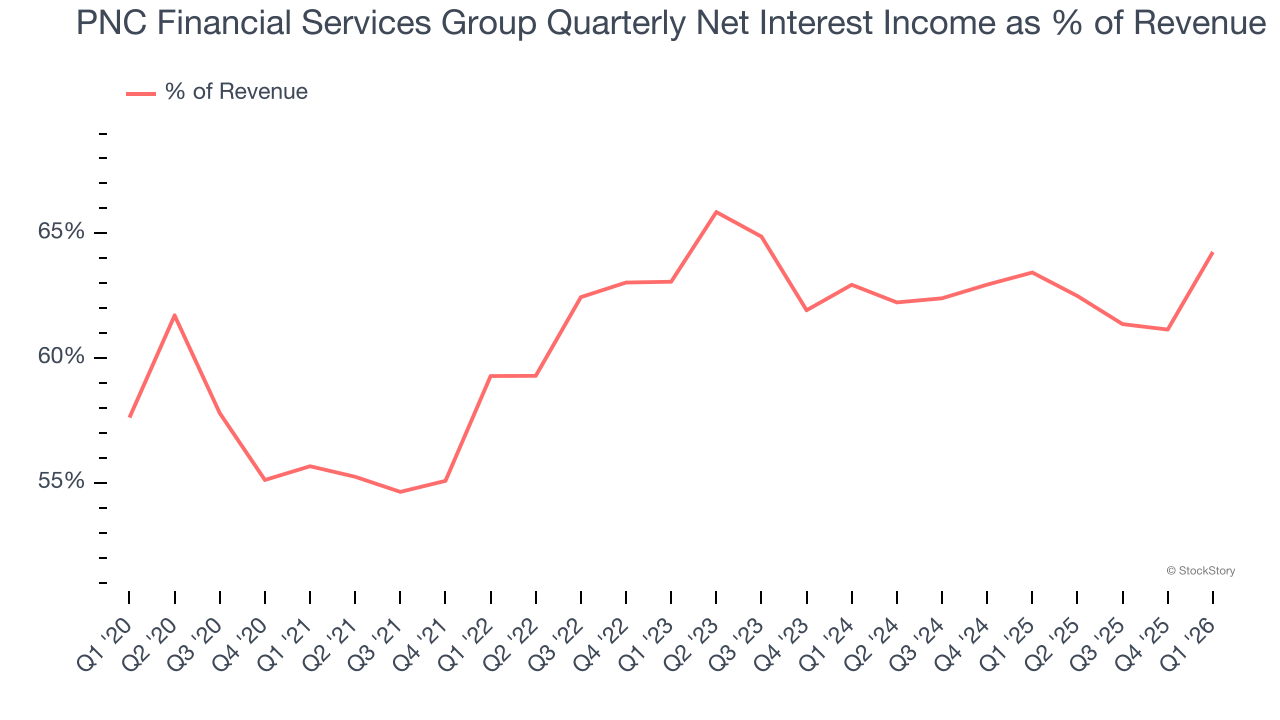
While banks generate revenue from multiple sources, investors view net interest income as the cornerstone - its predictable, recurring characteristics stand in sharp contrast to the volatility of non-interest income.
ONE MORE THING: 3 Hidden Platforms Growing 3X Faster than Amazon, Google, and PayPal. Amazon, Google, and Meta all followed the same playbook: Dominate an ignored market. Build an unbeatable moat. Scale until you’re unstoppable.
These three platforms are running that exact playbook right now. The early investors in Amazon made fortunes. The early investors in these could do the same. Get All 3 Stocks Here for FREE.
Tangible Book Value Per Share (TBVPS)
Banks are balance sheet-driven businesses because they generate earnings primarily through borrowing and lending. They’re also valued based on their balance sheet strength and ability to compound book value (another name for shareholders’ equity) over time.
When analyzing banks, tangible book value per share (TBVPS) takes precedence over many other metrics. This measure isolates genuine per-share value by removing intangible assets of debatable liquidation worth. EPS can become murky due to acquisition impacts or accounting flexibility around loan provisions, and TBVPS resists financial engineering manipulation.
PNC Financial Services Group’s TBVPS grew at a sluggish 2.5% annual clip over the last five years. However, TBVPS growth has accelerated recently, growing by 12.9% annually over the last two years from $85.83 to $109.42 per share.
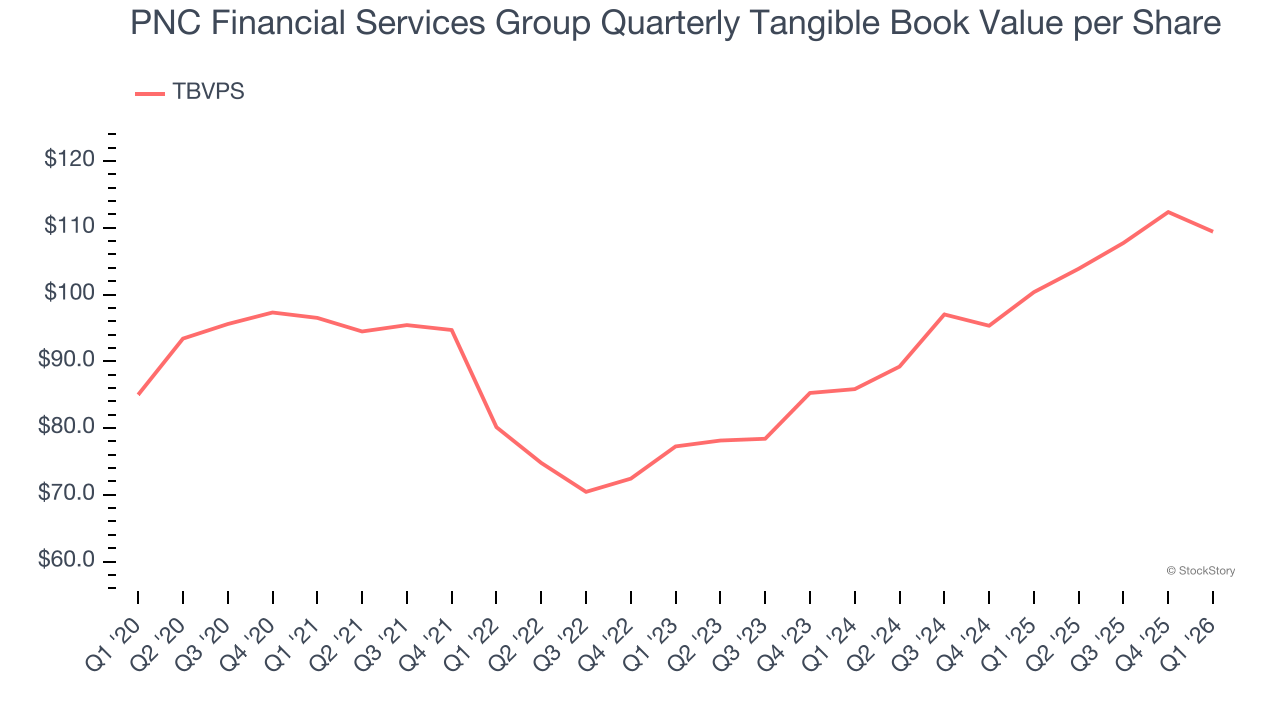
Over the next 12 months, Consensus estimates call for PNC Financial Services Group’s TBVPS to grow by 6.8% to $116.81, lousy growth rate.
Key Takeaways from PNC Financial Services Group’s Q1 Results
PNC's revenue missed but its EPS slightly exceeded Wall Street’s estimates. Furthermore, net interest margin and tangible book value per share were both roughly in line with expectations. Overall, this was a mixed quarter. The stock remained flat at $221.95 immediately after reporting.
Is PNC Financial Services Group an attractive investment opportunity at the current price? If you’re making that decision, you should consider the bigger picture of valuation, business qualities, as well as the latest earnings. We cover that in our actionable full research report which you can read here (it’s free).