Non-operated oil producer Northern Oil and Gas (NYSE: NOG) fell short of the market’s revenue expectations in Q3 2026, with revenue falling 36.1% year on year to $345.9 million. Its non-GAAP profit of $1.32 per share was 24.5% above analysts’ consensus estimates.
For more on Northern Oil and Gas, read our free full research report.
Northern Oil and Gas (NOG) Q3 2026 highlights:
- Revenue $345.9 million vs S&P analysts’ consensus estimates of $600.5 million (36.1% year-on-year decline, 42.4% miss)
- Adjusted EPS $1.32 vs S&P analysts’ consensus estimates of $1.06 (24.5% beat)
- Adjusted EBITDA $444.5 million vs analysts’ consensus estimates of $407.2 million (128% margin, 9.1% beat)
- Operating margin -22.2%, up from -23.2% in the same quarter last year
- Free cash flow margin 42.9%, up from 16.7% in the same quarter last year
- Oil production up 3.4% year on year
- Market capitalization $2.36 billion
“The third quarter was a record for NOG, and the drivers matter as much as the results. We set new highs for total production, natural gas volumes and Adjusted EBITDA, and generated nearly $150 million of Free Cash Flow even as activity increased across our oil-weighted basins. Our assets are self-funding their own growth and still generating substantial excess cash, and we’re putting that cash to work. We cut total debt by more than $100 million, brought leverage below 1.5 times a quarter ahead of our year-end goal, and continued buying back our own shares,” stated Nick O’Grady, Chief Executive Officer.
Revenue growth
Cyclical industries such as energy can make mediocre companies look successful for a time, but a long-term view reveals which businesses can actually withstand and adapt to changing conditions. Over the last five years, Northern Oil and Gas grew its revenue at a strong 25% compounded annual growth rate. Its growth beat the average energy upstream and integrated energy company and shows its offerings resonate with customers.
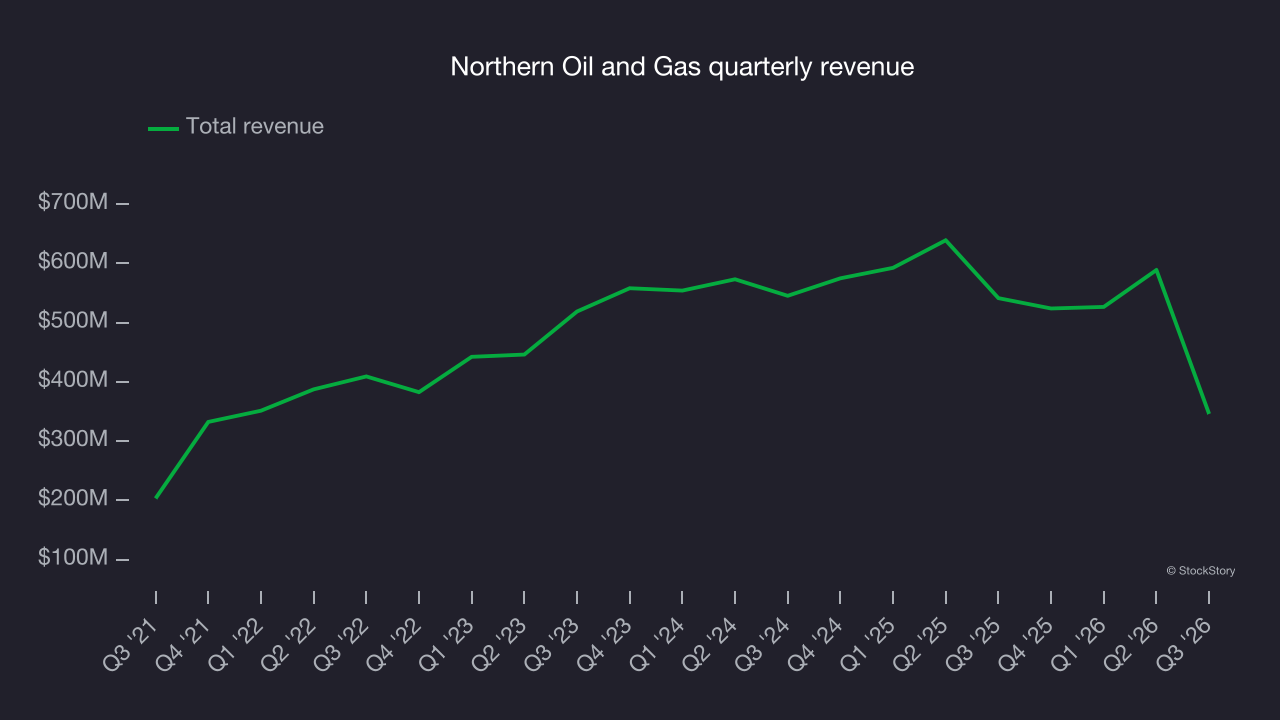
Even a long stretch in energy can be shaped by a single commodity cycle, so extending the view to ten years adds another perspective and reveals which companies are built to grow regardless of the pricing regime. Northern Oil and Gas’s annualized revenue growth of 30.7% over the last ten years is above its five-year trend.
Revenue provides useful context, but it is heavily influenced by commodity prices and acquisitions. Production volumes, by contrast, reveal whether the underlying asset base is actually growing. Over the last two years, Northern Oil and Gas’s oil production averaged 2.3% year-on-year growth while its natural gas production averaged 22.7% year-on-year growth. 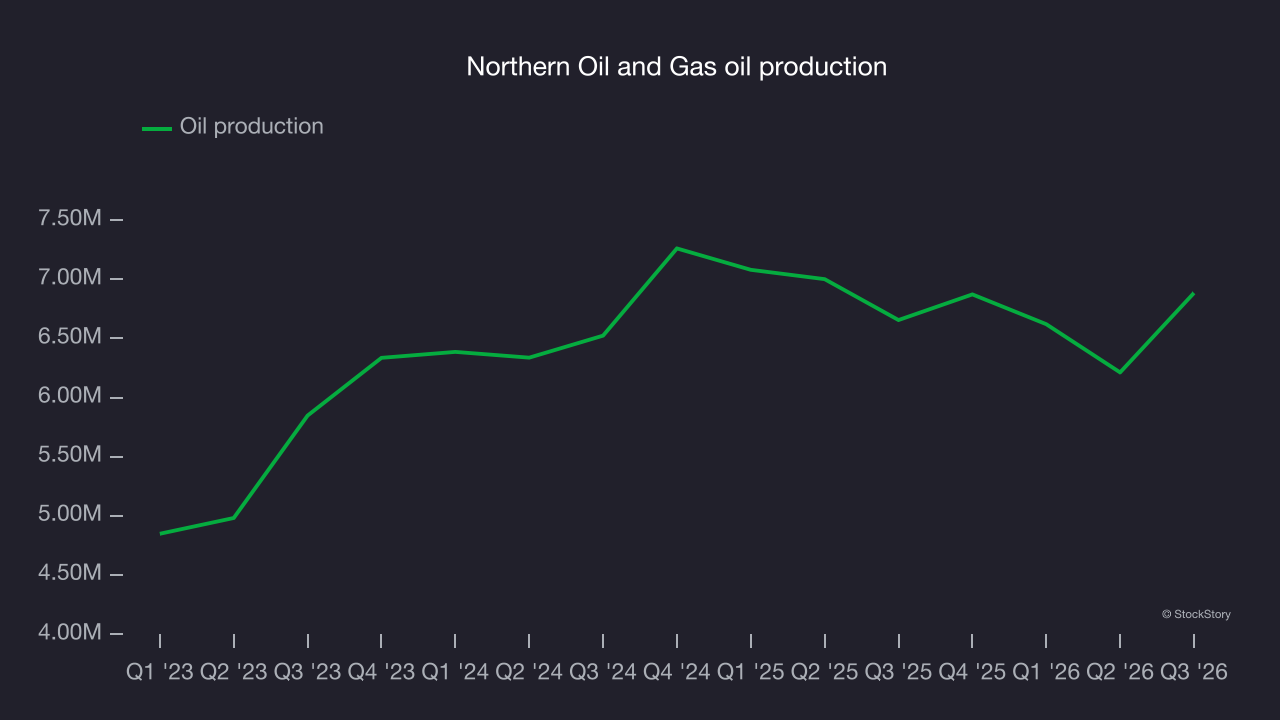
This quarter, Northern Oil and Gas missed Wall Street’s consensus estimates and reported an uninspiring 36.1% year-on-year revenue decline, generating $345.9 million of revenue. It also reported modest year-on-year oil production growth of 3.4%.
Adjusted EBITDA margin
Adjusted EBITDA margin is an important measure of profitability for the sector and accounts for the gross margins and operating costs mentioned previously. Unlike operating margin, it is not distorted by accounting conventions around reserves, drilling costs and assumptions on commodity consumption from the well or basin. Adjusted EBITDA highlights the economic reality of how much cash the rock produces before the capital structure (debt service) and the drilling budget (capex) are considered.
Northern Oil and Gas has performed well over the last five years. It demonstrated strong profitability for an upstream and integrated energy business, with an average EBITDA margin of 62.2%.
Looking at the trend in its profitability, Northern Oil and Gas’s EBITDA margin decreased by 38.4 percentage points over the last year. This raises questions about the company’s expense base because its revenue growth should have given it leverage on its fixed costs, resulting in better economies of scale and profitability.
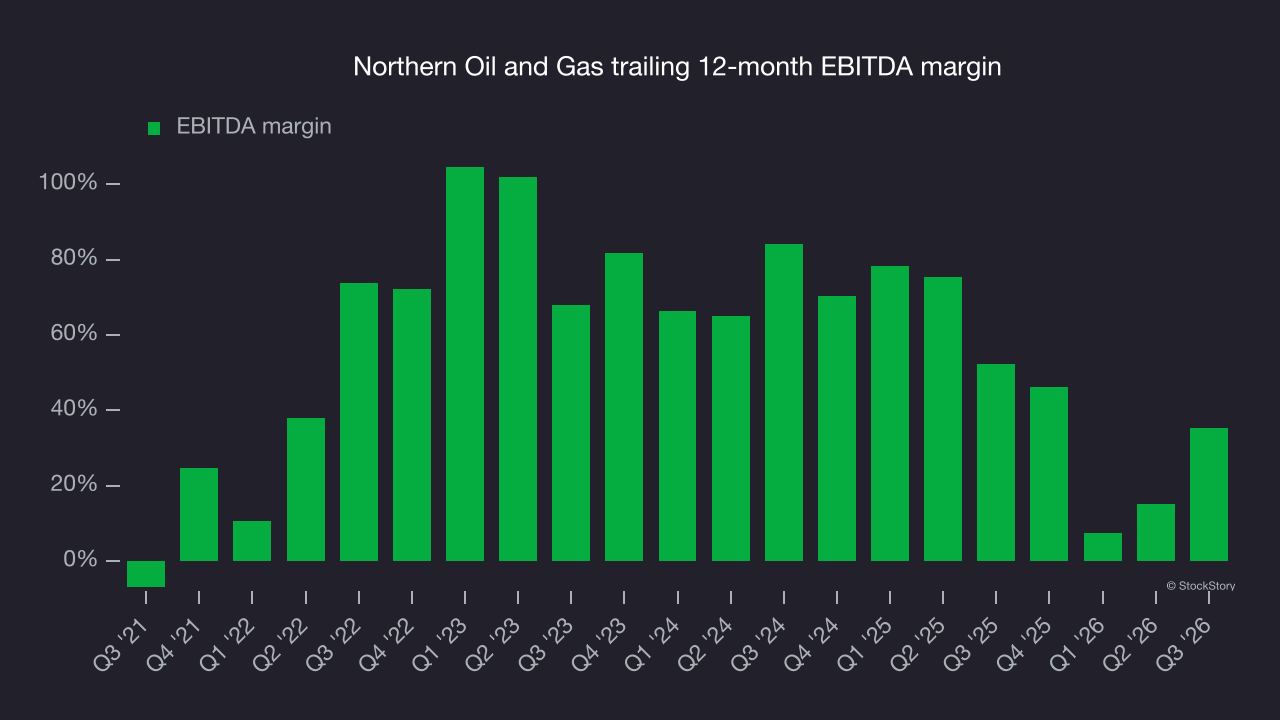
This quarter, Northern Oil and Gas generated an EBITDA margin of 128%, up 114.9 percentage points year on year. This increase was a positive development, especially since its revenue fell, showing it was more efficient because it scaled down its expenses. This adjusted EBITDA beat Wall Street’s consensus estimates by 9.1%.
Free cash flow
As mentioned above, adjusted EBITDA ignores capital structure and drilling expenditure decisions. These are two major factors for an energy producer, so investors need to account for them to get a comprehensive picture of business quality. In other words, adjusted EBITDA margins could be solid but free cash flow could be poor because asset decline rates are steep and drilling is expensive. Free cash flow reflects not only the economics of past production but also the cost of staying in business through further drilling or extraction.
Northern Oil and Gas has shown strong cash profitability, driven by its lucrative business model that enables it to reinvest, return capital to investors and stay ahead of the competition. The company’s free cash flow margin was among the best in the energy upstream and integrated energy sector, averaging 22.3% over the last five years.
The level of free cash flow is important, but its durability across cycles is just as critical. Consistent margins are far more valuable than volatile swings driven by commodity prices.
Northern Oil and Gas’s ratio of quarterly free cash flow volatility to West Texas Intermediate, or WTI, crude price volatility over the past five years was 2.6 (lower is better), indicating strong insulation from commodity swings. This stability supports superior capital access in downturns and positions Northern Oil and Gas to act as a consolidator when weaker peers are forced to retrench.
This stability analysis compares free cash flow, rather than revenue or EBITDA, with WTI crude prices. What ultimately matters is not how much revenue or profit a company earns when prices are high but how much cash it can generate when prices are low. Free cash flow is the superior metric because it captures hedging effectiveness, growth and maintenance capex and management behavior during good times and bad.
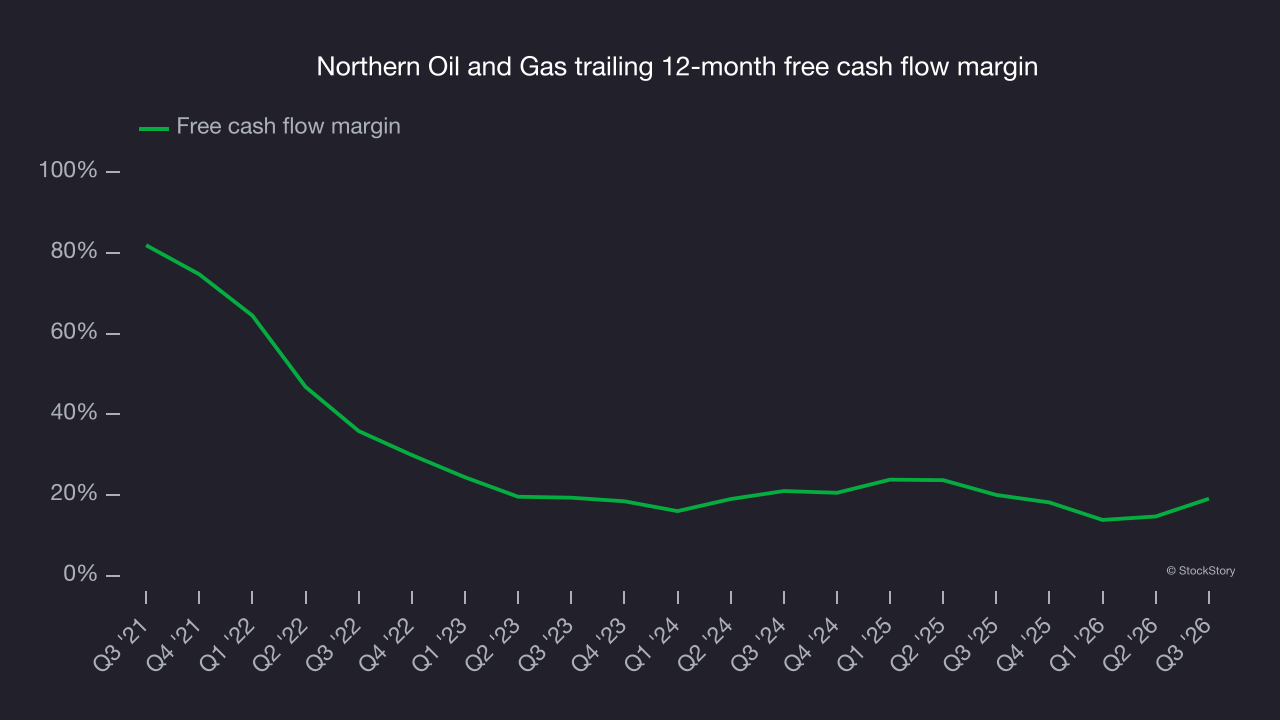
Northern Oil and Gas’s free cash flow totaled $148.6 million in Q3, equivalent to a 42.9% margin. This was a good result, as its margin was 26.3 percentage points higher than in the same quarter last year. Its cash profitability was also above its five-year level.
Key takeaways from Northern Oil and Gas’s Q3 results
Northern Oil and Gas delivered a solid Q3, with EPS and EBITDA both beating analysts’ consensus estimates. Revenue, however, missed expectations. Those earnings beats were key positives for the quarter. Shares rose 2.4% to $22.66 immediately after the results.
Northern Oil and Gas had a good quarter, but that alone doesn’t determine whether to invest. That decision calls for a look at its valuation, business quality and latest quarterly results. For more on those factors, read the full research report here (it’s free).