Professional services firm Huron Consulting Group (NASDAQ: HURN) met Wall Street’s revenue expectations in Q3 2026, with revenue up 11.4% year on year to $491.5 million. The company’s full-year revenue guidance of $1.87 billion at the midpoint was close to analysts’ consensus estimates. Its non-GAAP profit of $2.62 per share was 5.9% above analysts’ consensus estimates.
For more on Huron, read our free full research report.
Huron (HURN) Q3 2026 highlights:
- Revenue $491.5 million vs S&P analysts’ consensus estimates of $493.2 million (11.4% year-on-year growth, in line)
- Adjusted EPS $2.62 vs S&P analysts’ consensus estimates of $2.47 (5.9% beat)
- Adjusted EBITDA $77.34 million vs analysts’ consensus estimates of $76 million (15.7% margin, 1.8% beat)
- Revenue guidance The company reconfirmed its revenue guidance for the full year of $1.87 billion at the midpoint
- Adjusted EPS guidance Management raised its full-year adjusted EPS guidance to $9.30 at the midpoint, a 1.1% increase
- Operating margin 12%, in line with the same quarter last year
- Free cash flow margin 10%, down from 21.8% in the same quarter last year
- Market capitalization $2.90 billion
“Our third quarter results continue our strong multi-year performance, further demonstrating the consistent execution by our highly talented global team and the differentiation of our industry focused, proprietary offerings. Combined with our year-to-date performance, our strong backlog and pipeline give us confidence to narrow our full-year RBR guidance range and raise our earnings guidance, which, at the midpoint, reflect double-digit percentage RBR growth for full year 2026 and continued margin expansion, while establishing a solid base for continued growth in 2027,” added Hussey.
Revenue growth
A company’s long-term revenue performance can indicate its overall quality. Any business can experience short-term success, but top-performing ones sustain growth for years.
With $1.86 billion in revenue over the past 12 months, Huron is a mid-sized business services company, which sometimes brings disadvantages compared to larger competitors benefiting from better economies of scale. On the positive side, it can still achieve high growth rates because it’s working from a smaller revenue base.
Huron’s 16.5% annualized revenue growth over the last five years was strong, indicating higher demand than at many business services companies.
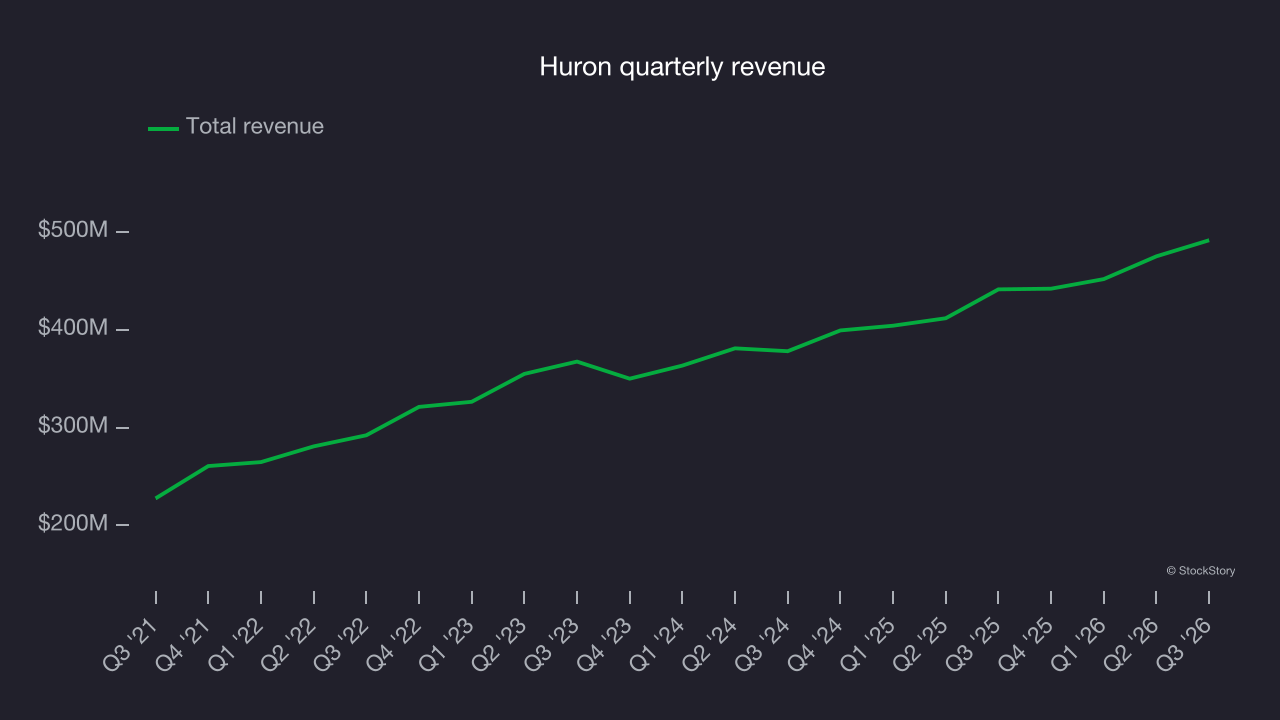
Long-term growth matters most, but within business services, a half-decade historical view may miss recent innovations or disruptive industry trends. Huron’s annualized revenue growth of 12.4% over the last two years is below its five-year trend, but the results still suggest healthy demand. 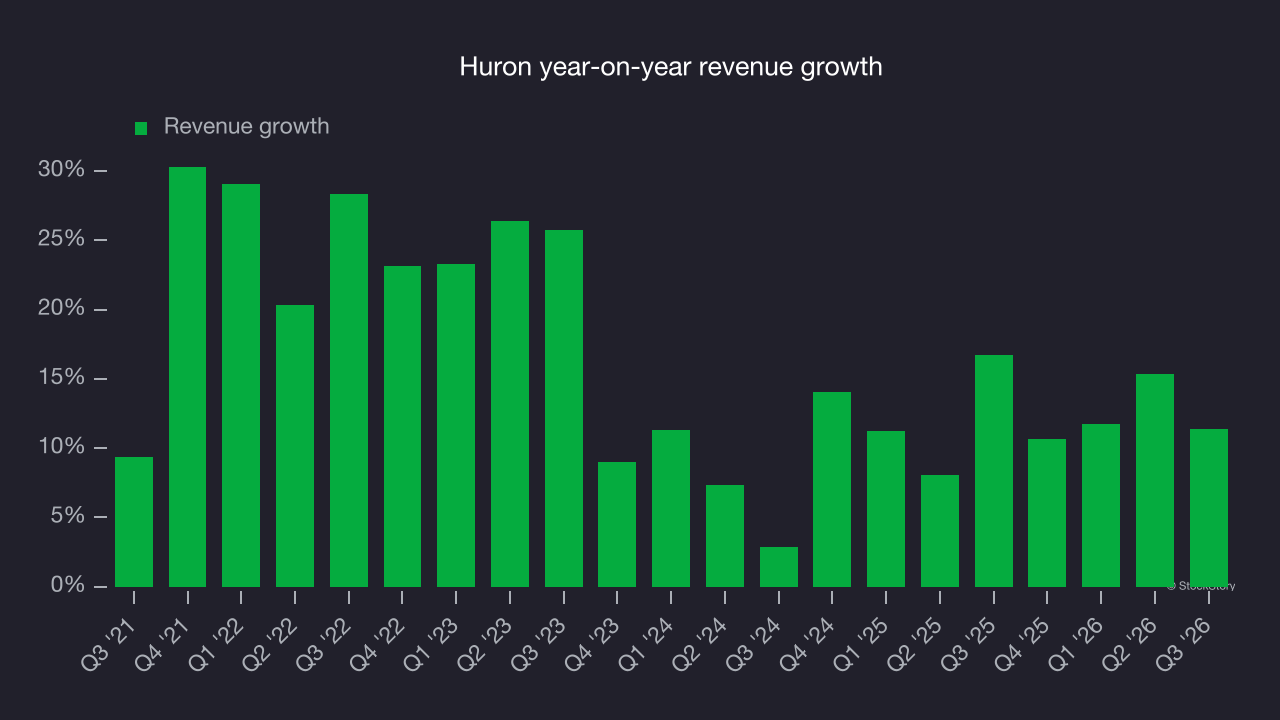
This quarter, Huron’s year-on-year revenue growth was 11.4%, and its $491.5 million of revenue was in line with Wall Street’s consensus estimates.
Looking ahead, sell-side analysts expect revenue to grow 10.4% over the next 12 months, according to S&P, a slight deceleration versus the last two years. Still, this is a solid projection and indicates the market sees success for its products and services.
Adjusted operating margin
Huron was profitable over the last five years but held back by its large cost base. Its average adjusted operating margin of 9.9% was weak for a business services company.
On the positive side, Huron’s adjusted operating margin rose by 3.5 percentage points over the last five years, as its revenue growth gave it operating leverage.
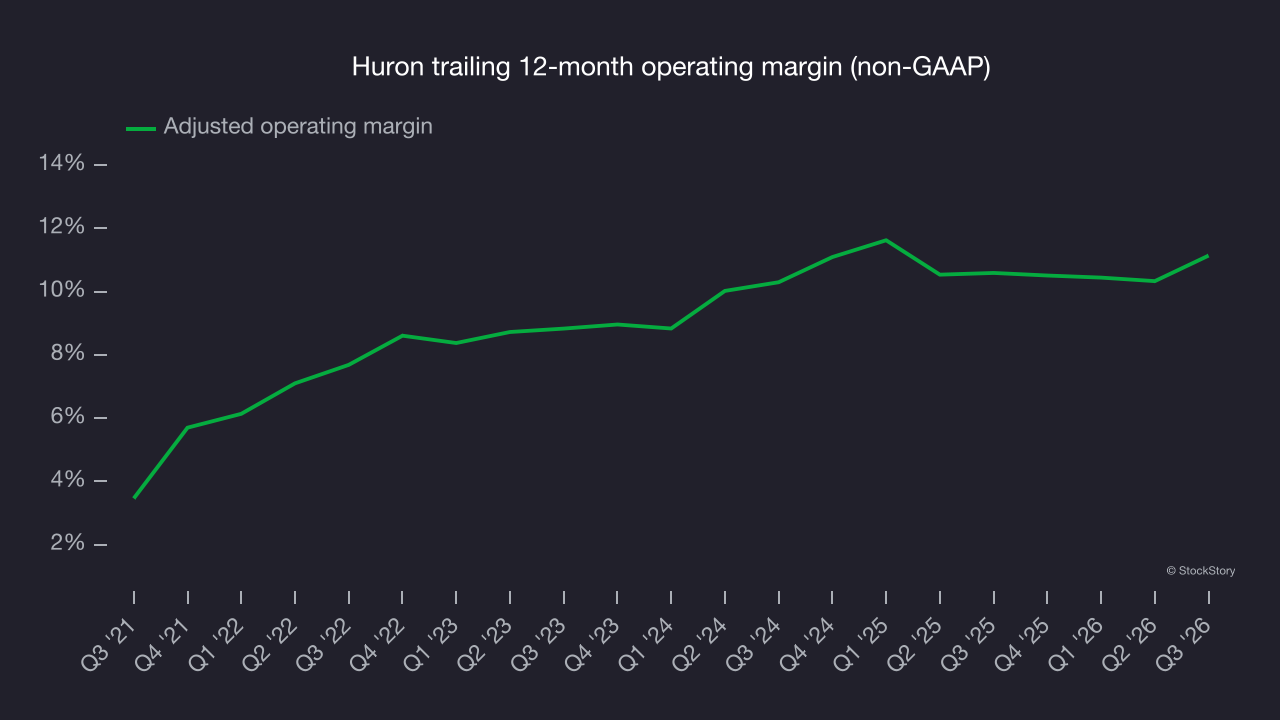
In Q3, Huron generated an adjusted operating margin of 14.3%, up 3 percentage points year on year. This improvement shows it was more efficient.
Earnings per share
Revenue trends explain a company’s historical growth, but the long-term change in earnings per share (EPS) points to the profitability of that growth. For example, a company could inflate its revenue through excessive spending on advertising and promotions.
Huron’s EPS grew at a 31.7% compounded annual growth rate over the last five years, higher than its 16.5% annualized revenue growth. This indicates the company became more profitable on a per-share basis as it expanded.
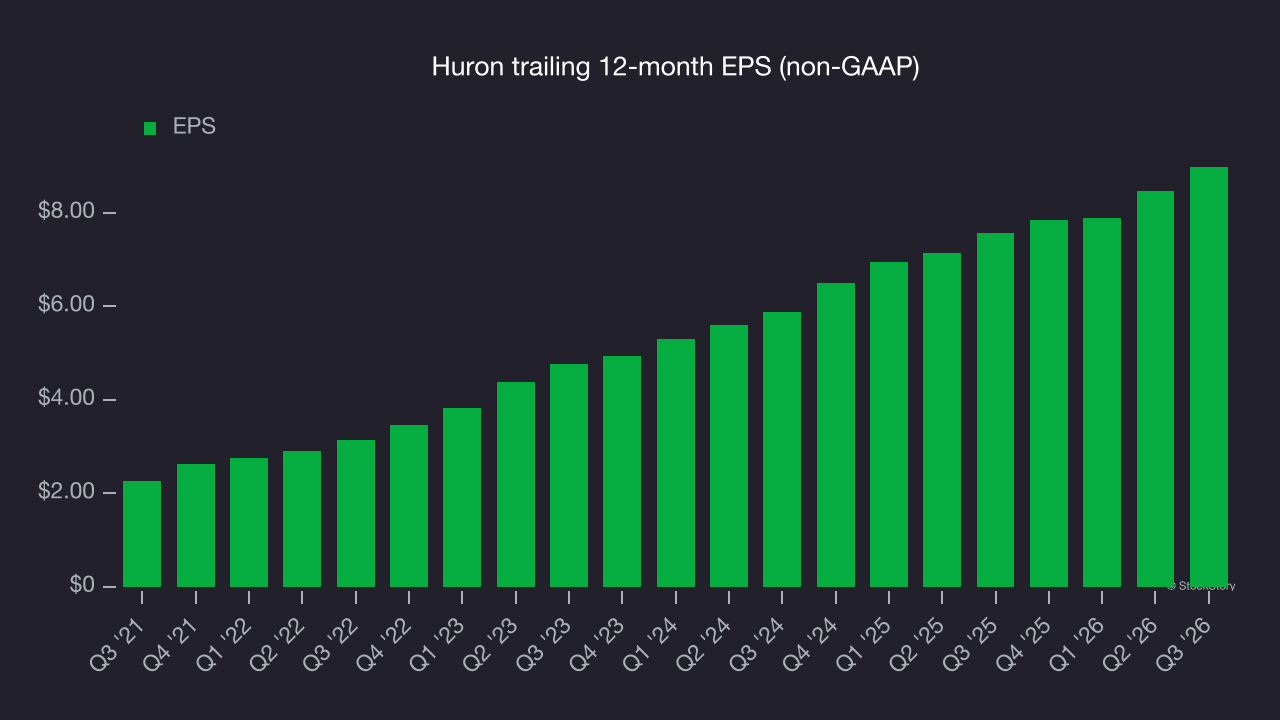
A closer look at Huron’s quality of earnings helps explain its performance. As mentioned earlier, Huron’s adjusted operating margin expanded by 3.5 percentage points over the last five years. In addition, its share count shrank by 24.5%. These are positive signs for shareholders because improving profitability and share buybacks boost EPS growth relative to revenue growth. 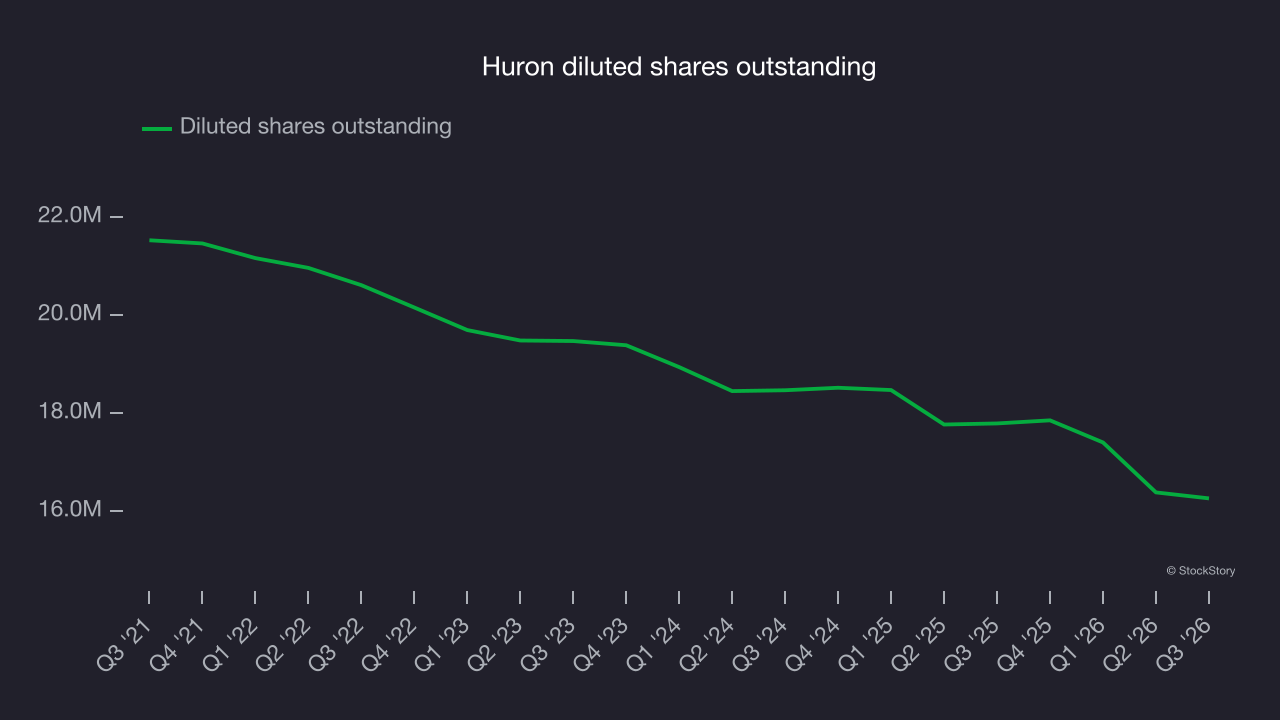
As with revenue, examining EPS over a shorter period can reveal changes in the business.
Huron’s two-year annual EPS growth of 23.6% was lower than its five-year trend, but still represented a solid pace of growth.
In Q3, Huron reported adjusted EPS of $2.62, rising from $2.10 in the same quarter last year. This result beat analysts’ consensus estimates by 5.9%. Over the next 12 months, Wall Street expects Huron’s full-year EPS to grow 12.5% from $8.98 to $10.10, according to S&P.
Key takeaways from Huron’s Q3 results
Huron’s Q3 results had some key positives: EPS beat analysts’ consensus estimates, and full-year EPS guidance narrowly topped Wall Street’s consensus. Revenue, however, was in line with expectations. The market appeared to be hoping for more, with shares tumbling 6.5% to $185.75 immediately after the results.
The latest quarter is only one piece of the longer-term business quality picture. Quality, combined with valuation, can help determine whether the stock is a buy. Read our full research report here (it’s free).