Corcept has followed the market’s trajectory closely, rising in tandem with the S&P 500 over the past six months. The stock has climbed by 13.8% to $81.75 per share while the index has gained 13.9%.
Is there a buying opportunity in Corcept, or does it present a risk to your portfolio? Get the full breakdown from our expert analysts, it’s free for active Edge members.
Why Is Corcept Not Exciting?
We're swiping left on Corcept for now. Here are three reasons we avoid CORT and a stock we'd rather own.
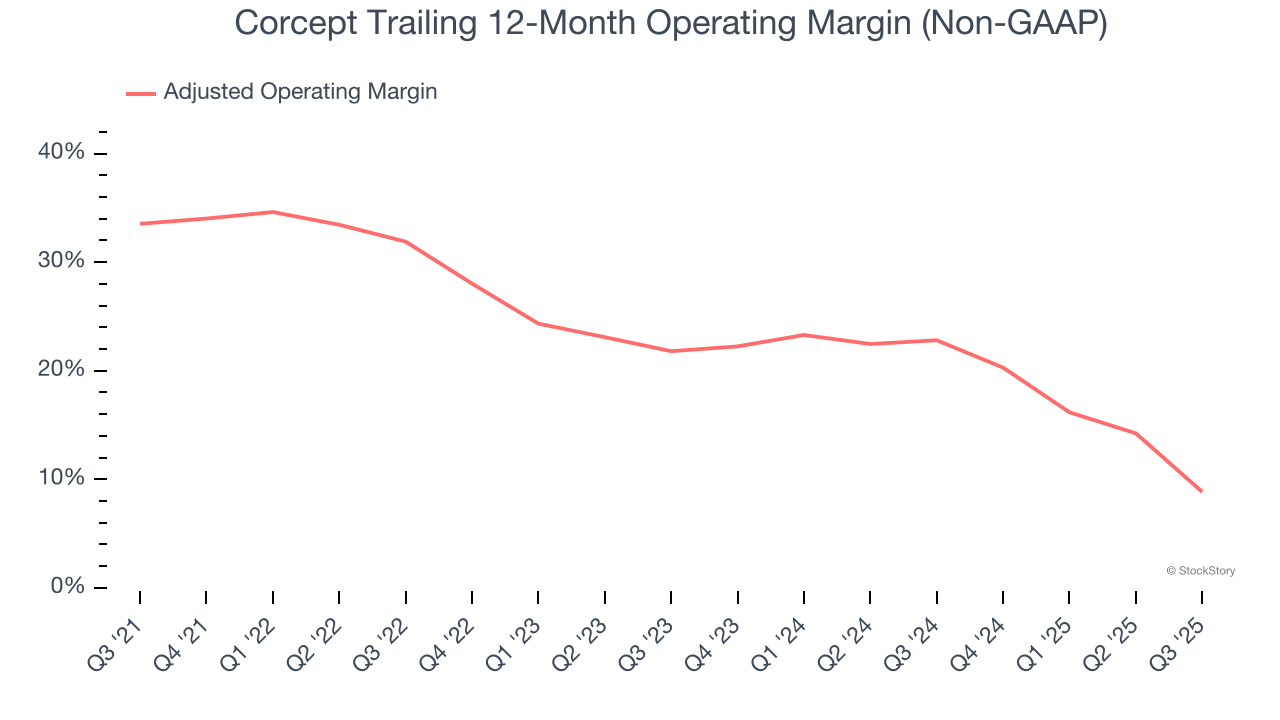
1. Shrinking Adjusted Operating Margin
Adjusted operating margin is one of the best measures of profitability because it tells us how much money a company takes home after subtracting all core expenses, like marketing and R&D. It also removes various one-time costs to paint a better picture of normalized profits.
Analyzing the trend in its profitability, Corcept’s adjusted operating margin decreased by 24.7 percentage points over the last five years. This raises questions about the company’s expense base because its revenue growth should have given it leverage on its fixed costs, resulting in better economies of scale and profitability. Its adjusted operating margin for the trailing 12 months was 8.8%.
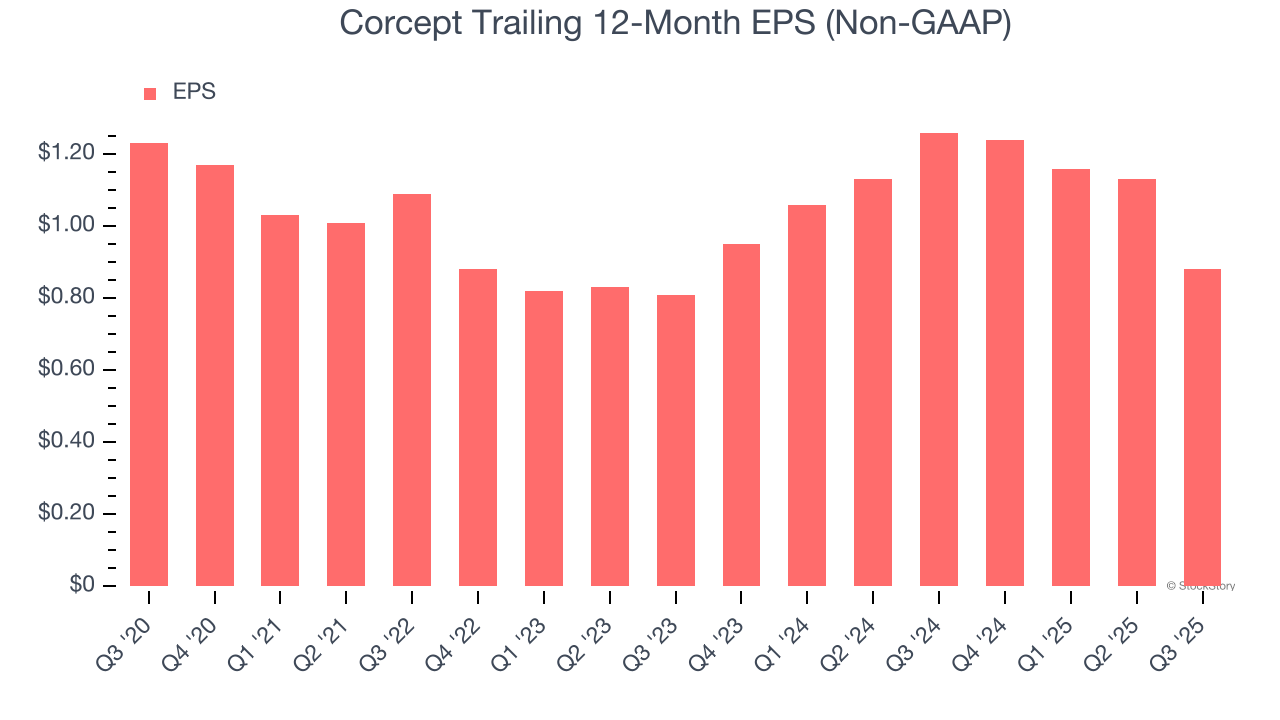
2. EPS Trending Down
Analyzing the long-term change in earnings per share (EPS) shows whether a company's incremental sales were profitable – for example, revenue could be inflated through excessive spending on advertising and promotions.
Sadly for Corcept, its EPS declined by 6.5% annually over the last five years while its revenue grew by 21.5%. This tells us the company became less profitable on a per-share basis as it expanded.
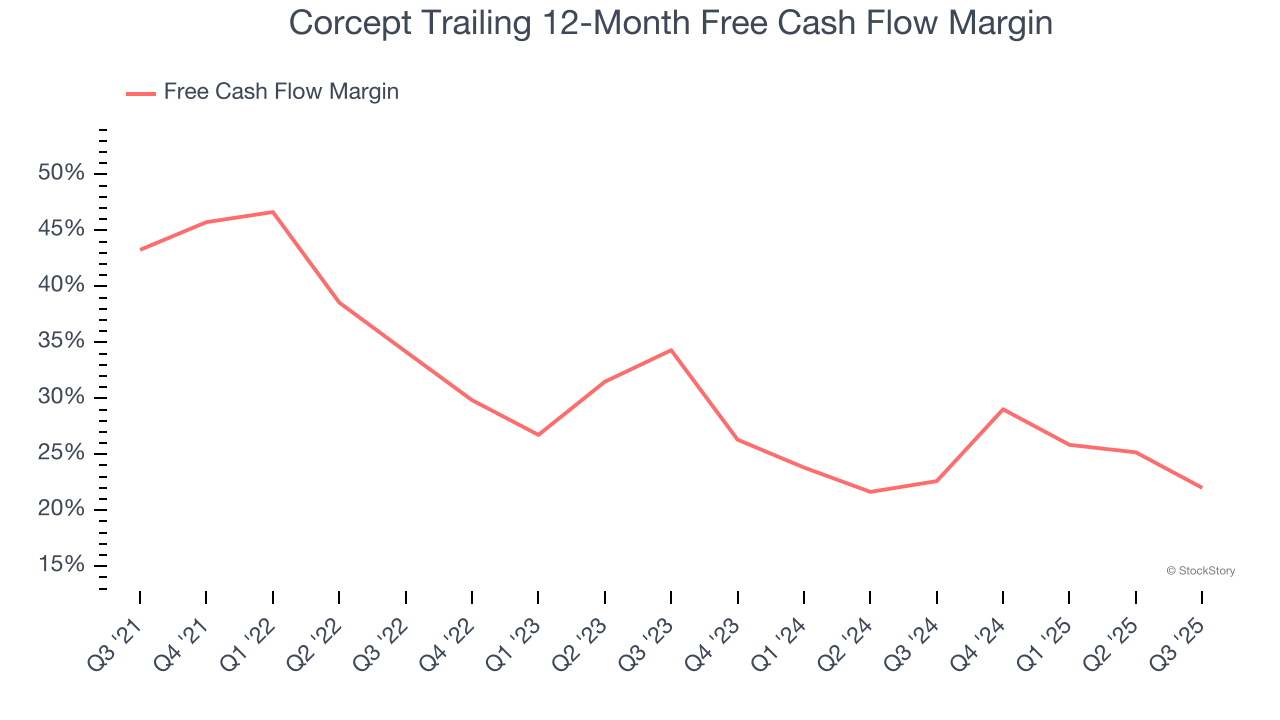
3. Free Cash Flow Margin Dropping
If you’ve followed StockStory for a while, you know we emphasize free cash flow. Why, you ask? We believe that in the end, cash is king, and you can’t use accounting profits to pay the bills.
As you can see below, Corcept’s margin dropped by 21.3 percentage points over the last five years. Continued declines could signal it is in the middle of an investment cycle. Corcept’s free cash flow margin for the trailing 12 months was 22%.
Final Judgment
Corcept’s business quality ultimately falls short of our standards. That said, the stock currently trades at 99.5× forward P/E (or $81.75 per share). This valuation tells us a lot of optimism is priced in - we think other companies feature superior fundamentals at the moment. We’d suggest looking at one of our top digital advertising picks.
Stocks We Like More Than Corcept
If your portfolio success hinges on just 4 stocks, your wealth is built on fragile ground. You have a small window to secure high-quality assets before the market widens and these prices disappear.
Don’t wait for the next volatility shock. Check out our Top 9 Market-Beating Stocks. This is a curated list of our High Quality stocks that have generated a market-beating return of 244% over the last five years (as of June 30, 2025).
Stocks that have made our list include now familiar names such as Nvidia (+1,326% between June 2020 and June 2025) as well as under-the-radar businesses like the once-micro-cap company Tecnoglass (+1,754% five-year return). Find your next big winner with StockStory today.