Industrial conglomerate 3M (NYSE: MMM) reported Q3 CY2025 results exceeding the market’s revenue expectations, with sales up 7.4% year on year to $6.52 billion. Its non-GAAP profit of $2.19 per share was 5.6% above analysts’ consensus estimates.
Is now the time to buy 3M? Find out by accessing our full research report, it’s free for active Edge members.
3M (MMM) Q3 CY2025 Highlights:
- Revenue: $6.52 billion vs analyst estimates of $6.25 billion (7.4% year-on-year growth, 4.2% beat)
- Adjusted EPS: $2.19 vs analyst estimates of $2.07 (5.6% beat)
- Management raised its full-year Adjusted EPS guidance to $8 at the midpoint, a 1.6% increase
- Operating Margin: 22.2%, in line with the same quarter last year
- Free Cash Flow Margin: 23.6%, down from 25.5% in the same quarter last year
- Organic Revenue rose 3.2% year on year vs analyst estimates of 2.3% growth (93.8 basis point beat)
- Market Capitalization: $82.44 billion
Company Overview
Producers of the first asthma inhaler, 3M Company (NYSE: MMM) is a global conglomerate known for products in industries like healthcare, safety, electronics, and consumer goods.
Revenue Growth
A company’s long-term sales performance can indicate its overall quality. Any business can put up a good quarter or two, but many enduring ones grow for years. 3M’s demand was weak over the last five years as its sales fell at a 5.2% annual rate. This wasn’t a great result and suggests it’s a low quality business.
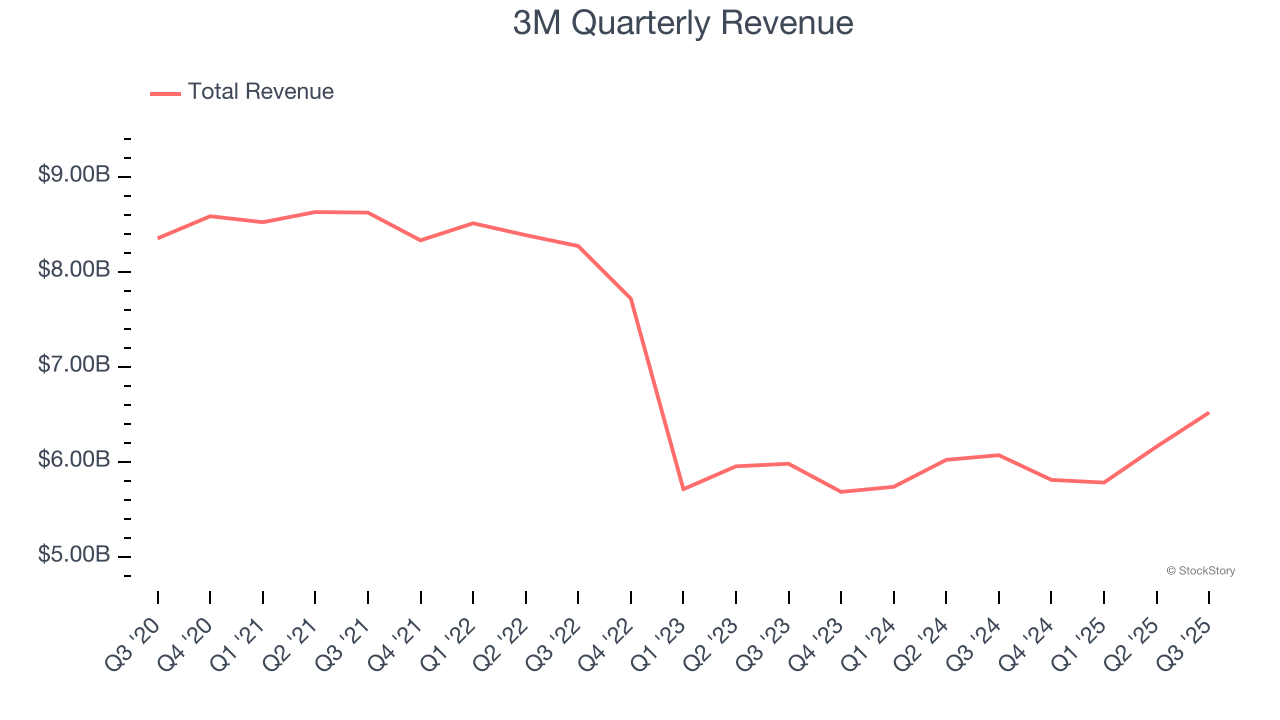
We at StockStory place the most emphasis on long-term growth, but within industrials, a half-decade historical view may miss cycles, industry trends, or a company capitalizing on catalysts such as a new contract win or a successful product line. 3M’s annualized revenue declines of 2.2% over the last two years suggest its demand continued shrinking. 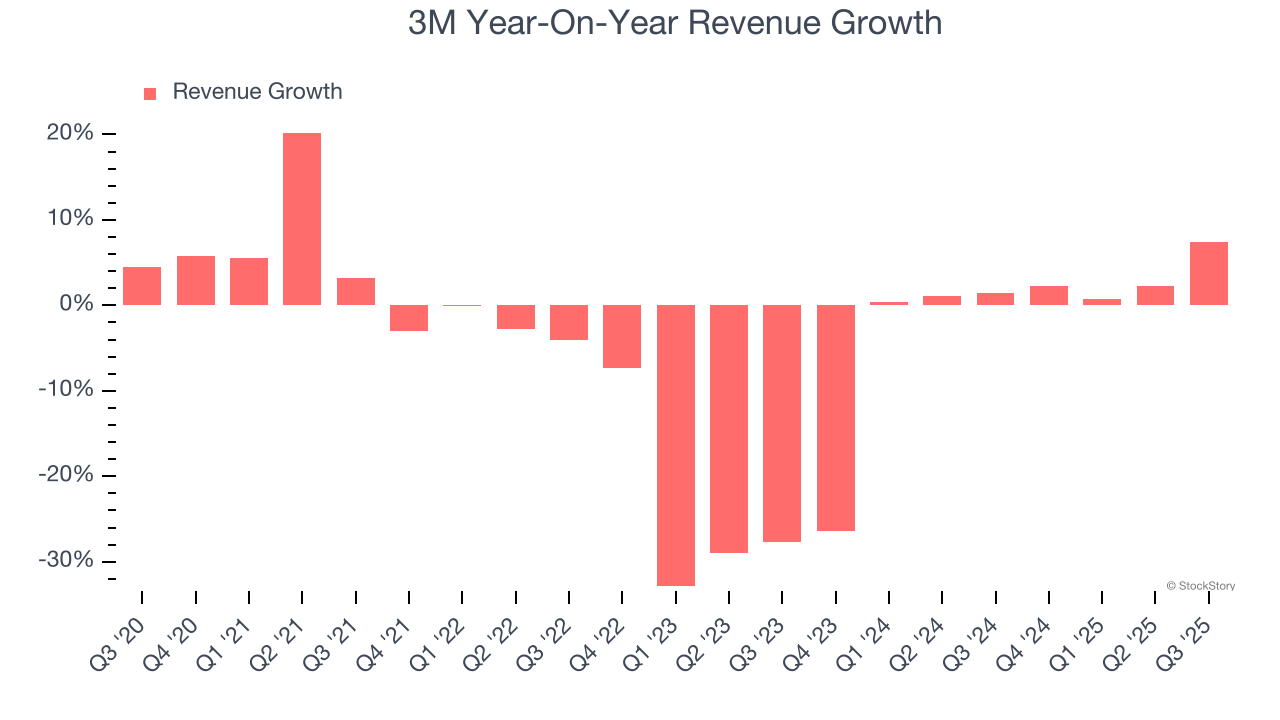
We can dig further into the company’s sales dynamics by analyzing its organic revenue, which strips out one-time events like acquisitions and currency fluctuations that don’t accurately reflect its fundamentals. Over the last two years, 3M’s organic revenue averaged 1.2% year-on-year growth. Because this number is better than its two-year revenue growth, we can see that some mixture of divestitures and foreign exchange rates dampened its headline results. 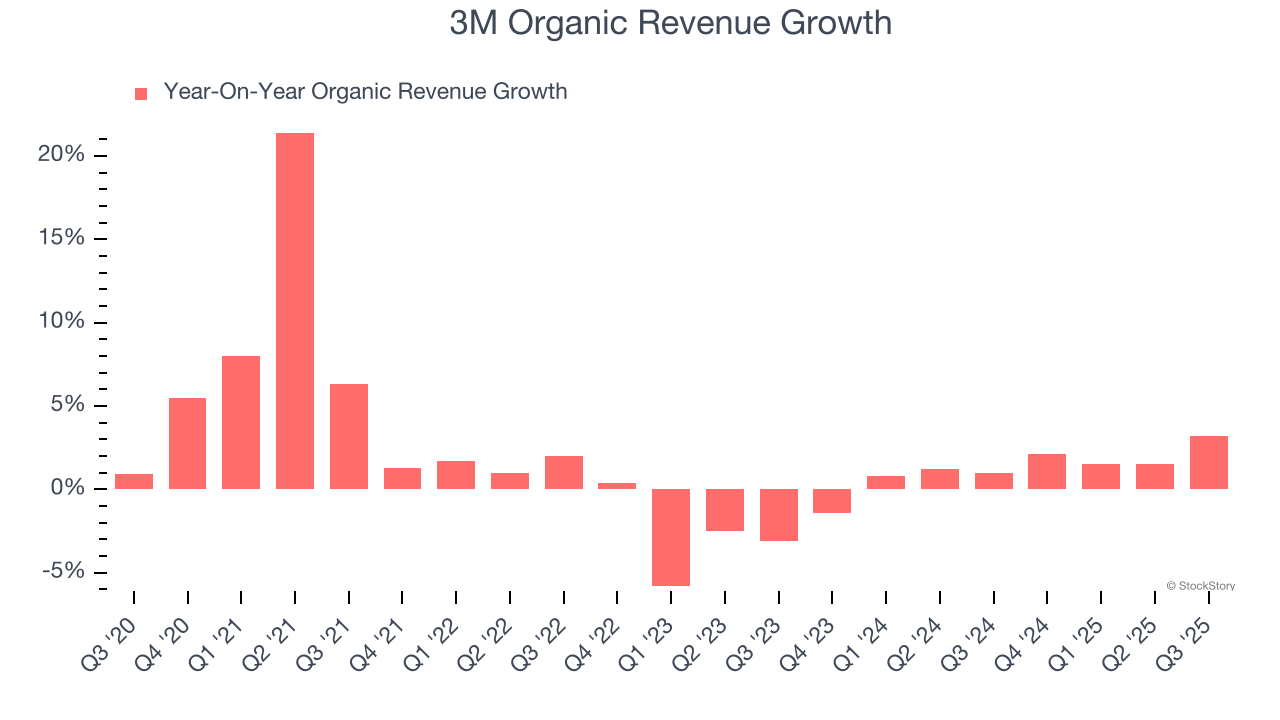
This quarter, 3M reported year-on-year revenue growth of 7.4%, and its $6.52 billion of revenue exceeded Wall Street’s estimates by 4.2%.
Looking ahead, sell-side analysts expect revenue to grow 1.6% over the next 12 months. While this projection suggests its newer products and services will spur better top-line performance, it is still below average for the sector.
Today’s young investors won’t have read the timeless lessons in Gorilla Game: Picking Winners In High Technology because it was written more than 20 years ago when Microsoft and Apple were first establishing their supremacy. But if we apply the same principles, then enterprise software stocks leveraging their own generative AI capabilities may well be the Gorillas of the future. So, in that spirit, we are excited to present our Special Free Report on a profitable, fast-growing enterprise software stock that is already riding the automation wave and looking to catch the generative AI next.
Operating Margin
3M has managed its cost base well over the last five years. It demonstrated solid profitability for an industrials business, producing an average operating margin of 10%. This result isn’t surprising as its high gross margin gives it a favorable starting point.
Looking at the trend in its profitability, 3M’s operating margin decreased by 1.9 percentage points over the last five years. Even though its historical margin was healthy, shareholders will want to see 3M become more profitable in the future.
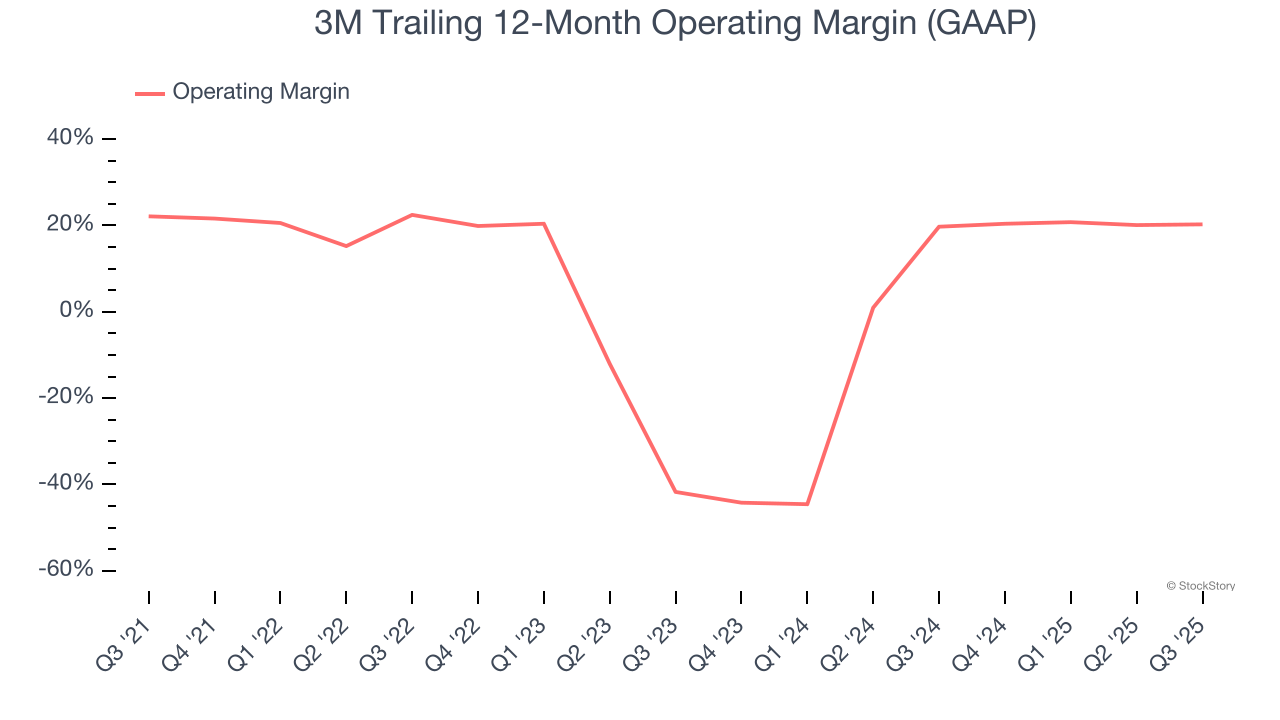
This quarter, 3M generated an operating margin profit margin of 22.2%, in line with the same quarter last year. This indicates the company’s cost structure has recently been stable.
Earnings Per Share
Revenue trends explain a company’s historical growth, but the long-term change in earnings per share (EPS) points to the profitability of that growth – for example, a company could inflate its sales through excessive spending on advertising and promotions.
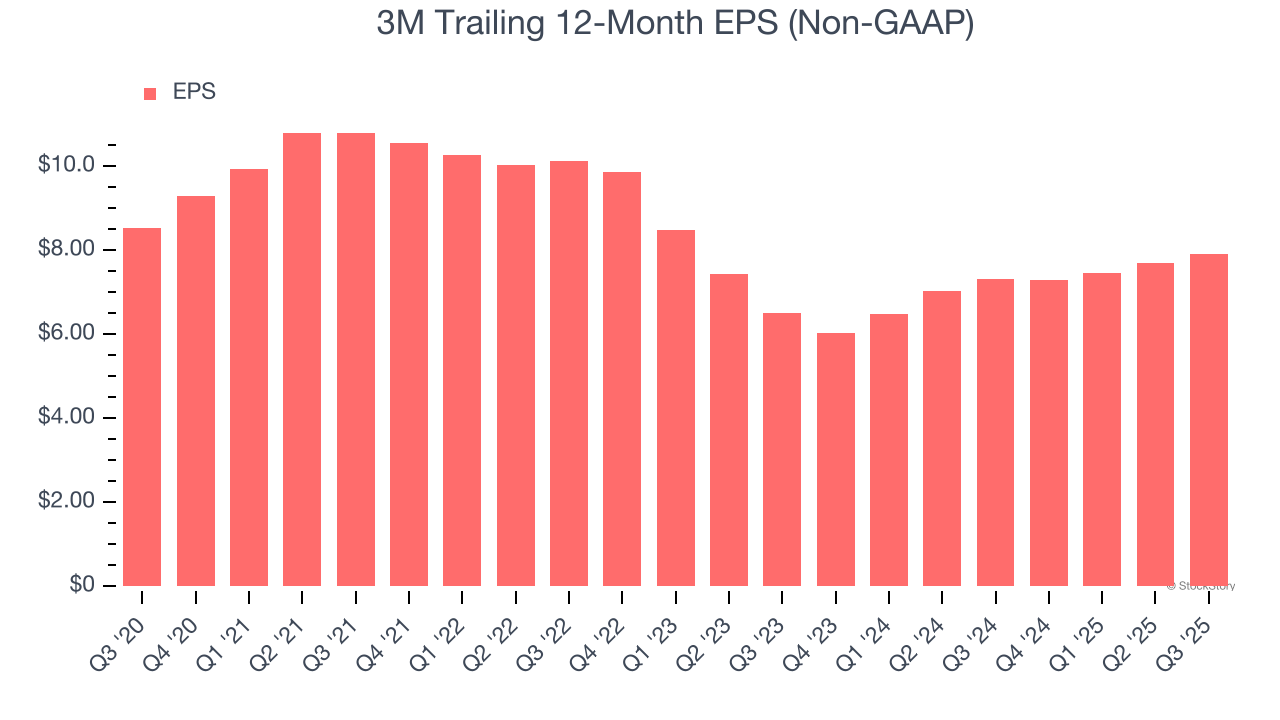
Sadly for 3M, its EPS and revenue declined by 1.5% and 5.2% annually over the last five years. We tend to steer our readers away from companies with falling revenue and EPS, where diminishing earnings could imply changing secular trends and preferences. If the tide turns unexpectedly, 3M’s low margin of safety could leave its stock price susceptible to large downswings.
Like with revenue, we analyze EPS over a shorter period to see if we are missing a change in the business.
For 3M, its two-year annual EPS growth of 10.2% was higher than its five-year trend. This acceleration made it one of the faster-growing industrials companies in recent history.
In Q3, 3M reported adjusted EPS of $2.19, up from $1.98 in the same quarter last year. This print beat analysts’ estimates by 5.6%. Over the next 12 months, Wall Street expects 3M’s full-year EPS of $7.91 to grow 6.2%.
Key Takeaways from 3M’s Q3 Results
We were impressed by how significantly 3M blew past analysts’ revenue expectations this quarter. We were also happy its organic revenue narrowly outperformed Wall Street’s estimates. The last major positive is that full-year EPS guidance was raised. Overall, we think this was a decent quarter with some key metrics above expectations. The stock remained flat at $155.68 immediately after reporting.
3M had an encouraging quarter, but one earnings result doesn’t necessarily make the stock a buy. Let’s see if this is a good investment. We think that the latest quarter is only one piece of the longer-term business quality puzzle. Quality, when combined with valuation, can help determine if the stock is a buy. We cover that in our actionable full research report which you can read here, it’s free for active Edge members.