Digital transformation consultancy Grid Dynamics (NASDAQ: GDYN) beat Wall Street’s revenue expectations in Q3 2026, with revenue rising 9.7% year on year to $114.3 million. Guidance for next quarter’s revenue was better than expected at $114.5 million at the midpoint, 1.5% above analysts’ consensus estimates. Its non-GAAP profit of $0.18 per share was 37.7% above analysts’ consensus estimates.
For more on Grid Dynamics, read our free full research report.
Grid Dynamics (GDYN) Q3 2026 highlights:
- Revenue $114.3 million vs S&P analysts’ consensus estimates of $112.7 million (9.7% year-on-year growth, 1.4% beat)
- Adjusted EPS $0.18 vs S&P analysts’ consensus estimates of $0.13 (37.7% beat)
- Adjusted EBITDA $22.9 million vs analysts’ consensus estimates of $16.81 million (20% margin, 36.2% beat)
- Revenue guidance $114.5 million at the midpoint for Q4 2026, above analysts’ consensus estimates of $112.8 million
- EBITDA guidance $21 million at the midpoint for Q4 2026, above analysts’ consensus estimates of $17.45 million
- Operating margin 8%, up from -0.2% in the same quarter last year
- Market capitalization $709.9 million
Revenue growth
A company’s long-term revenue performance is one signal of its overall quality. Any business can post a good quarter or two, but many enduring ones grow for years.
With $432.7 million in revenue over the past 12 months, Grid Dynamics is a small player in the business services space, which sometimes brings disadvantages compared to larger competitors benefiting from economies of scale and numerous distribution channels. On the positive side, it can grow faster because it has more room to expand.
Grid Dynamics grew its revenue at a strong 19.9% compounded annual growth rate over the last five years. This shows demand for Grid Dynamics was higher than for many business services companies.
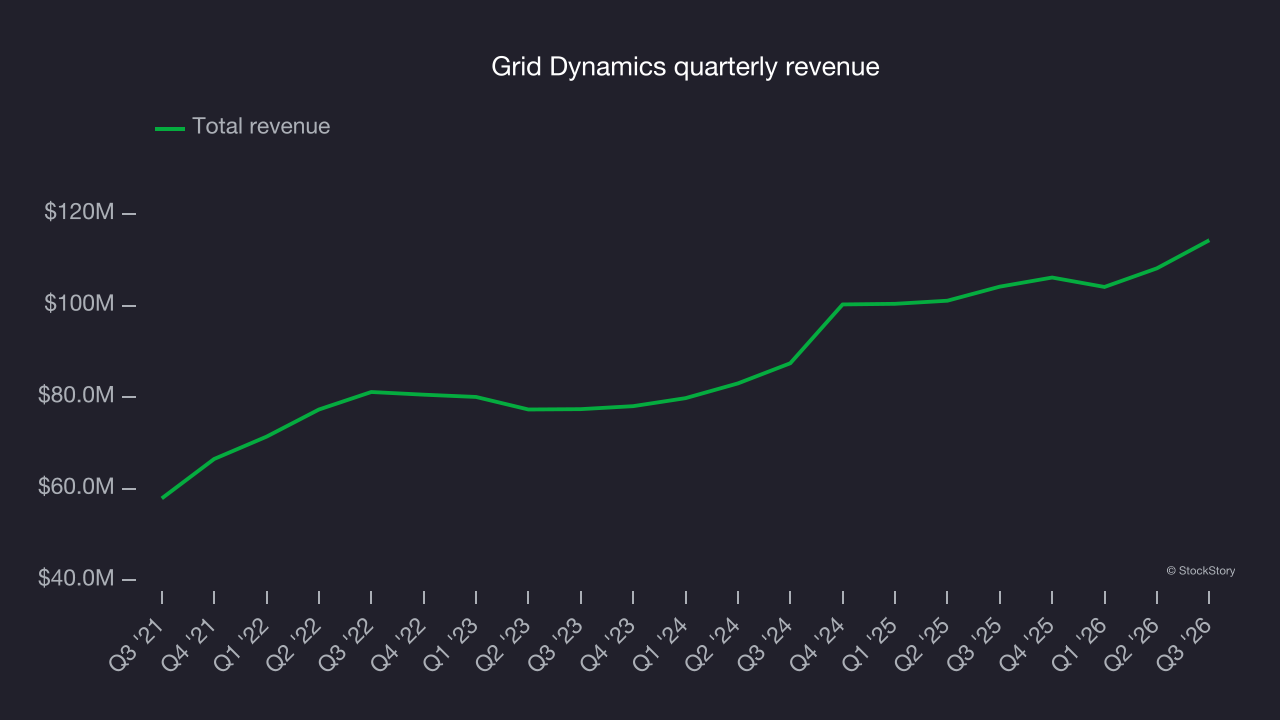
Long-term growth matters most, but within business services, a half-decade historical view may miss recent innovations or disruptive industry trends. Grid Dynamics’s annualized revenue growth of 14.8% over the last two years is below its five-year trend, but the results still suggest healthy demand. 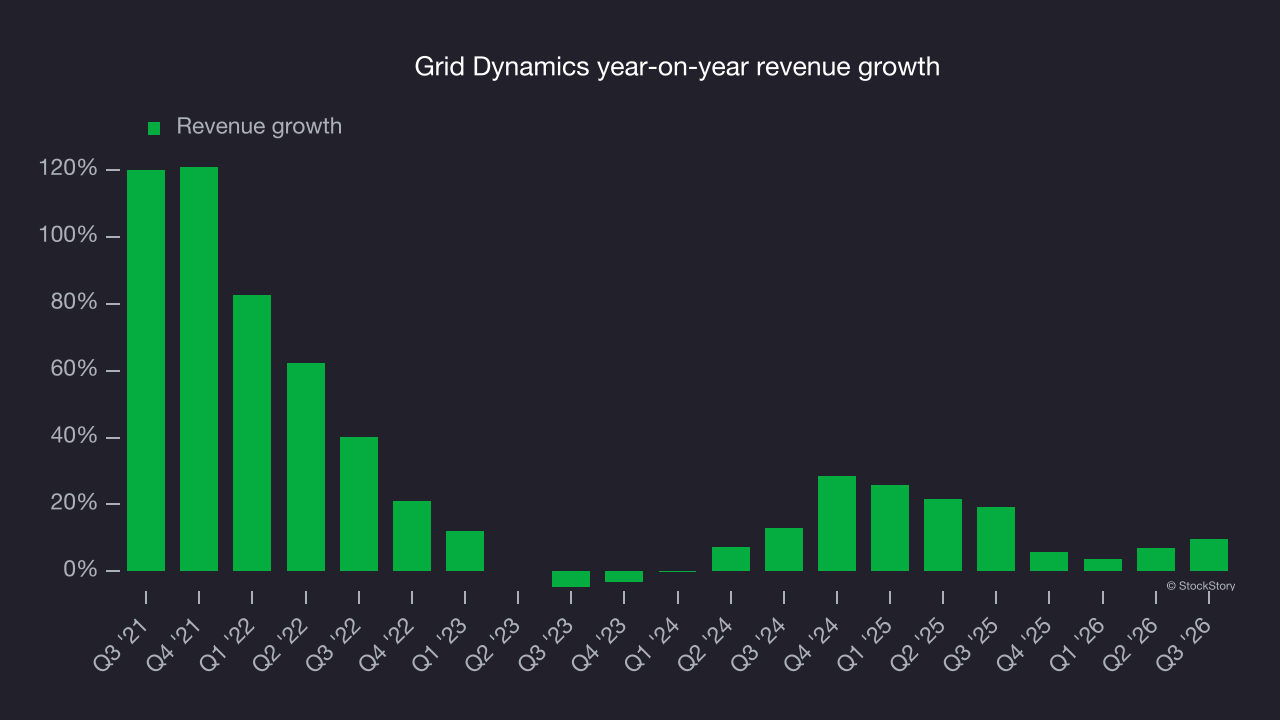
This quarter, Grid Dynamics reported year-on-year revenue growth of 9.7%, and its $114.3 million of revenue exceeded Wall Street’s consensus estimates by 1.4%. Company management is currently guiding for a 7.9% year-on-year increase in revenue next quarter.
Looking further ahead, sell-side analysts expect revenue to grow 7.5% over the next 12 months, according to S&P, a deceleration versus the last two years. Despite the slowdown, this projection is healthy and suggests the market expects success for its products and services.
Adjusted operating margin
Grid Dynamics has done a decent job managing its cost base over the last five years. The company has produced an average adjusted operating margin of 11.3%, higher than the broader business services sector.
Looking at the trend in its profitability, Grid Dynamics’s adjusted operating margin decreased by 6.8 percentage points over the last five years. This raises questions about the company’s expense base because its revenue growth should have given it leverage on its fixed costs, resulting in better economies of scale and profitability.
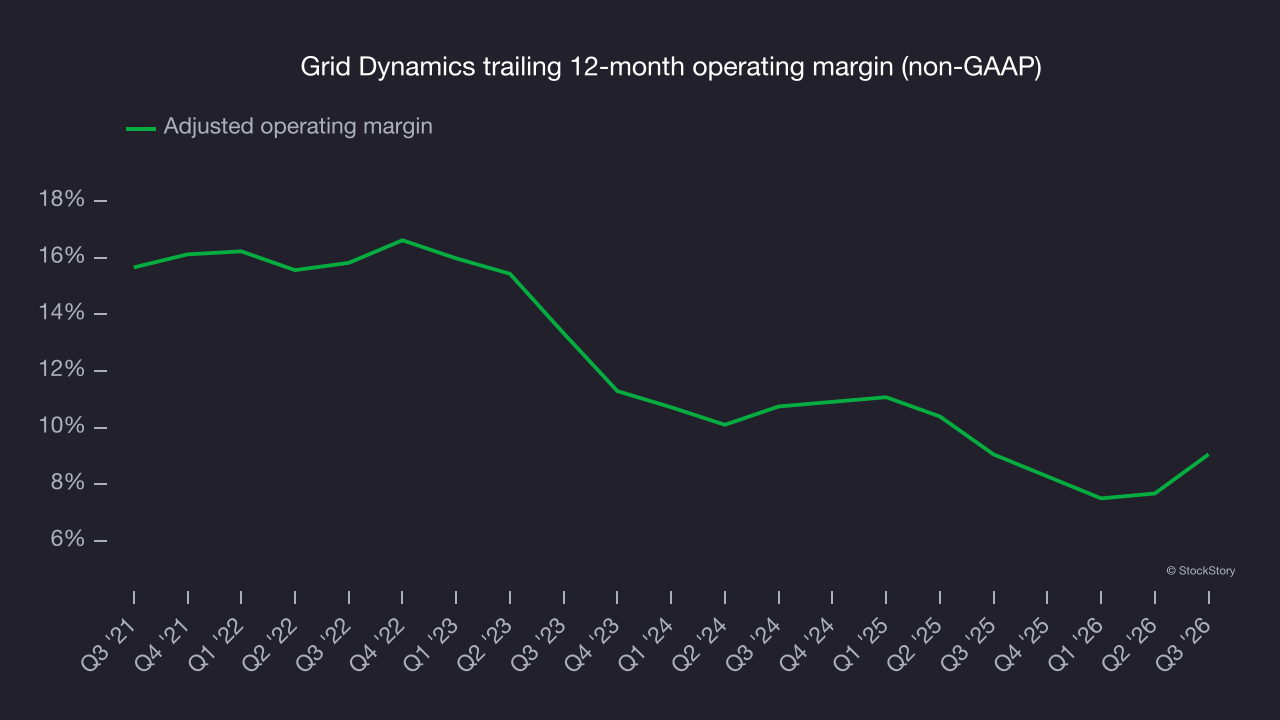
In Q3, Grid Dynamics generated an adjusted operating margin of 12.6%, up 5.3 percentage points year on year. This improvement shows it operated more efficiently.
Earnings per share
Revenue trends explain a company’s historical growth, but the long-term change in earnings per share (EPS) points to the profitability of that growth. For example, a company could inflate its revenue through excessive spending on advertising and promotions.
Grid Dynamics’s EPS grew at a solid 9.9% compounded annual growth rate over the last five years. However, this performance was lower than its 19.9% annualized revenue growth, telling us the company became less profitable on a per-share basis as it expanded.
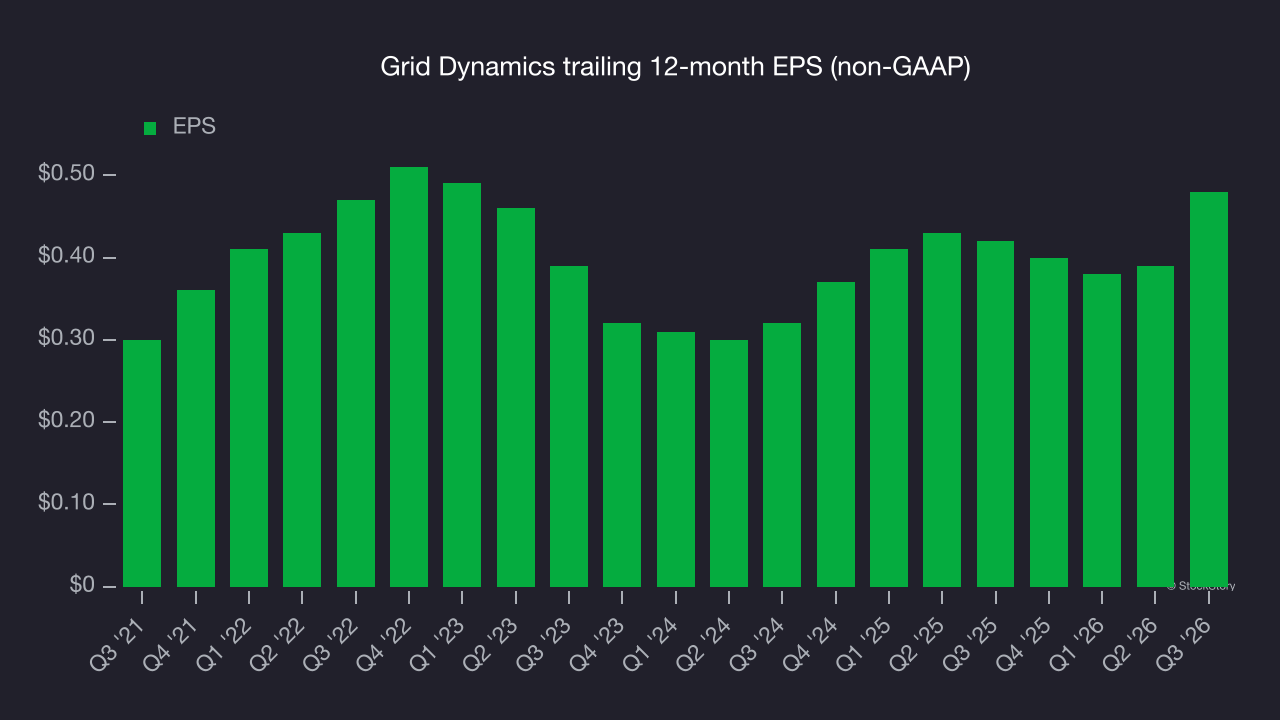
Diving into the nuances of Grid Dynamics’s earnings can give us a better understanding of its performance. As we mentioned earlier, Grid Dynamics’s adjusted operating margin expanded this quarter but declined by 6.8 percentage points over the last five years. Its share count also grew by 30.8%, meaning the company not only became less efficient with its operating expenses but also diluted its shareholders. 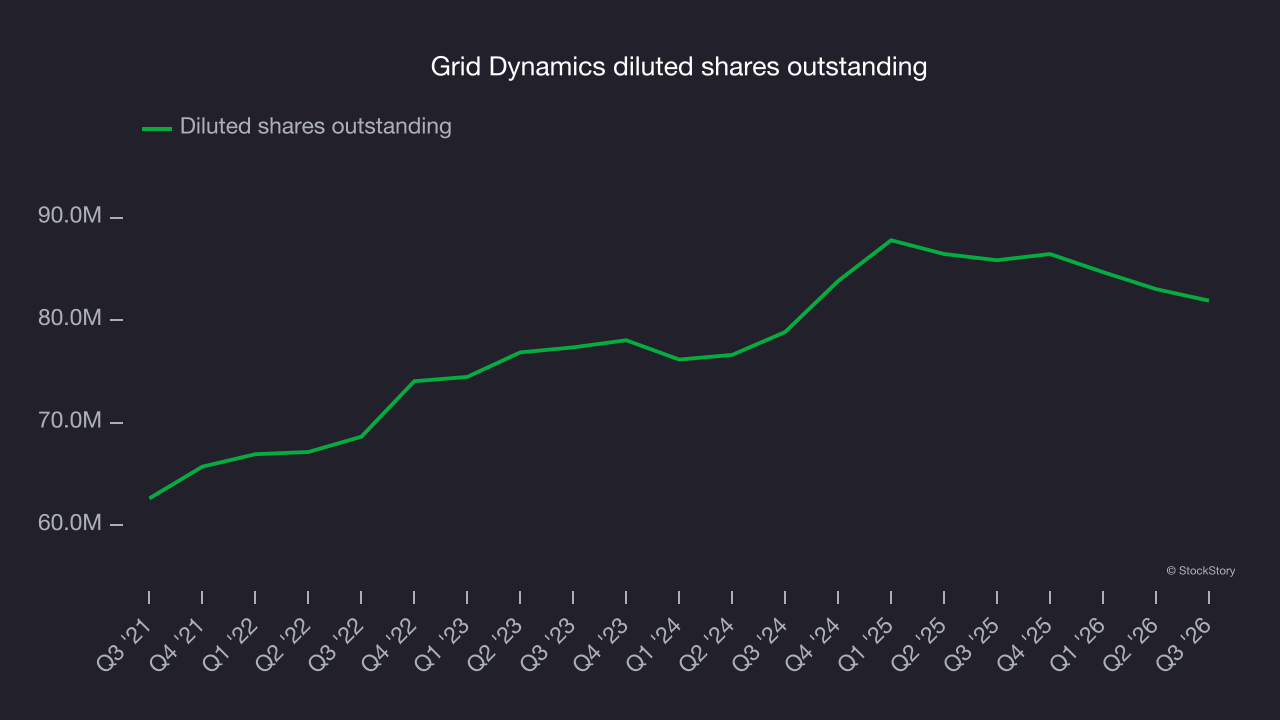
Like with revenue, we analyze EPS over a shorter period to see if we are missing a change in the business.
For Grid Dynamics, its two-year annual EPS growth of 22.5% was higher than its five-year trend. That acceleration is a positive, particularly given the already high base.
In Q3, Grid Dynamics reported adjusted EPS of $0.18, up from $0.09 in the same quarter last year. This result comfortably exceeded analysts’ consensus estimates, a positive for shareholders. Over the next 12 months, Wall Street expects Grid Dynamics’s full-year EPS to stay about the same, moving from $0.48 to $0.48, according to S&P.
Key takeaways from Grid Dynamics’s Q3 results
Grid Dynamics delivered a positive quarter, with EPS beating analysts’ consensus estimates and next-quarter revenue guidance coming in slightly above Wall Street’s consensus. Shares rose 4.7% to $9.95 immediately after the release.
Grid Dynamics had a solid quarterly earnings result. The latest quarter matters, but longer-term business quality and valuation matter more when deciding whether to invest in the stock. For more on Grid Dynamics, read the full research report here (it’s free).