
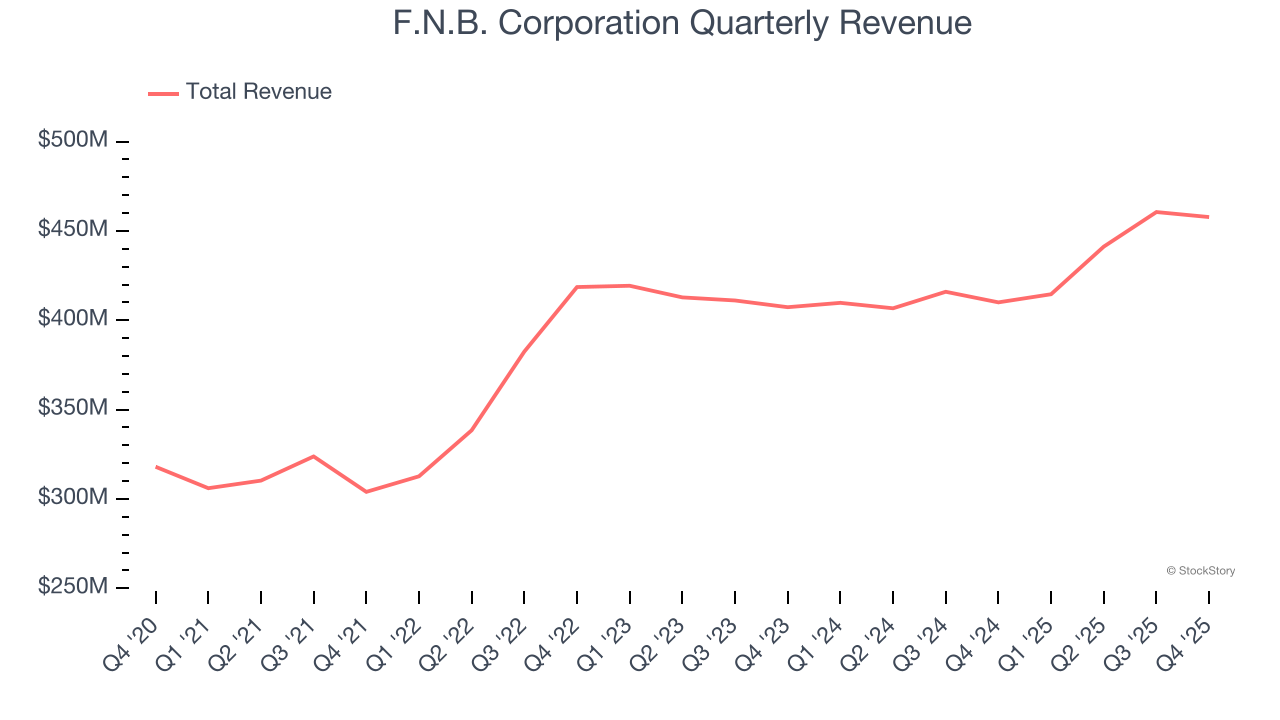
Regional banking company F.N.B. Corporation (NYSE: FNB) met Wall Streets revenue expectations in Q4 CY2025, with sales up 11.6% year on year to $457.8 million. Its non-GAAP profit of $0.50 per share was 22.7% above analysts’ consensus estimates.
Is now the time to buy F.N.B. Corporation? Find out by accessing our full research report, it’s free.
F.N.B. Corporation (FNB) Q4 CY2025 Highlights:
- Net Interest Income: $365.4 million vs analyst estimates of $367.2 million (13.5% year-on-year growth, in line)
- Net Interest Margin: 3.3% vs analyst estimates of 3.3% (in line)
- Revenue: $457.8 million vs analyst estimates of $458.3 million (11.6% year-on-year growth, in line)
- Efficiency Ratio: 53.8% vs analyst estimates of 53.3% (54.7 basis point miss)
- Adjusted EPS: $0.50 vs analyst estimates of $0.41 (22.7% beat)
- Tangible Book Value per Share: $11.87 vs analyst estimates of $11.78 (13.1% year-on-year growth, 0.8% beat)
- Market Capitalization: $6.22 billion
"F.N.B. Corporation delivered an exceptional fourth quarter with operating earnings per diluted common share (non-GAAP) of $0.50 and a return on average tangible common equity (non-GAAP) of 16%. FNB's strong profitability and capital generation resulted in tangible book value per share (non-GAAP) of $11.87, a 13% increase from the year-ago quarter. Our company achieved multiple records for the full-year 2025, including all-time revenue highs for seven of our fee-based businesses, total revenue of $1.8 billion, operating net income available to common shareholders (non-GAAP) of $577 million and operating earnings per diluted common share (non-GAAP) of $1.59," said F.N.B. Corporation Chairman, President and Chief Executive Officer, Vincent J. Delie, Jr.
Company Overview
Tracing its roots back to 1864 during the Civil War era, F.N.B. Corporation (NYSE: FNB) is a diversified financial services holding company that provides banking, wealth management, and insurance services to consumers and businesses across seven states and Washington, D.C.
Sales Growth
In general, banks make money from two primary sources. The first is net interest income, which is interest earned on loans, mortgages, and investments in securities minus interest paid out on deposits. The second source is non-interest income, which can come from bank account, credit card, wealth management, investing banking, and trading fees. Over the last five years, F.N.B. Corporation grew its revenue at a tepid 7.3% compounded annual growth rate. This fell short of our benchmark for the banking sector and is a poor baseline for our analysis.
We at StockStory place the most emphasis on long-term growth, but within financials, a half-decade historical view may miss recent interest rate changes, market returns, and industry trends. F.N.B. Corporation’s recent performance shows its demand has slowed as its annualized revenue growth of 3.7% over the last two years was below its five-year trend. 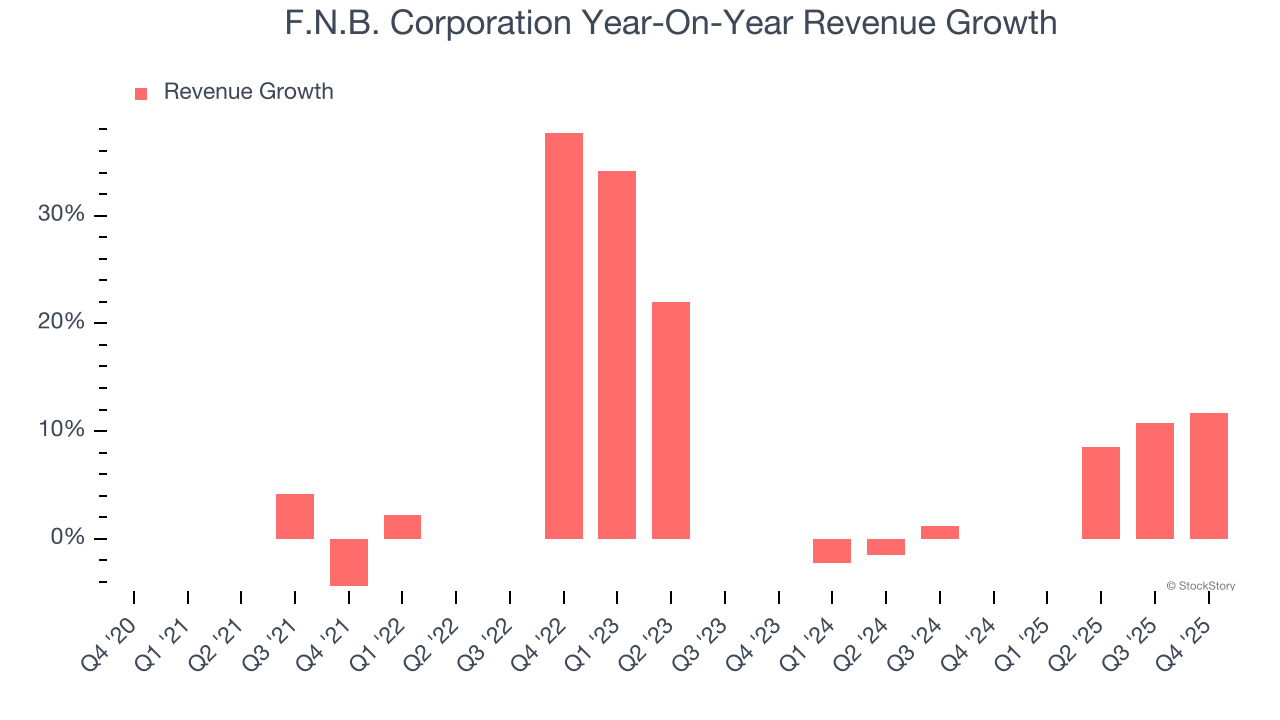 Note: Quarters not shown were determined to be outliers, impacted by outsized investment gains/losses that are not indicative of the recurring fundamentals of the business.
This quarter, F.N.B. Corporation’s year-on-year revenue growth was 11.6%, and its $457.8 million of revenue was in line with Wall Street’s estimates.
Net interest income made up 77.2% of the company’s total revenue during the last five years, meaning lending operations are F.N.B. Corporation’s largest source of revenue.
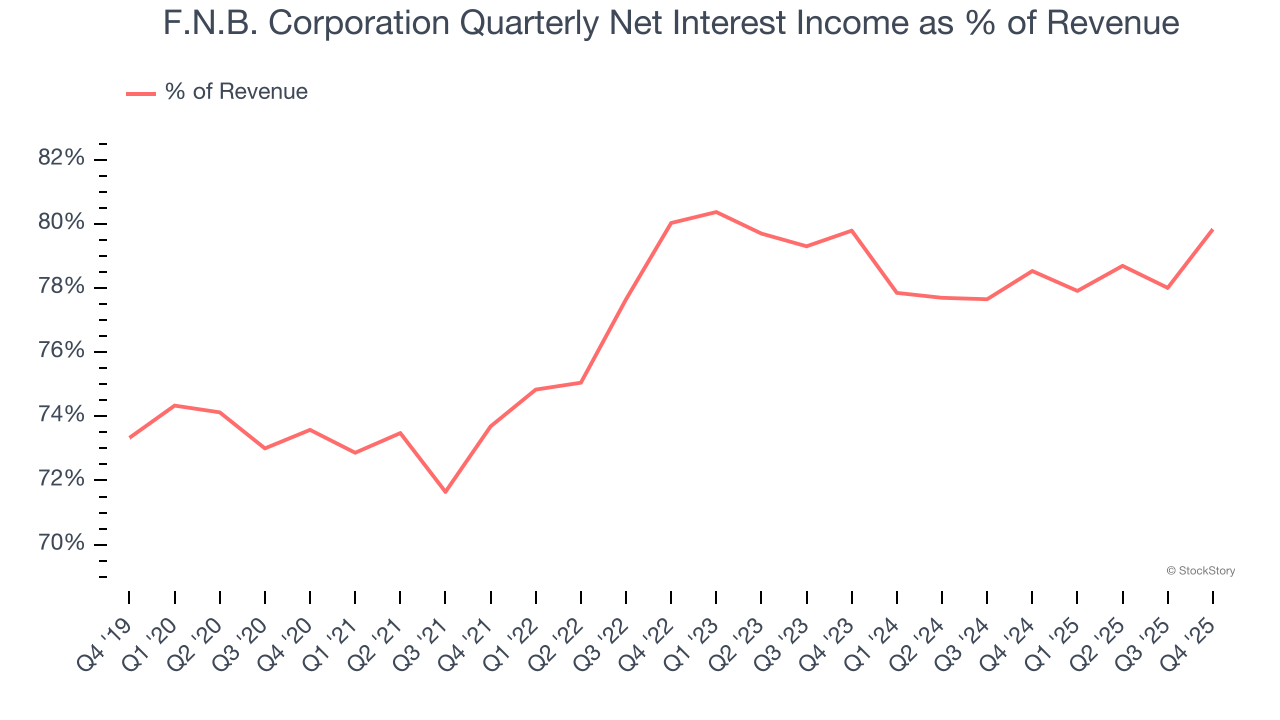
While banks generate revenue from multiple sources, investors view net interest income as the cornerstone - its predictable, recurring characteristics stand in sharp contrast to the volatility of non-interest income.
Software is eating the world and there is virtually no industry left that has been untouched by it. That drives increasing demand for tools helping software developers do their jobs, whether it be monitoring critical cloud infrastructure, integrating audio and video functionality, or ensuring smooth content streaming. Click here to access a free report on our 3 favorite stocks to play this generational megatrend.
Tangible Book Value Per Share (TBVPS)
Banks profit by intermediating between depositors and borrowers, making them fundamentally balance sheet-driven enterprises. Market participants emphasize balance sheet quality and sustained book value growth when evaluating these institutions.
When analyzing banks, tangible book value per share (TBVPS) takes precedence over many other metrics. This measure isolates genuine per-share value by removing intangible assets of debatable liquidation worth. On the other hand, EPS is often distorted by mergers and flexible loan loss accounting. TBVPS provides clearer performance insights.
F.N.B. Corporation’s TBVPS grew at an excellent 8.5% annual clip over the last five years. TBVPS growth has also accelerated recently, growing by 12% annually over the last two years from $9.47 to $11.87 per share.
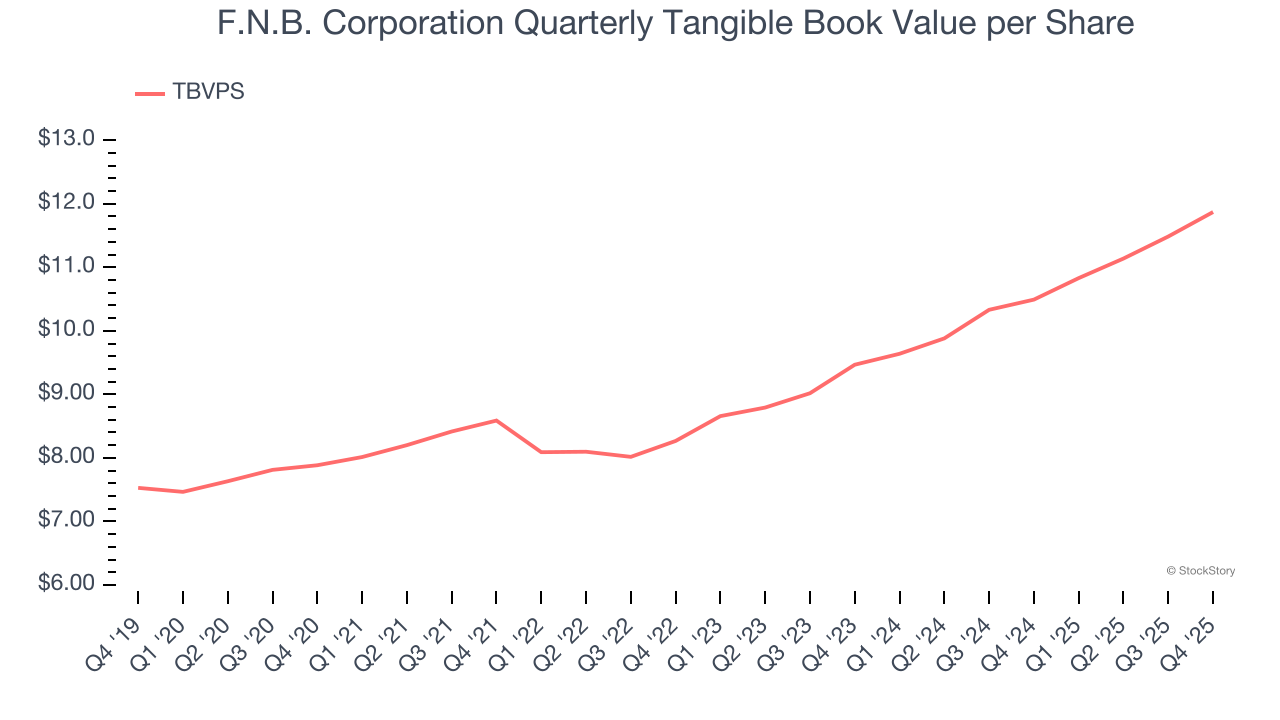
Over the next 12 months, Consensus estimates call for F.N.B. Corporation’s TBVPS to grow by 9.5% to $12.99, paltry growth rate.
Key Takeaways from F.N.B. Corporation’s Q4 Results
It was good to see F.N.B. Corporation beat analysts’ EPS expectations this quarter. We were also happy its tangible book value per share narrowly outperformed Wall Street’s estimates. On the other hand, its net interest income was in line. Overall, this print had some key positives. The stock traded up 1.9% to $17.60 immediately after reporting.
Sure, F.N.B. Corporation had a solid quarter, but if we look at the bigger picture, is this stock a buy? When making that decision, it’s important to consider its valuation, business qualities, as well as what has happened in the latest quarter. We cover that in our actionable full research report which you can read here (it’s free).