
Senior living provider The Pennant Group (NASDAQ: PNTG) announced better-than-expected revenue in Q3 CY2025, with sales up 26.8% year on year to $229 million. The company’s full-year revenue guidance of $930 million at the midpoint came in 3.5% above analysts’ estimates. Its non-GAAP profit of $0.30 per share was 4.6% above analysts’ consensus estimates.
Is now the time to buy The Pennant Group? Find out by accessing our full research report, it’s free for active Edge members.
The Pennant Group (PNTG) Q3 CY2025 Highlights:
- Revenue: $229 million vs analyst estimates of $222.3 million (26.8% year-on-year growth, 3% beat)
- Adjusted EPS: $0.30 vs analyst estimates of $0.29 (4.6% beat)
- Adjusted EBITDA: $17.35 million vs analyst estimates of $18.17 million (7.6% margin, 4.5% miss)
- The company lifted its revenue guidance for the full year to $930 million at the midpoint from $870.2 million, a 6.9% increase
- EBITDA guidance for the full year is $72.35 million at the midpoint, above analyst estimates of $71.74 million
- Operating Margin: 4.5%, down from 6% in the same quarter last year
- Sales Volumes fell 10.5% year on year (38.5% in the same quarter last year)
- Market Capitalization: $873.7 million
“In the third quarter we achieved record breaking performance in each of our segments, including all-time highs in senior living occupancy, hospice average daily census, and home health admissions,” said Brent Guerisoli, the Company’s Chief Executive Officer.
Company Overview
Spun off from The Ensign Group in 2019 to focus on non-skilled nursing healthcare services, Pennant Group (NASDAQ: PNTG) operates home health, hospice, and senior living facilities across 13 western and midwestern states, serving patients of all ages including seniors.
Revenue Growth
A company’s long-term performance is an indicator of its overall quality. Any business can put up a good quarter or two, but the best consistently grow over the long haul. Over the last five years, The Pennant Group grew its sales at an impressive 17.9% compounded annual growth rate. Its growth beat the average healthcare company and shows its offerings resonate with customers.
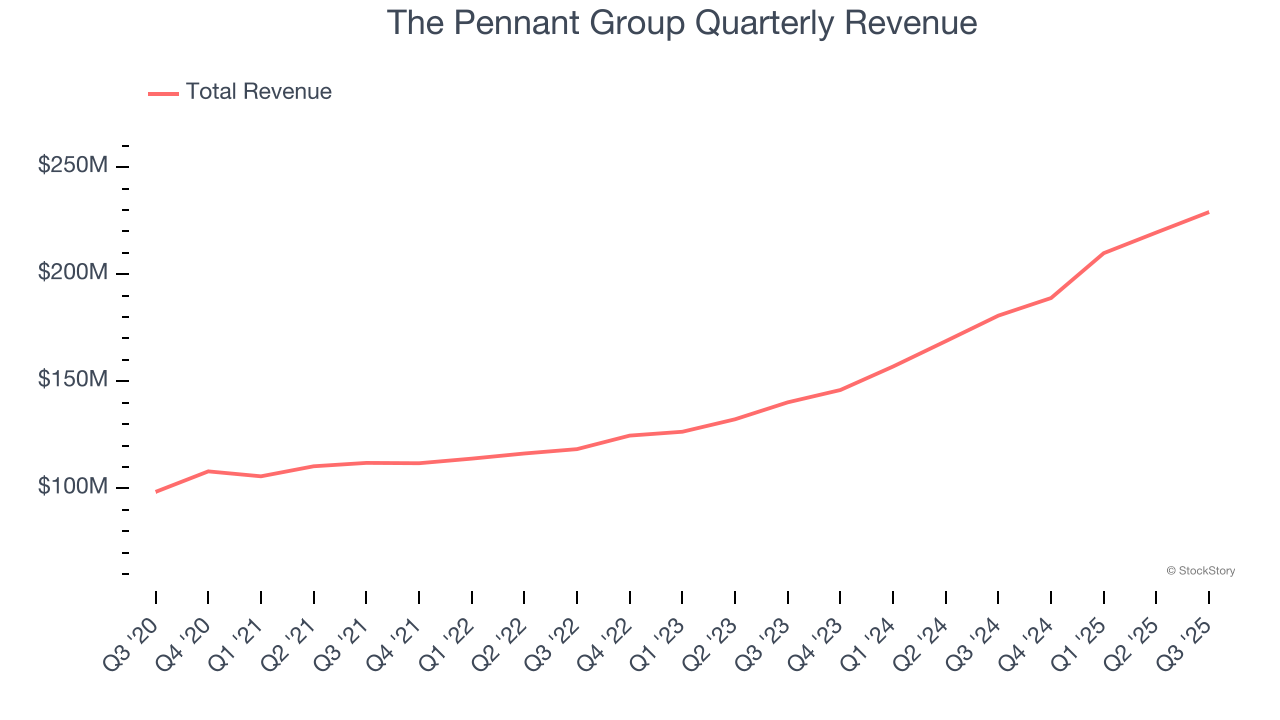
We at StockStory place the most emphasis on long-term growth, but within healthcare, a half-decade historical view may miss recent innovations or disruptive industry trends. The Pennant Group’s annualized revenue growth of 27.2% over the last two years is above its five-year trend, suggesting its demand was strong and recently accelerated. 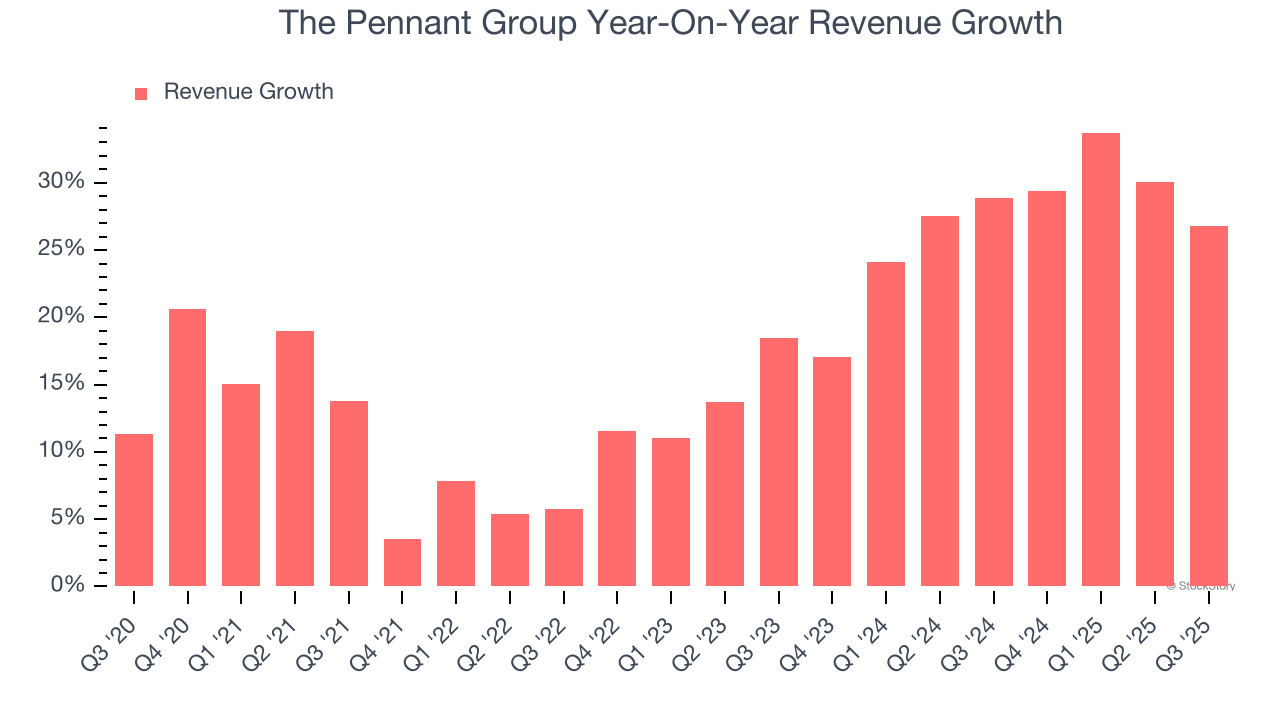
The Pennant Group also reports its number of admissions, which reached 13,423 in the latest quarter. Over the last two years, The Pennant Group’s admissions averaged 25.8% year-on-year growth. Because this number is in line with its revenue growth, we can see the company kept its prices fairly consistent. 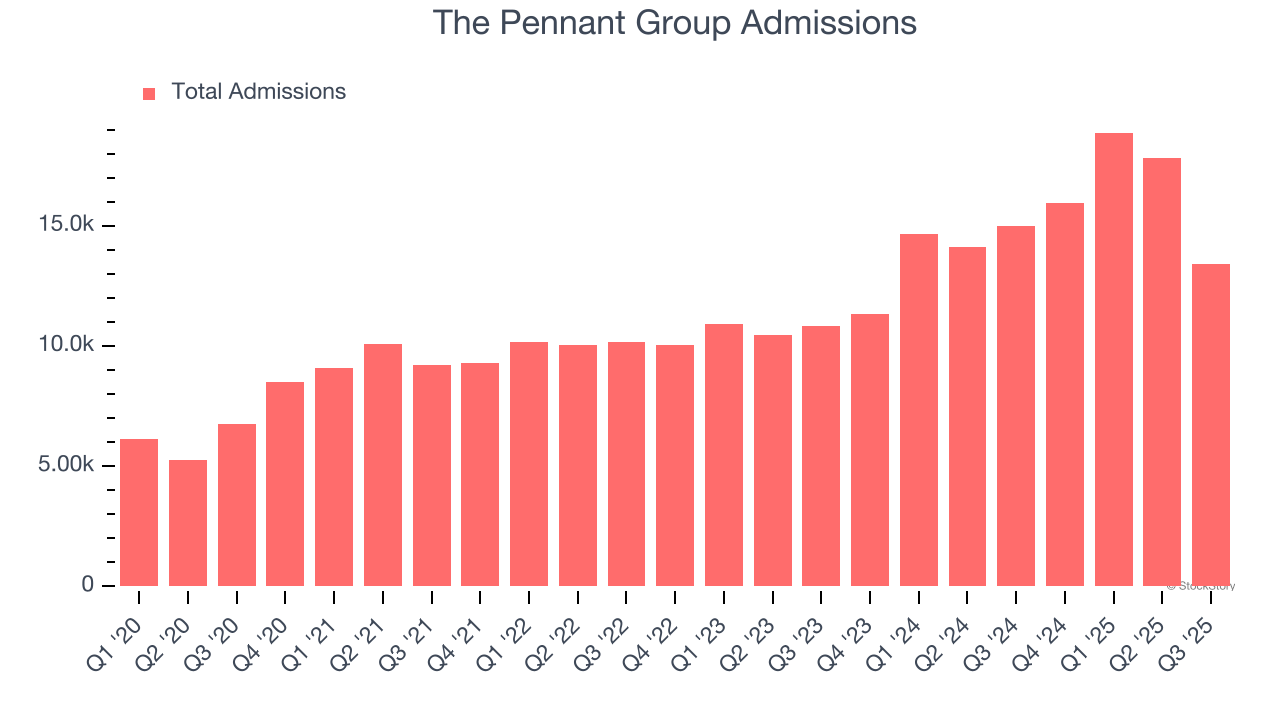
This quarter, The Pennant Group reported robust year-on-year revenue growth of 26.8%, and its $229 million of revenue topped Wall Street estimates by 3%.
Looking ahead, sell-side analysts expect revenue to grow 21.5% over the next 12 months, a deceleration versus the last two years. Despite the slowdown, this projection is commendable and indicates the market sees success for its products and services.
While Wall Street chases Nvidia at all-time highs, an under-the-radar semiconductor supplier is dominating a critical AI component these giants can’t build without. Click here to access our free report one of our favorites growth stories.
Operating Margin
The Pennant Group was profitable over the last five years but held back by its large cost base. Its average operating margin of 4.2% was weak for a healthcare business.
On the plus side, The Pennant Group’s operating margin rose by 2.6 percentage points over the last five years, as its sales growth gave it operating leverage.
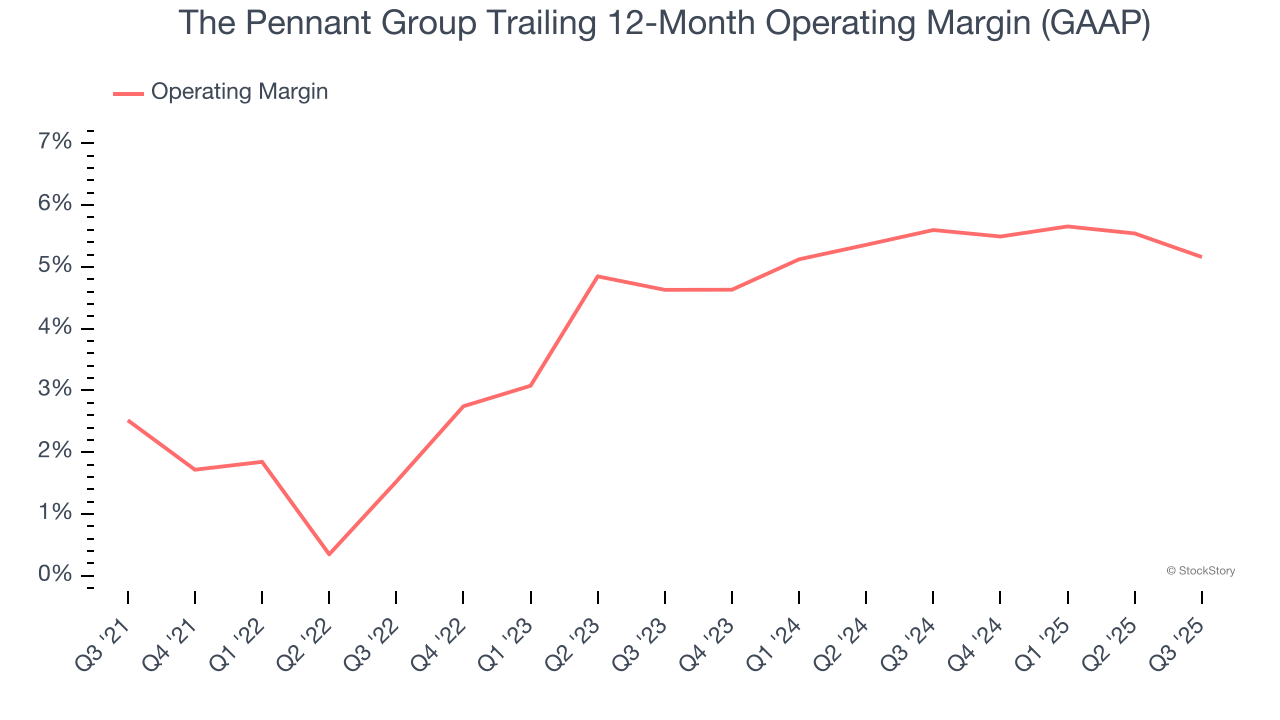
This quarter, The Pennant Group generated an operating margin profit margin of 4.5%, down 1.5 percentage points year on year. This reduction is quite minuscule and indicates the company’s overall cost structure has been relatively stable.
Earnings Per Share
Revenue trends explain a company’s historical growth, but the long-term change in earnings per share (EPS) points to the profitability of that growth – for example, a company could inflate its sales through excessive spending on advertising and promotions.
The Pennant Group’s EPS grew at a solid 7.8% compounded annual growth rate over the last five years. Despite its operating margin improvement during that time, this performance was lower than its 17.9% annualized revenue growth, telling us that non-fundamental factors such as interest and taxes affected its ultimate earnings.
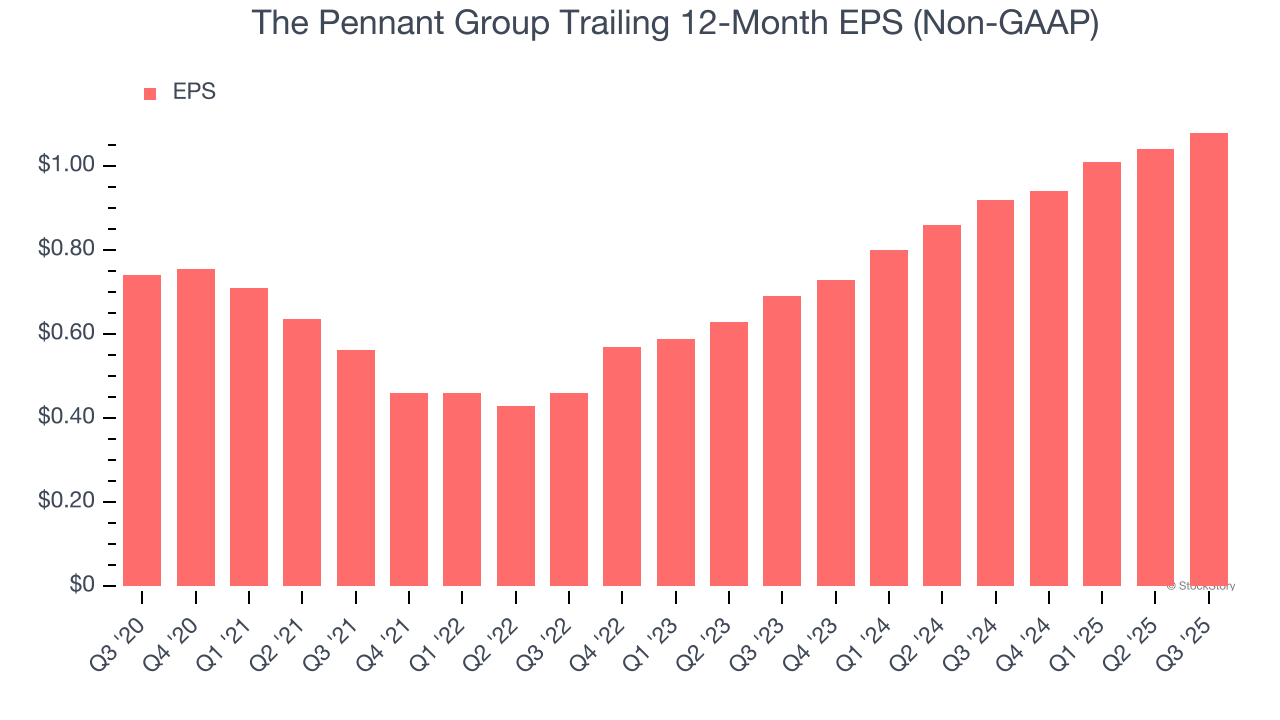
Diving into The Pennant Group’s quality of earnings can give us a better understanding of its performance. A five-year view shows The Pennant Group has diluted its shareholders, growing its share count by 16.6%. This dilution overshadowed its increased operational efficiency and has led to lower per share earnings. Taxes and interest expenses can also affect EPS but don’t tell us as much about a company’s fundamentals. 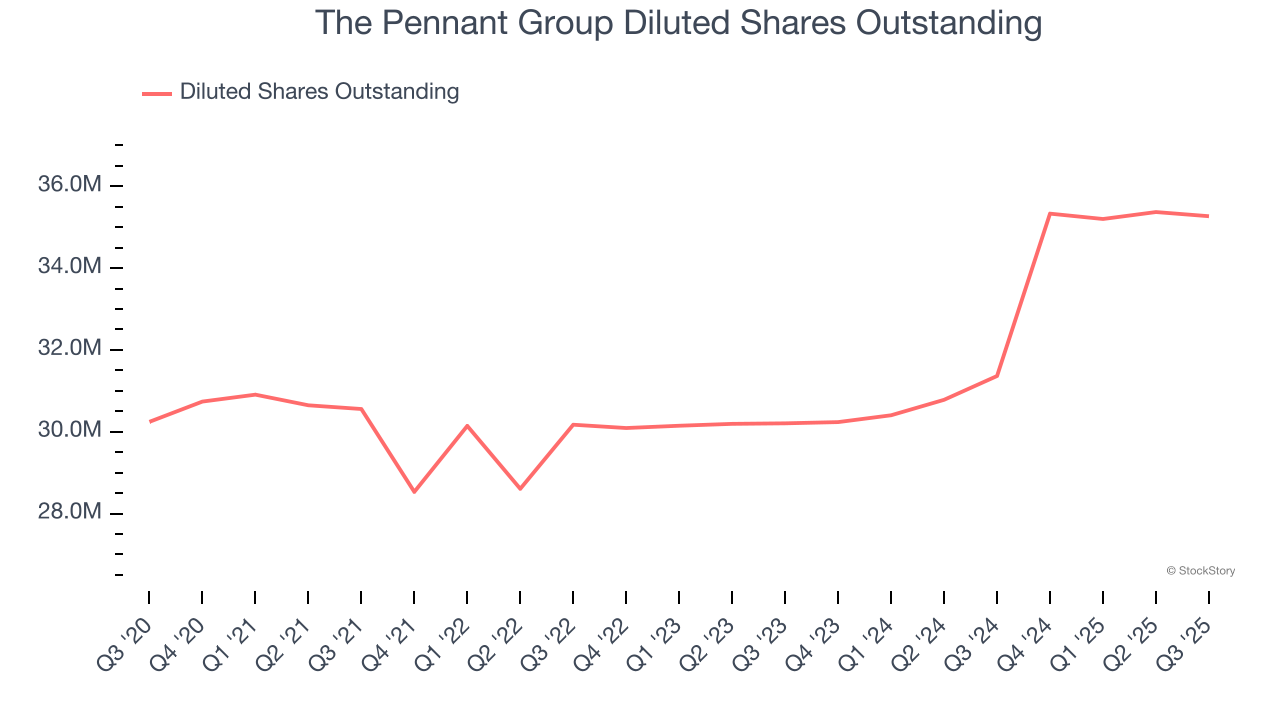
In Q3, The Pennant Group reported adjusted EPS of $0.30, up from $0.26 in the same quarter last year. This print beat analysts’ estimates by 4.6%. Over the next 12 months, Wall Street expects The Pennant Group’s full-year EPS of $1.08 to grow 18.2%.
Key Takeaways from The Pennant Group’s Q3 Results
We were impressed by The Pennant Group’s optimistic full-year revenue guidance, which blew past analysts’ expectations. We were also glad its revenue outperformed Wall Street’s estimates. Zooming out, we think this quarter featured some important positives. The stock remained flat at $25.17 immediately after reporting.
So do we think The Pennant Group is an attractive buy at the current price? If you’re making that decision, you should consider the bigger picture of valuation, business qualities, as well as the latest earnings. We cover that in our actionable full research report which you can read here, it’s free for active Edge members.