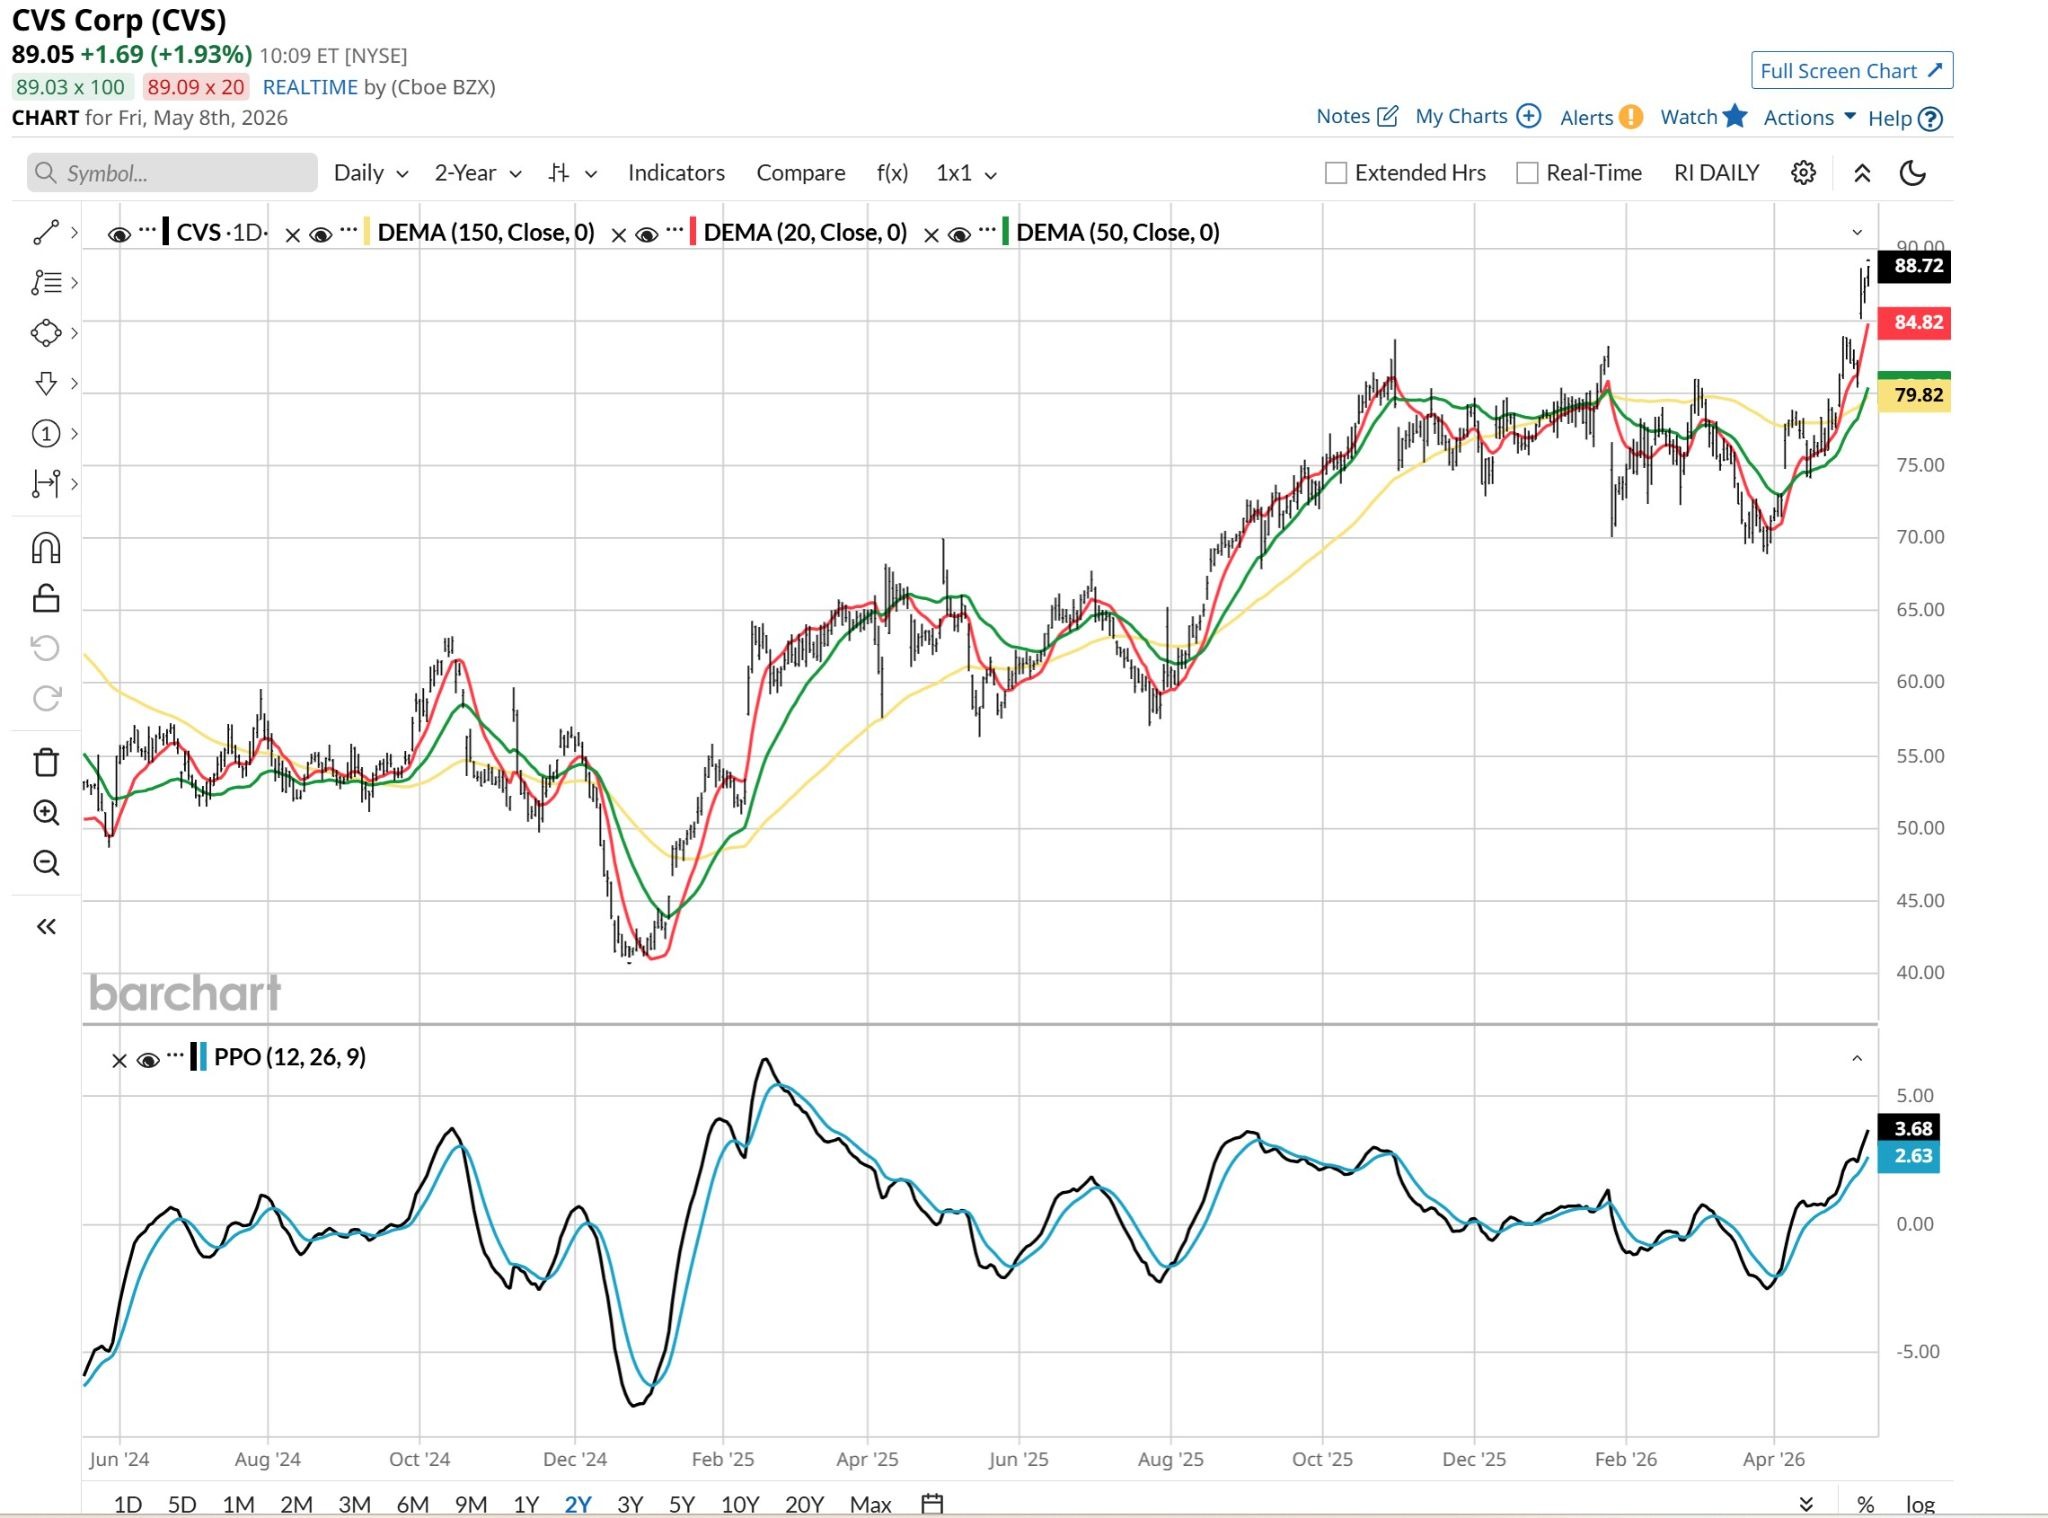
- CVS Health (CVS) shares have reclaimed their 50-day moving average and are challenging their all-time high around $95 following an eight-month consolidation period.
- The stock currently maintains a 72% “Buy” technical opinion from Barchart, signaling strong alignment across short, medium, and long-term timeframes. This level for that indicator has been a most reliable indicator of future stock strength for large caps recently.
- Technical momentum has accelerated sharply, with the stock gaining over 27% in the past month as it clears previous overhead resistance.
- Despite broader sector volatility, the charts show a consistent pattern of higher highs and higher lows, suggesting a bullish near-term path for investors.
Today’s Featured Stock
Valued at $112 billion, CVS Health (CVS) is a leading healthcare services company that operates through healthcare benefits, pharmacy services, and retail pharmacy segments.
What I’m Watching
I found today’s Chart of the Day by using Barchart’s powerful screening functions to sort for stocks with notably improving technicals, a combination of momentum, strength, and direction. I then used Barchart’s Flipcharts feature to review the charts for timely opportunities. CVS checks those boxes.
CVS has rallied from its recent low around $70 at the end of March. Its 20-day moving average is strong, as is its 50-day moving average, which turned positive recently. The PPO indicator is solidly in positive territory and continues to trend upward, a sign of increasing momentum. After breaking out from its prior base, the stock is showing clear technical leadership within its industry group. In a market that looks better “on paper” than it does at the single stock level, CVS looks to finally be more of a leader than a laggard.
Barchart Technical Indicators for CVS Health
Editor’s Note: The technical indicators below are updated live during the session every 20 minutes and can therefore change each day as the market fluctuates. The indicator numbers shown below therefore may not match what you see live on the Barchart.com website when you read this report.
- 72% Buy Barchart Opinion: The stock currently has a unanimous buy signal across all three Barchart technical timeframes. It was graded 24% Buy a month ago, indicating a bullish trend.
- Trend Seeker Buy: This proprietary trend-following indicator is intact, confirming the bullish price action seen over the last month.
- Support levels exist in the $85-$86 area.
- The stock hit a trader’s radar when it finally broke above multi-month resistance around $82 earlier this month.
Don’t Forget the Fundamentals
- $112.39 billion market capitalization.
- 12x price-earnings ratio, both on a trailing and forward basis.
- 0.9 price/earnings-growth (PEG) ratio, a rare fundamental feat in this market climate.
- 5-year revenue growth of 50%.
Analyst and Investor Sentiment on CVS Health
- Wall Street Analysts: A consensus of 24 analysts surveyed by Barchart rate CVS a “Strong Buy” with 22 of those being “Buy” ratings.
- Price Targets: 12-month targets range from a conservative $85 to a high of $105, with an average consensus near $95.
The Bottom Line on CVS Health
CVS Health is currently firing on all cylinders technically, having successfully navigated a period of consolidation before breaking out to new annual highs. The stock’s combination of a low P/E ratio and strong technical momentum makes it a compelling candidate for further upside.
While the healthcare sector faces ongoing regulatory scrutiny, CVS’s robust cash flows and high technical buy signals suggest a decidedly bullish outlook for the coming months.
On the date of publication, Jim Van Meerten did not have (either directly or indirectly) positions in any of the securities mentioned in this article. All information and data in this article is solely for informational purposes. For more information please view the Barchart Disclosure Policy here.
More news from Barchart