
Global financial services firm Morgan Stanley (NYSE: MS) beat Wall Street’s revenue expectations in Q2 CY2026, with sales up 27.1% year on year to $21.35 billion. Its GAAP profit of $3.46 per share was 17.9% above analysts’ consensus estimates.
Is now the time to buy Morgan Stanley? Find out by accessing our full research report, it’s free.
Morgan Stanley (MS) Q2 CY2026 Highlights:
- Revenue: $21.35 billion vs analyst estimates of $19.63 billion (27.1% year-on-year growth, 8.7% beat)
- Efficiency Ratio: 65% vs analyst estimates of 67.9% (288 basis point beat)
- EPS (GAAP): $3.46 vs analyst estimates of $2.93 (17.9% beat)
- Tangible Book Value per Share: $53.18 vs analyst estimates of $52.78 (12.6% year-on-year growth, 0.8% beat)
- Market Capitalization: $359.1 billion
Company Overview
Founded in 1924 during the post-WWI economic boom by former JP Morgan partners, Morgan Stanley (NYSE: MS) is a global financial services firm that provides investment banking, wealth management, and investment management services to corporations, governments, institutions, and individuals.
Revenue Growth
A company’s long-term sales performance is one signal of its overall quality. Even a bad business can shine for one or two quarters, but a top-tier one grows for years. Regrettably, Morgan Stanley’s revenue grew at a mediocre 6.9% compounded annual growth rate over the last five years. This fell short of our benchmark for the financials sector and is a tough starting point for our analysis.
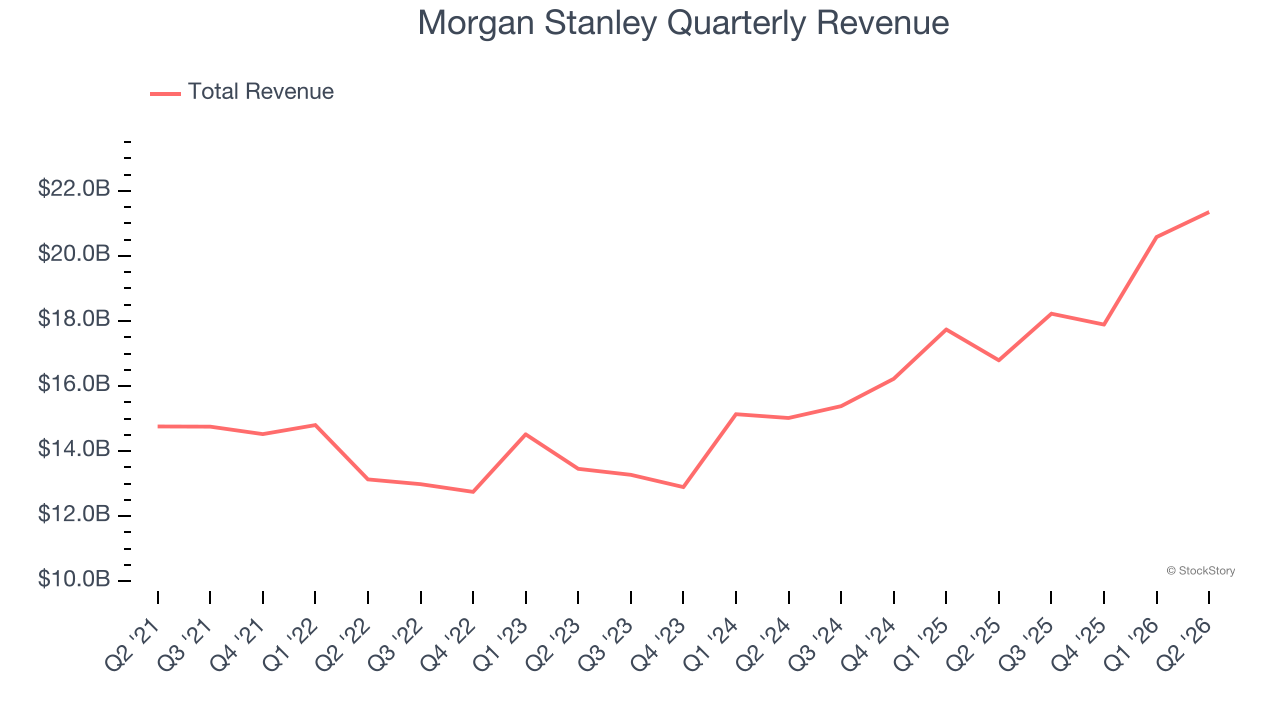
Long-term growth is the most important, but within financials, a half-decade historical view may miss recent interest rate changes and market returns. Morgan Stanley’s annualized revenue growth of 17.7% over the last two years is above its five-year trend, suggesting its demand recently accelerated. 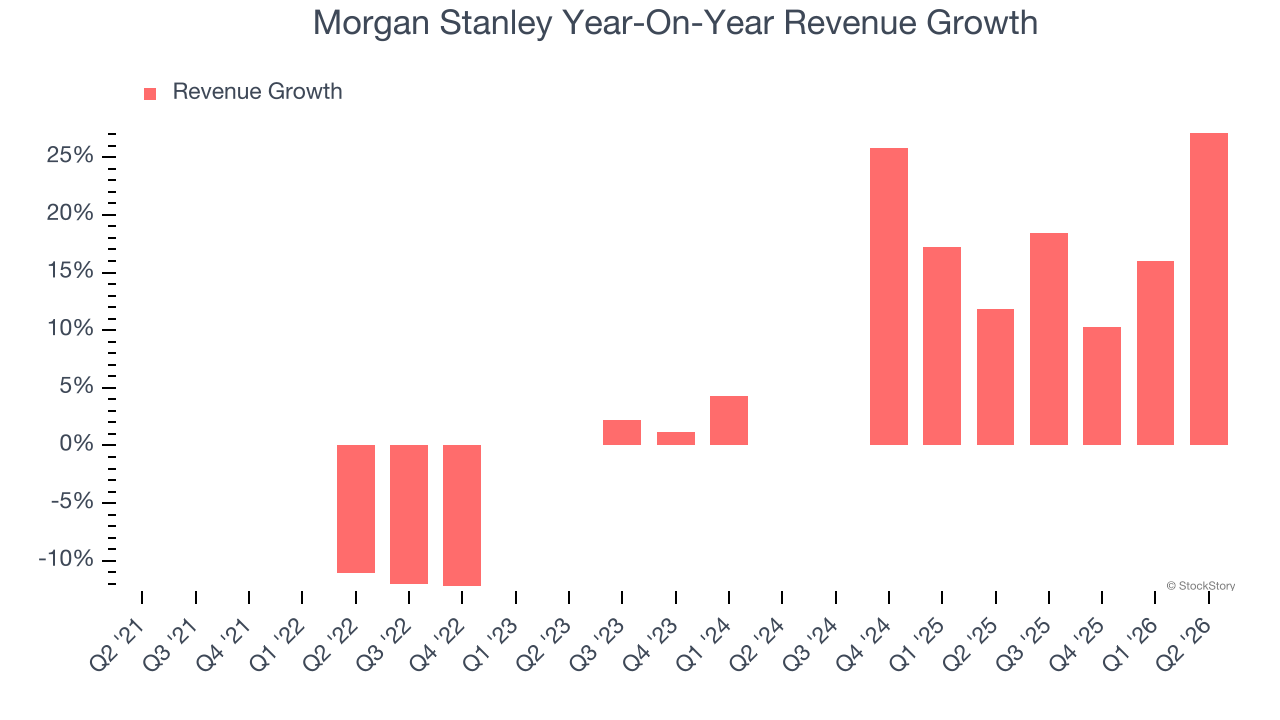 Note: Quarters not shown were determined to be outliers because they were impacted by outsized investment gains/losses that are not indicative of the recurring fundamentals of the business.
This quarter, Morgan Stanley reported robust year-on-year revenue growth of 27.1%, and its $21.35 billion of revenue topped Wall Street estimates by 8.7%.
WHILE YOU’RE HERE: The Next Palantir? One satellite company captures images of every point on Earth. Every single day. The Pentagon wants it. Hedge funds are using it to beat earnings. You’ve probably never heard of it.
This is what the early days of Palantir looked like before it became a giant. Same playbook. Different technology. If you missed Palantir, you need to see this. Claim The Stock Ticker for Free HERE.
Tangible Book Value Per Share (TBVPS)
Financial firms profit by providing a wide range of services, making them fundamentally balance sheet-driven enterprises with multiple intermediation roles. Market participants emphasize balance sheet quality and sustained book value growth when evaluating these multifaceted institutions.
This is why we consider tangible book value per share (TBVPS) an important metric for the sector. TBVPS represents the real net worth per share across all business segments, providing a clear measure of shareholder equity regardless of the complexity of operations. Other (and more commonly known) per-share metrics like EPS can sometimes be murky due to the complexity of multiple business lines, M&A activity, or accounting rules that vary across different financial services segments.
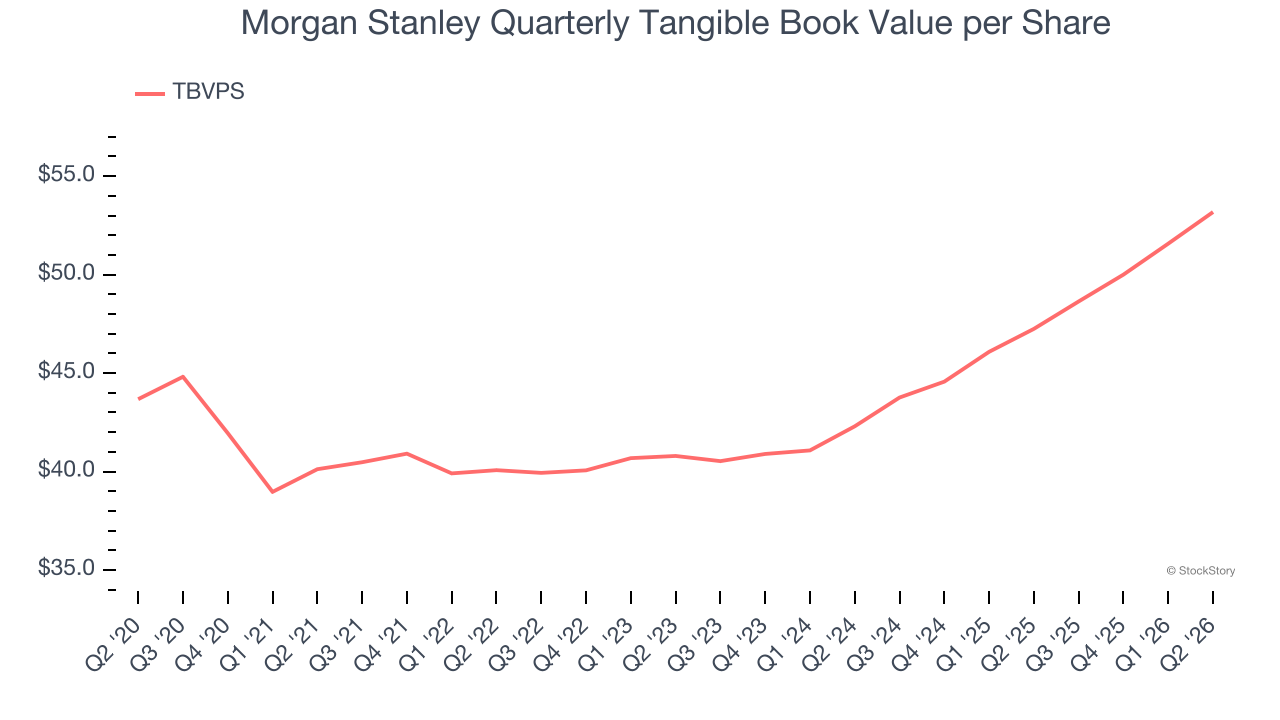
Morgan Stanley’s TBVPS grew at a tepid 5.8% annual clip over the last five years. However, TBVPS growth has accelerated recently, growing by 12.1% annually over the last two years from $42.30 to $53.18 per share.
Tangible Book Value Per Share (TBVPS)
The balance sheet drives profitability for financial firms since earnings flow from managing diverse assets and liabilities across multiple business lines. As such, valuations for these companies concentrate on capital strength and sustainable equity accumulation potential across their varied operations.
This explains why tangible book value per share (TBVPS) is a premier metric for the sector. TBVPS provides concrete per-share net worth that investors can trust when evaluating companies with complex, multi-faceted business models. Traditional metrics like EPS are helpful but face distortion from the complexity of diversified operations, M&A activity, and various accounting rules that can obscure true performance across multiple business lines.
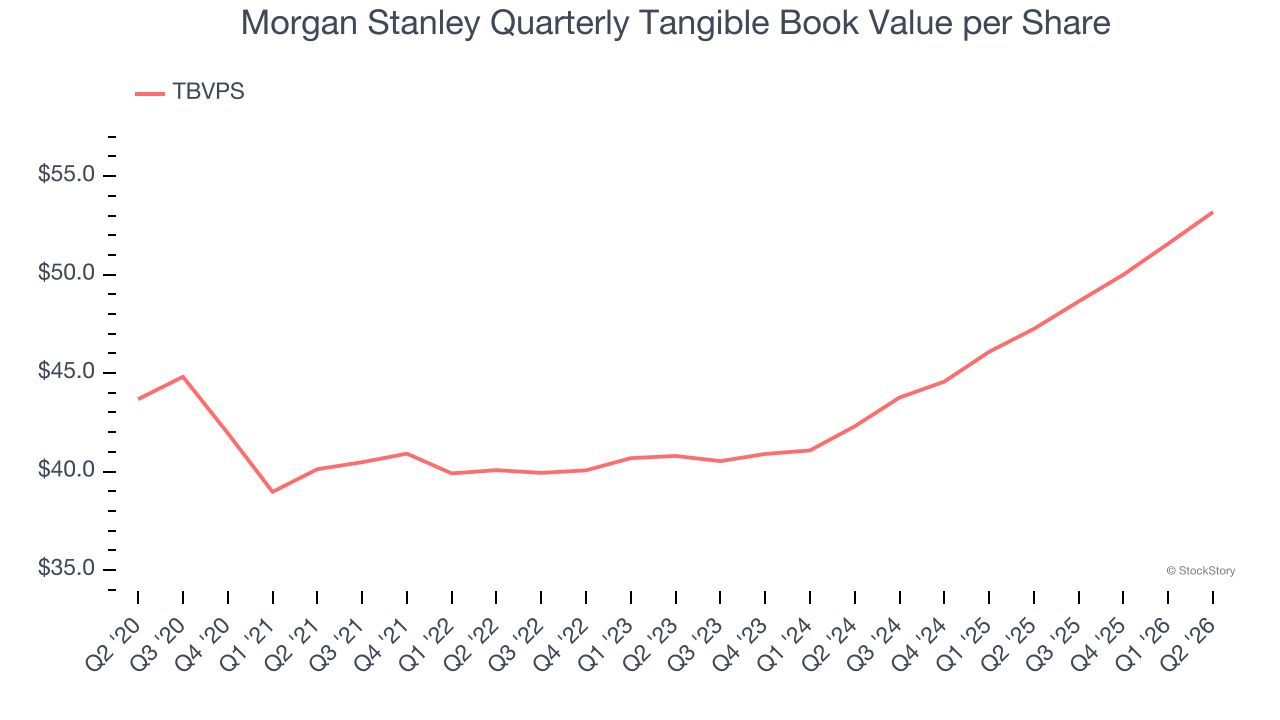
Morgan Stanley’s TBVPS grew at a tepid 5.8% annual clip over the last five years. However, TBVPS growth has accelerated recently, growing by 12.1% annually over the last two years from $42.30 to $53.18 per share.
Key Takeaways from Morgan Stanley’s Q2 Results
We were impressed by how significantly Morgan Stanley blew past analysts’ revenue expectations this quarter. We were also glad its EPS outperformed Wall Street’s estimates. Zooming out, we think this quarter featured some important positives. The stock traded up 1.4% to $231.30 immediately following the results.
Morgan Stanley put up rock-solid earnings, but one quarter doesn’t necessarily make the stock a buy. Let’s see if this is a good investment. If you’re making that decision, you should consider the bigger picture of valuation, business qualities, as well as the latest earnings. We cover that in our actionable full research report which you can read here (it’s free).