
Medical device company DexCom (NASDAQ: DXCM) reported Q1 CY2026 results exceeding the market’s revenue expectations, with sales up 15% year on year to $1.19 billion. The company expects the full year’s revenue to be around $5.21 billion, close to analysts’ estimates. Its non-GAAP profit of $0.56 per share was 19% above analysts’ consensus estimates.
Is now the time to buy DexCom? Find out by accessing our full research report, it’s free.
DexCom (DXCM) Q1 CY2026 Highlights:
- Revenue: $1.19 billion vs analyst estimates of $1.18 billion (15% year-on-year growth, 1.4% beat)
- Adjusted EPS: $0.56 vs analyst estimates of $0.47 (19% beat)
- Adjusted EBITDA: $364.5 million vs analyst estimates of $314.4 million (30.6% margin, 15.9% beat)
- The company reconfirmed its revenue guidance for the full year of $5.21 billion at the midpoint
- Operating Margin: 21.4%, up from 12.9% in the same quarter last year
- Organic Revenue rose 12% year on year (miss)
- Market Capitalization: $22.21 billion
Company Overview
Founded in 1999 and receiving its first FDA approval in 2006, DexCom (NASDAQ: DXCM) develops and sells continuous glucose monitoring systems that allow people with diabetes to track their blood sugar levels without repeated finger pricks.
Revenue Growth
A company’s long-term sales performance is one signal of its overall quality. Any business can experience short-term success, but top-performing ones enjoy sustained growth for years. Luckily, DexCom’s sales grew at an impressive 18.9% compounded annual growth rate over the last five years. Its growth surpassed the average healthcare company and shows its offerings resonate with customers, a great starting point for our analysis.
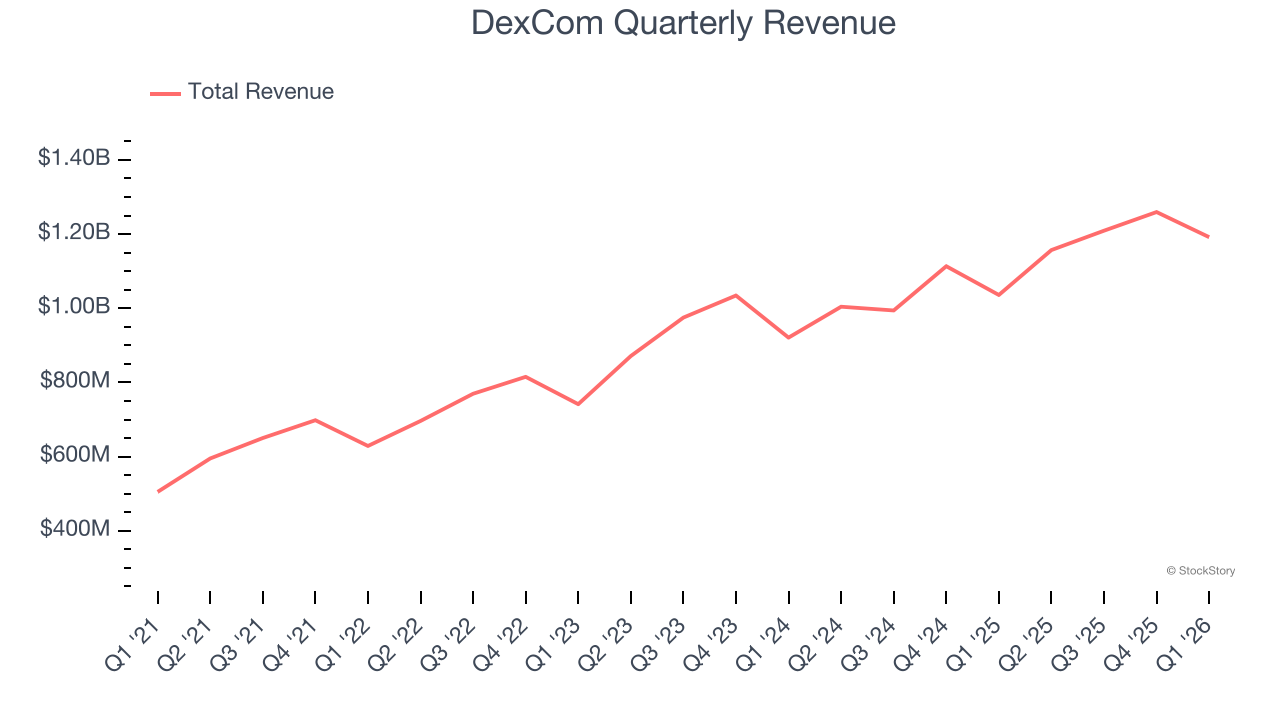
We at StockStory place the most emphasis on long-term growth, but within healthcare, a half-decade historical view may miss recent innovations or disruptive industry trends. DexCom’s annualized revenue growth of 12.6% over the last two years is below its five-year trend, but we still think the results suggest healthy demand. 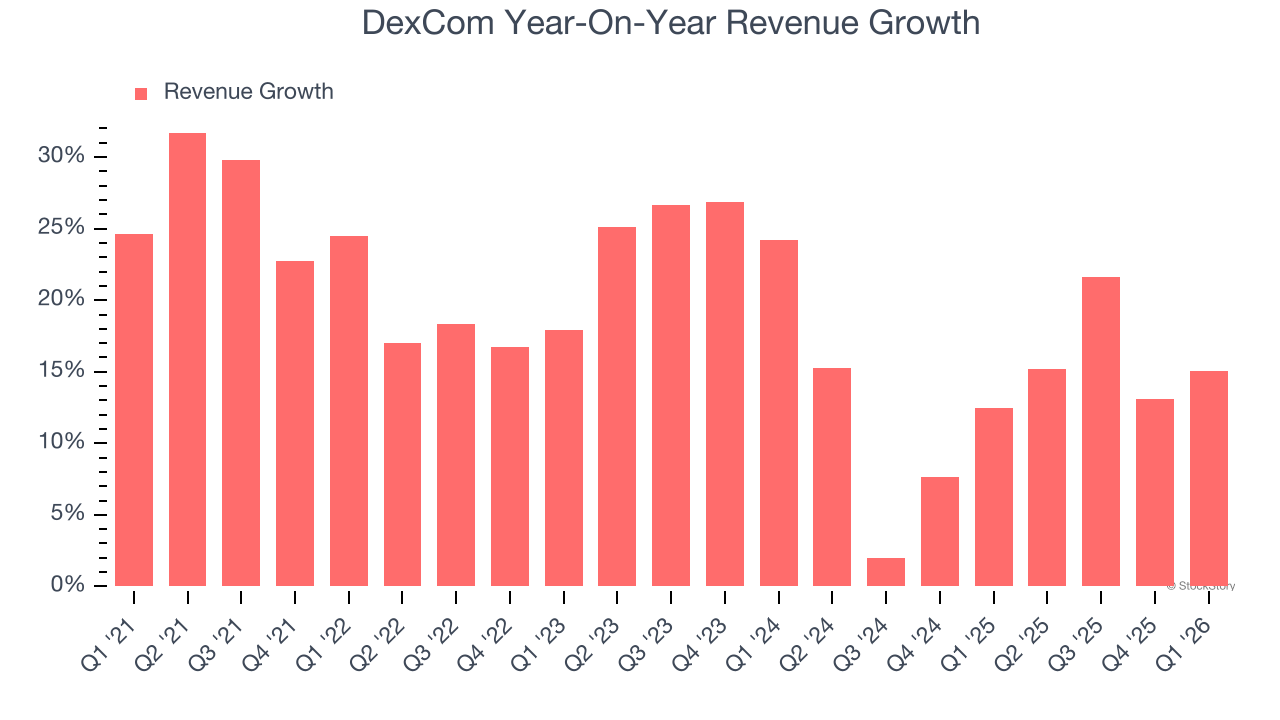
We can better understand the company’s sales dynamics by analyzing its organic revenue, which strips out one-time events like acquisitions and currency fluctuations that don’t accurately reflect its fundamentals. Over the last two years, DexCom’s organic revenue averaged 12.5% year-on-year growth. Because this number aligns with its two-year revenue growth, we can see the company’s core operations (not acquisitions and divestitures) drove most of its results. 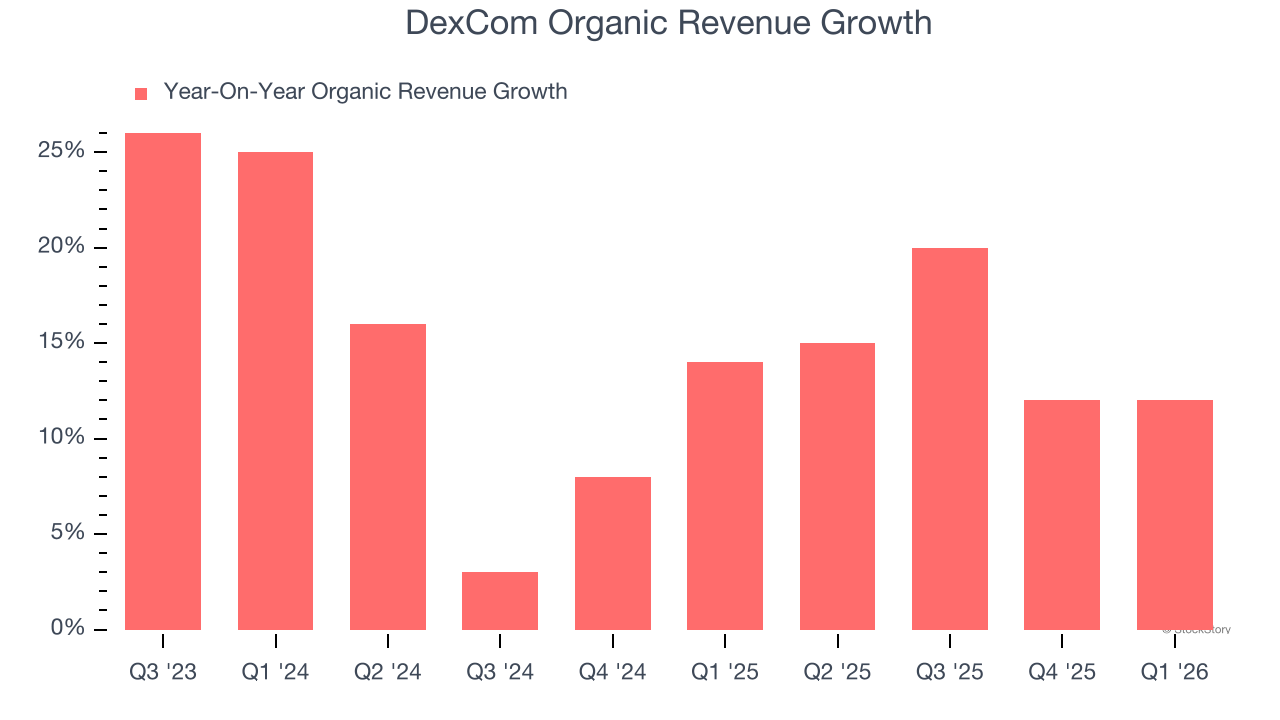
This quarter, DexCom reported year-on-year revenue growth of 15%, and its $1.19 billion of revenue exceeded Wall Street’s estimates by 1.4%.
Looking ahead, sell-side analysts expect revenue to grow 11.5% over the next 12 months, similar to its two-year rate. Still, this projection is healthy and indicates the market sees success for its products and services.
ALSO WORTH WATCHING: Nvidia’s Quiet Partner. Nvidia’s chips cost a hundred grand. The connectors that make them work cost even more. One company makes them all.
Every AI server needs specialized infrastructure the chip companies don’t make. High-speed cables. Power connectors. Thermal sensors. This 90-year-old company built a monopoly on it. The AI boom just started. This stock is still flying under the radar. Claim The Stock Ticker Here for FREE.
Adjusted Operating Margin
DexCom has managed its cost base well over the last five years. It demonstrated solid profitability for a healthcare business, producing an average adjusted operating margin of 18.9%.
Looking at the trend in its profitability, DexCom’s adjusted operating margin rose by 12.2 percentage points over the last five years, as its sales growth gave it operating leverage. Zooming in on its more recent performance, we can see the company’s trajectory is intact as its margin has also increased by 2.8 percentage points on a two-year basis. These data points are very encouraging and show momentum is on its side.
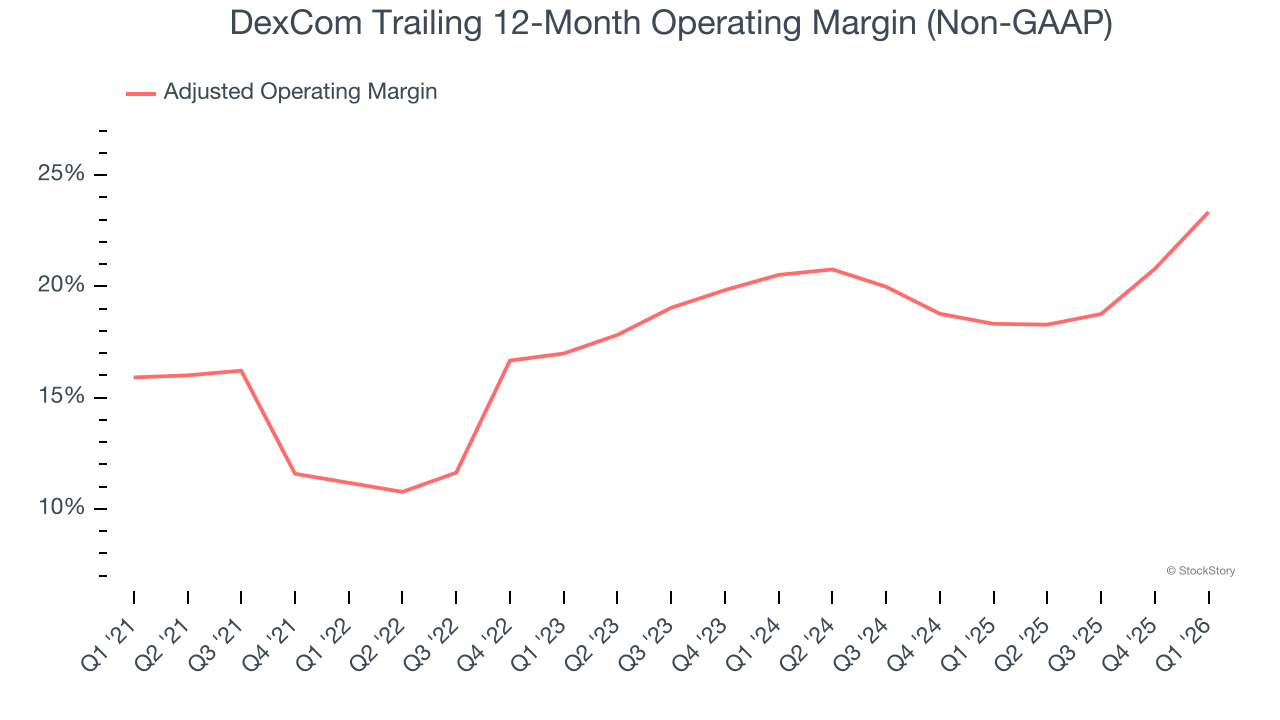
In Q1, DexCom generated an adjusted operating margin profit margin of 25.1%, up 11.2 percentage points year on year. This increase was a welcome development and shows it was more efficient.
Earnings Per Share
We track the long-term change in earnings per share (EPS) for the same reason as long-term revenue growth. Compared to revenue, however, EPS highlights whether a company’s growth is profitable.
DexCom’s EPS grew at 25.7% compounded annual growth rate over the last five years, higher than its 18.9% annualized revenue growth. This tells us the company became more profitable on a per-share basis as it expanded.
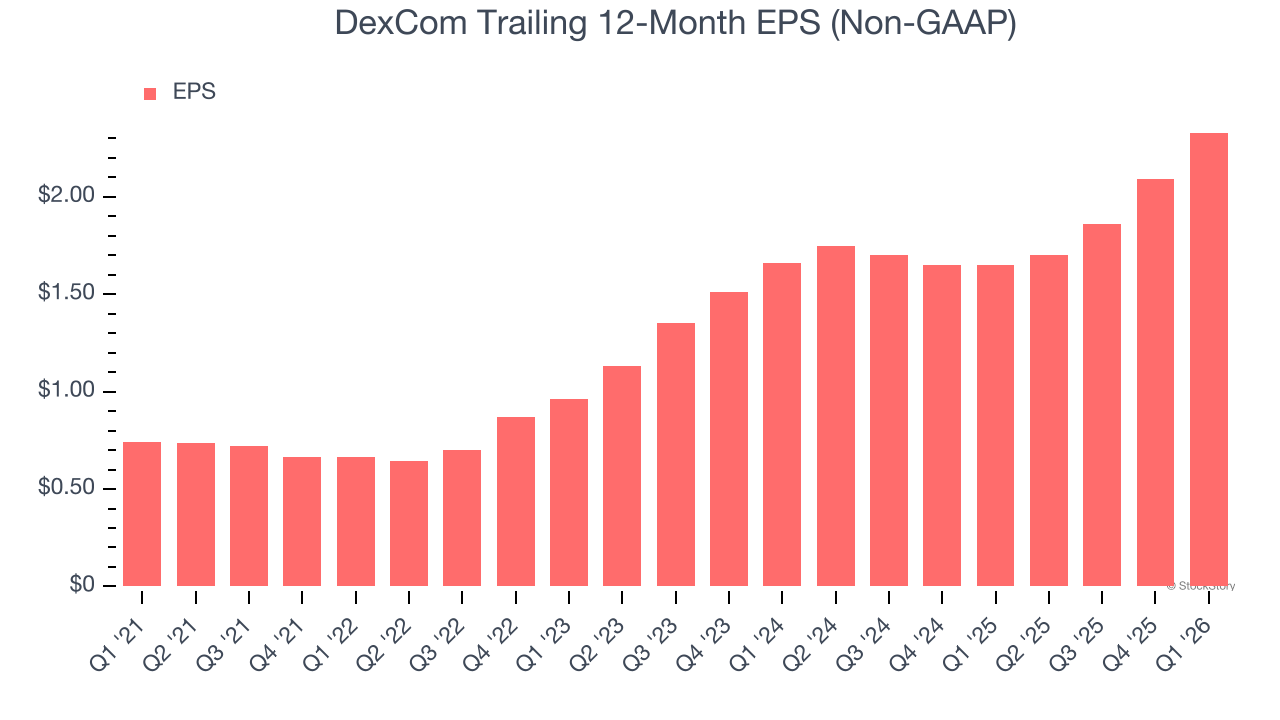
Diving into DexCom’s quality of earnings can give us a better understanding of its performance. As we mentioned earlier, DexCom’s adjusted operating margin expanded by 12.2 percentage points over the last five years. On top of that, its share count shrank by 5.9%. These are positive signs for shareholders because improving profitability and share buybacks turbocharge EPS growth relative to revenue growth. 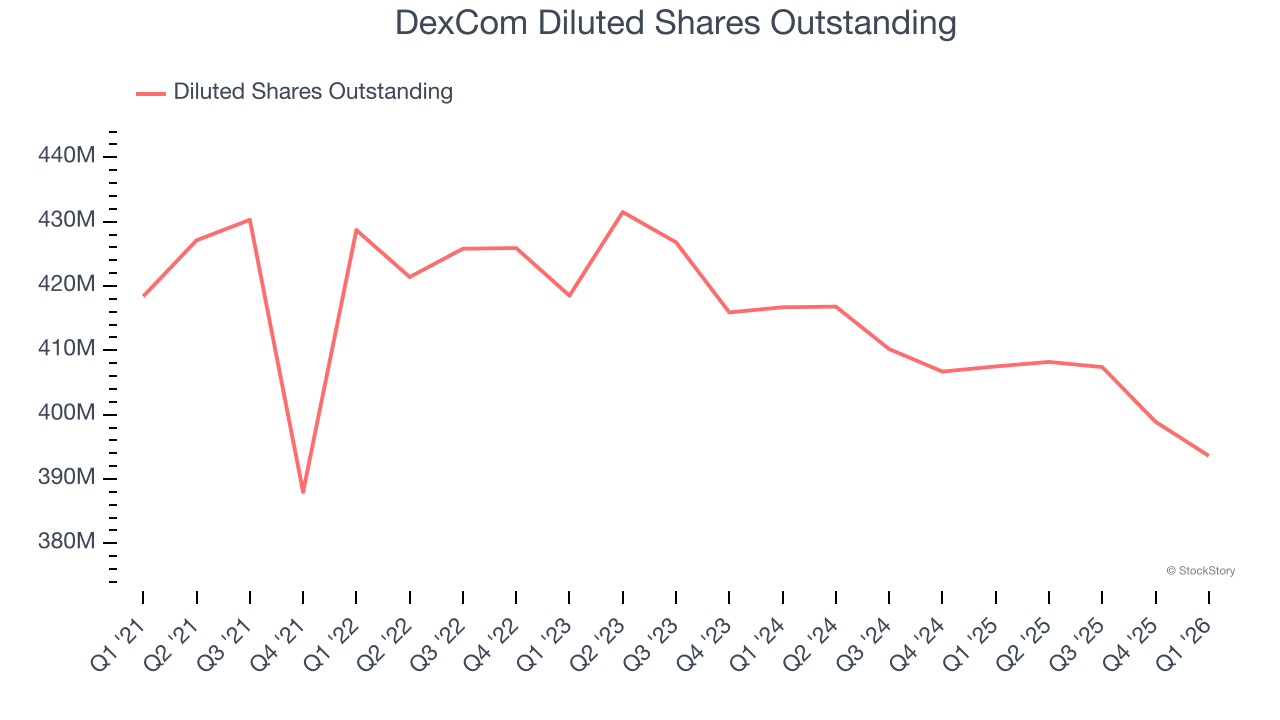
In Q1, DexCom reported adjusted EPS of $0.56, up from $0.32 in the same quarter last year. This print easily cleared analysts’ estimates, and shareholders should be content with the results. Over the next 12 months, Wall Street expects DexCom’s full-year EPS of $2.33 to grow 12%.
Key Takeaways from DexCom’s Q1 Results
It was good to see DexCom beat analysts’ EPS expectations this quarter. We were also happy its revenue narrowly outperformed Wall Street’s estimates. On the other hand, its organic revenue slightly missed and its full-year revenue guidance was in line with Wall Street’s estimates. Overall, this print was mixed but still had some key positives. Investors were likely hoping for more, and shares traded down 6.3% to $55.75 immediately after reporting.
Is DexCom an attractive investment opportunity right now? When making that decision, it’s important to consider its valuation, business qualities, as well as what has happened in the latest quarter. We cover that in our actionable full research report which you can read here (it’s free).