

Ceiling and wall solutions company Armstrong World Industries (NYSE: AWI) met Wall Street’s revenue expectations in Q1 CY2026, with sales up 7.1% year on year to $409.9 million. The company’s outlook for the full year was close to analysts’ estimates with revenue guided to $1.77 billion at the midpoint. Its non-GAAP profit of $1.69 per share was 6.4% below analysts’ consensus estimates.
Is now the time to buy Armstrong World? Find out by accessing our full research report, it’s free.
Armstrong World (AWI) Q1 CY2026 Highlights:
- Revenue: $409.9 million vs analyst estimates of $410.4 million (7.1% year-on-year growth, in line)
- Adjusted EPS: $1.69 vs analyst expectations of $1.81 (6.4% miss)
- Adjusted EBITDA: $130 million vs analyst estimates of $138.5 million (31.7% margin, 6.1% miss)
- The company reconfirmed its revenue guidance for the full year of $1.77 billion at the midpoint
- Management raised its full-year Adjusted EPS guidance to $8.30 at the midpoint, a 1.2% increase
- EBITDA guidance for the full year is $610 million at the midpoint, below analyst estimates of $613.8 million
- Operating Margin: 23%, down from 25.7% in the same quarter last year
- Free Cash Flow Margin: 11.5%, up from 5.7% in the same quarter last year
- Market Capitalization: $7.61 billion
"We delivered solid topline growth this quarter, driven by Mineral Fiber AUV and higher volumes, along with double-digit sales growth in Architectural Specialties," said AWI President and CEO, Mark Hershey.
Company Overview
Started as a two-man shop dating back to the 1860s, Armstrong (NYSE: AWI) provides ceiling and wall products to commercial and residential spaces.
Revenue Growth
A company’s long-term sales performance is one signal of its overall quality. Even a bad business can shine for one or two quarters, but a top-tier one grows for years. Luckily, Armstrong World’s sales grew at an impressive 11.9% compounded annual growth rate over the last five years. Its growth surpassed the average industrials company and shows its offerings resonate with customers, a great starting point for our analysis.
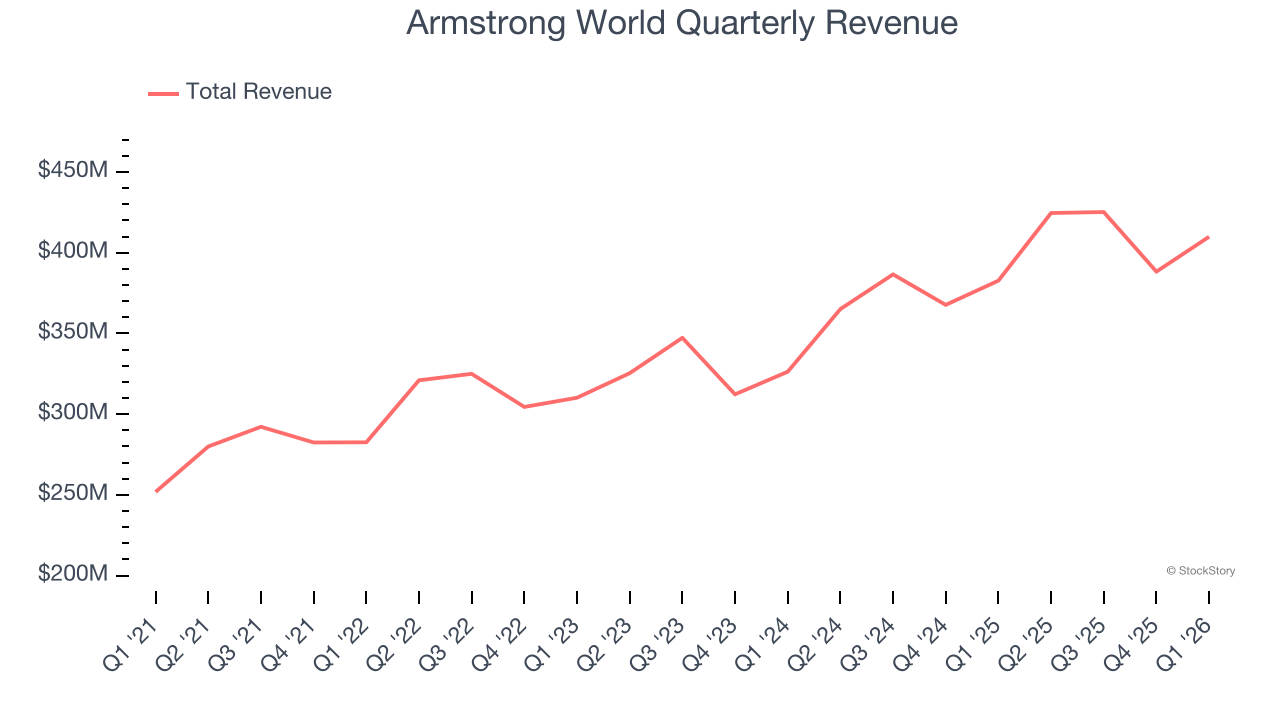
Long-term growth is the most important, but within industrials, a half-decade historical view may miss new industry trends or demand cycles. Armstrong World’s annualized revenue growth of 12.1% over the last two years aligns with its five-year trend, suggesting its demand was predictably strong. 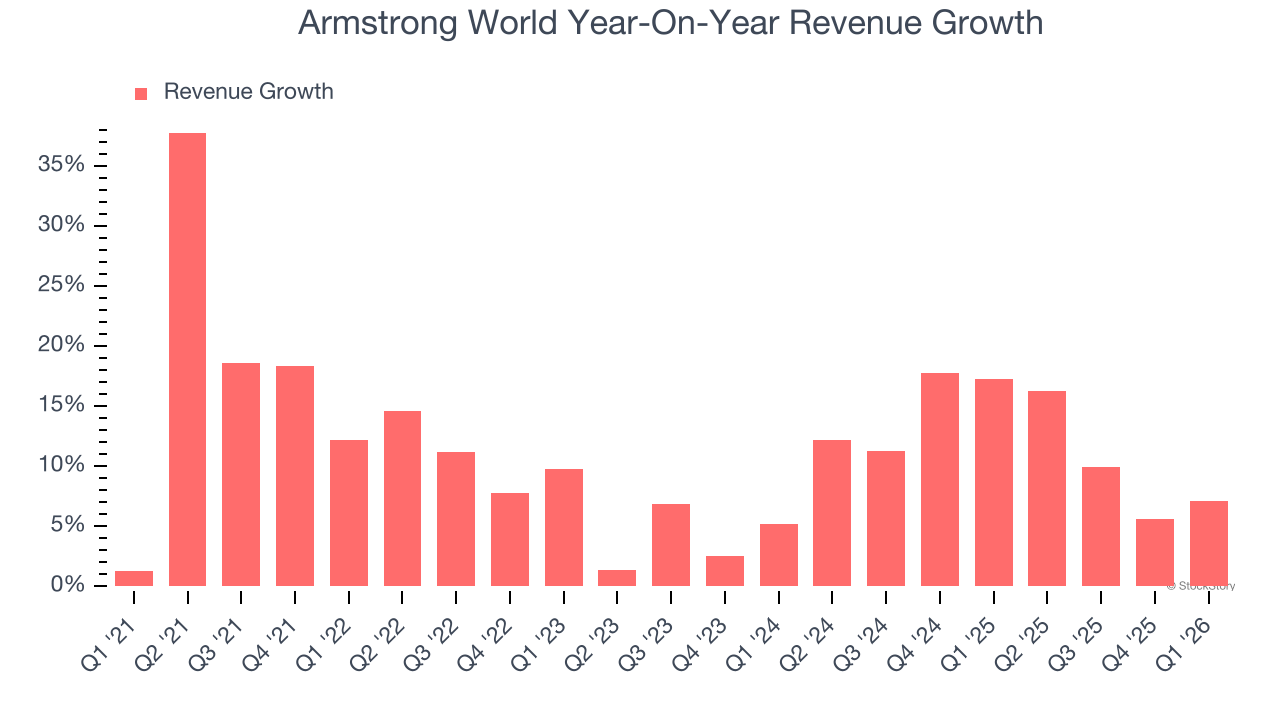
This quarter, Armstrong World grew its revenue by 7.1% year on year, and its $409.9 million of revenue was in line with Wall Street’s estimates.
Looking ahead, sell-side analysts expect revenue to grow 9.6% over the next 12 months, a slight deceleration versus the last two years. Despite the slowdown, this projection is admirable and suggests the market is forecasting success for its products and services.
ONE MORE THING: The $21 AI Application Stock Wall Street Forgot. While Wall Street obsesses over who’s building AI, one company is already using it to print money. And nobody’s paying attention.
AI chip stocks trade at ridiculous valuations. This company processes a trillion consumer signals monthly using AI and trades at a third of the price. The gap won’t last. The institutions will figure it out. You need to see this first. Read the FREE Report Before They Notice.
Operating Margin
Operating margin is an important measure of profitability as it shows the portion of revenue left after accounting for all core expenses – everything from the cost of goods sold to advertising and wages. It’s also useful for comparing profitability across companies with different levels of debt and tax rates because it excludes interest and taxes.
Armstrong World has been a well-oiled machine over the last five years. It demonstrated elite profitability for an industrials business, boasting an average operating margin of 24.9%. This result isn’t surprising as its high gross margin gives it a favorable starting point.
Analyzing the trend in its profitability, Armstrong World’s operating margin rose by 2.2 percentage points over the last five years, as its sales growth gave it operating leverage.
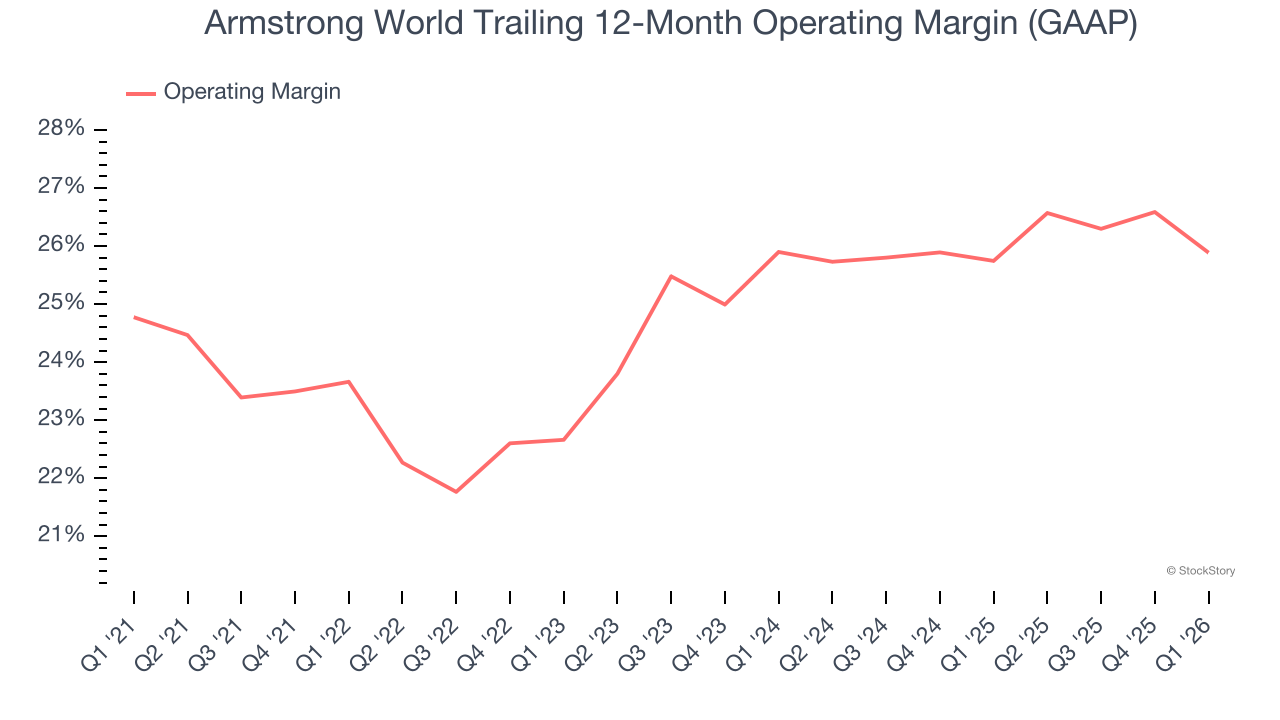
In Q1, Armstrong World generated an operating margin profit margin of 23%, down 2.8 percentage points year on year. Since Armstrong World’s operating margin decreased more than its gross margin, we can assume it was less efficient because expenses such as marketing, R&D, and administrative overhead increased.
Earnings Per Share
Revenue trends explain a company’s historical growth, but the long-term change in earnings per share (EPS) points to the profitability of that growth – for example, a company could inflate its sales through excessive spending on advertising and promotions.
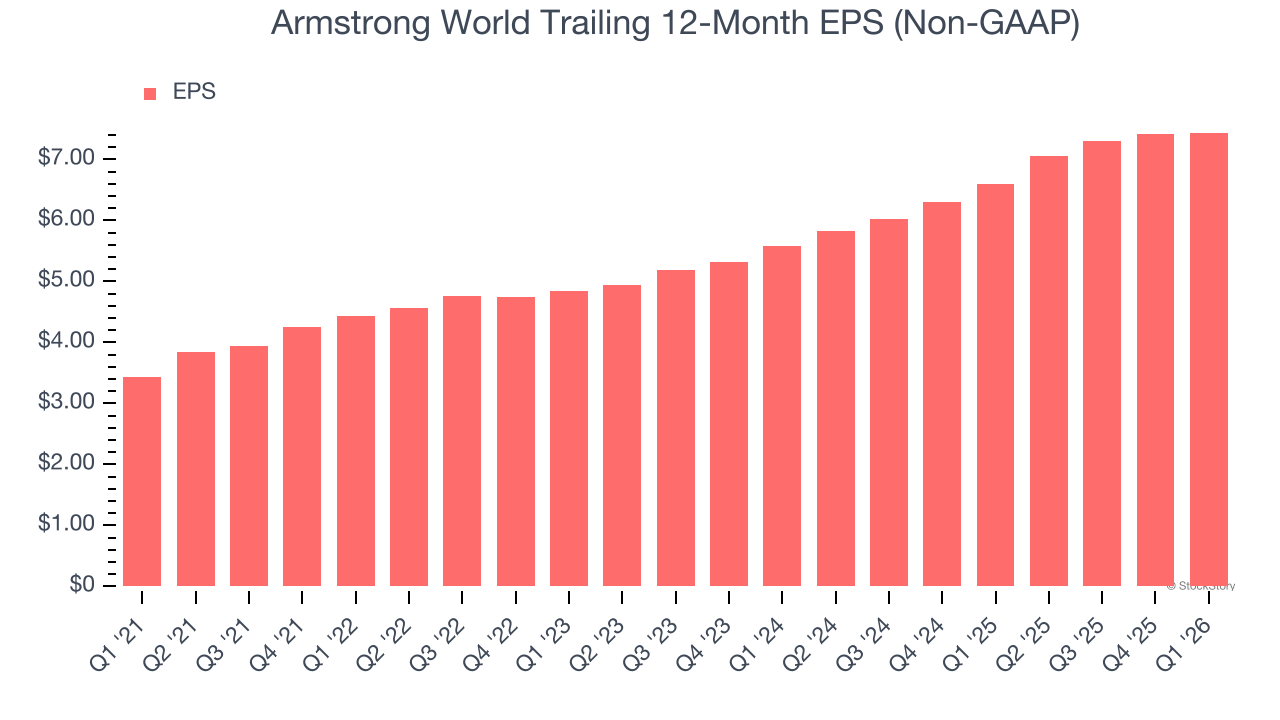
Armstrong World’s EPS grew at 16.7% compounded annual growth rate over the last five years, higher than its 11.9% annualized revenue growth. This tells us the company became more profitable on a per-share basis as it expanded.
We can take a deeper look into Armstrong World’s earnings quality to better understand the drivers of its performance. As we mentioned earlier, Armstrong World’s operating margin declined this quarter but expanded by 2.2 percentage points over the last five years. Its share count also shrank by 10%, and these factors together are positive signs for shareholders because improving profitability and share buybacks turbocharge EPS growth relative to revenue growth. 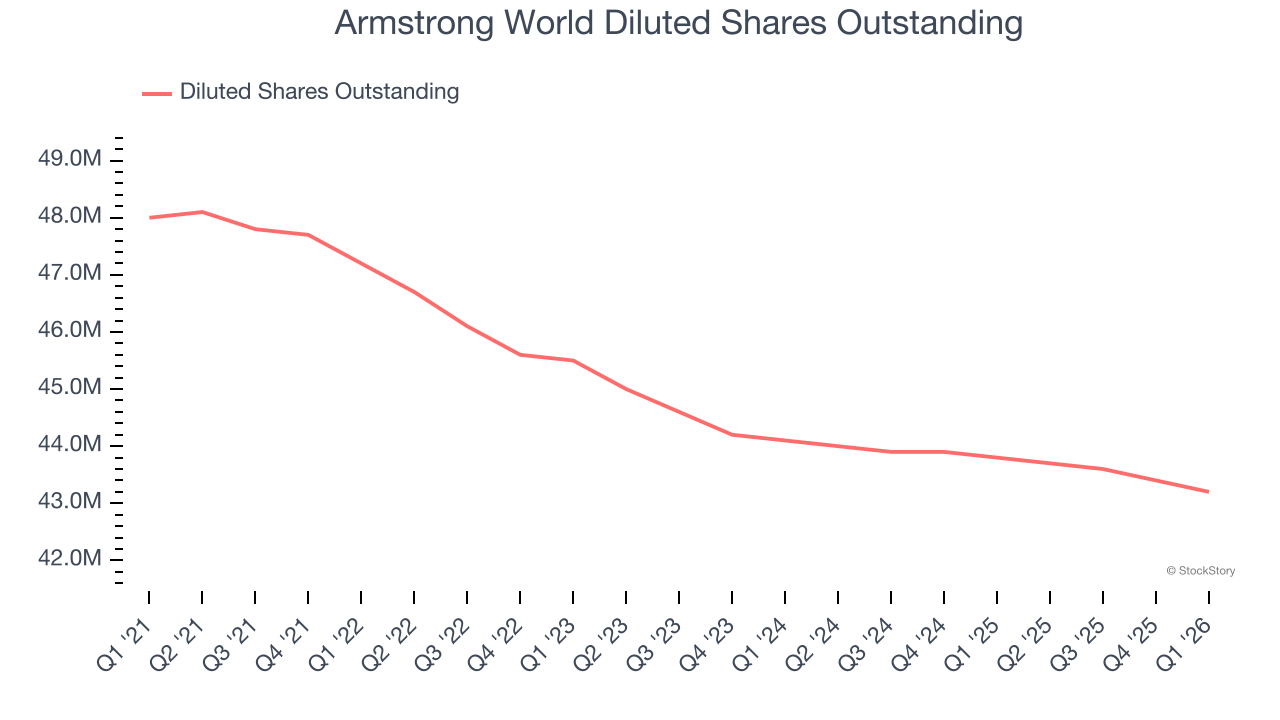
Like with revenue, we analyze EPS over a shorter period to see if we are missing a change in the business.
For Armstrong World, its two-year annual EPS growth of 15.5% was lower than its five-year trend. We still think its growth was good and hope it can accelerate in the future.
In Q1, Armstrong World reported adjusted EPS of $1.69, up from $1.66 in the same quarter last year. Despite growing year on year, this print missed analysts’ estimates, but we care more about long-term adjusted EPS growth than short-term movements. Over the next 12 months, Wall Street expects Armstrong World’s full-year EPS of $7.44 to grow 14.5%.
Key Takeaways from Armstrong World’s Q1 Results
We struggled to find many positives in these results. Its adjusted operating income missed and its EBITDA fell short of Wall Street’s estimates. Overall, this was a weaker quarter. The stock traded down 3.4% to $171.79 immediately after reporting.
The latest quarter from Armstrong World’s wasn’t that good. One earnings report doesn’t define a company’s quality, though, so let’s explore whether the stock is a buy at the current price. The latest quarter does matter, but not nearly as much as longer-term fundamentals and valuation, when deciding if the stock is a buy. We cover that in our actionable full research report which you can read here (it’s free).