Hardware products and merchandising solutions provider Hillman (NASDAQ: HLMN) missed Wall Street’s revenue expectations in Q1 CY2026 as sales rose 3% year on year to $370.1 million. On the other hand, the company’s full-year revenue guidance of $1.68 billion at the midpoint came in 2.2% above analysts’ estimates. Its non-GAAP profit of $0.07 per share was in line with analysts’ consensus estimates.
Is now the time to buy Hillman? Find out by accessing our full research report, it’s free.
Hillman (HLMN) Q1 CY2026 Highlights:
- Revenue: $370.1 million vs analyst estimates of $372.8 million (3% year-on-year growth, 0.7% miss)
- Adjusted EPS: $0.07 vs analyst estimates of $0.08 (in line)
- Adjusted EBITDA: $50.09 million vs analyst estimates of $51.91 million (13.5% margin, 3.5% miss)
- The company lifted its revenue guidance for the full year to $1.68 billion at the midpoint from $1.65 billion, a 1.8% increase
- EBITDA guidance for the full year is $280 million at the midpoint, in line with analyst expectations
- Operating Margin: 1.9%, down from 4.2% in the same quarter last year
- Free Cash Flow was -$34.35 million compared to -$21.31 million in the same quarter last year
- Market Capitalization: $1.73 billion
"Consistent demand for our hardware products, driven by repair, maintenance, and remodeling projects, coupled with mid-single digit growth in our robotics and digital solutions business ('RDS') drove a solid quarter for Hillman, despite the impact from weather and the macro," commented Jon Michael Adinolfi, President and CEO of Hillman.
Company Overview
Established when Max Hillman purchased a franchise operation, Hillman (NASDAQ: HLMN) designs, manufactures, and sells industrial equipment and systems for various sectors.
Revenue Growth
Examining a company’s long-term performance can provide clues about its quality. Any business can put up a good quarter or two, but the best consistently grow over the long haul. Over the last five years, Hillman grew its sales at a sluggish 2% compounded annual growth rate. This was below our standards and is a tough starting point for our analysis.
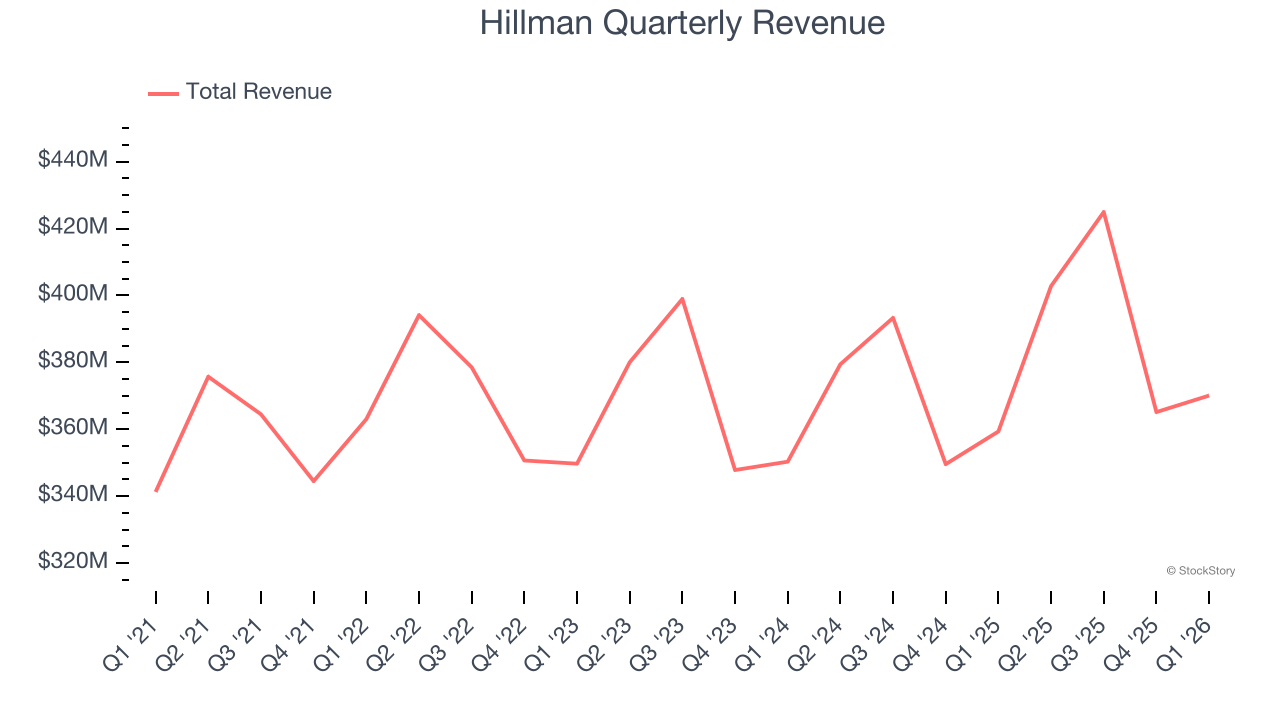
We at StockStory place the most emphasis on long-term growth, but within industrials, a half-decade historical view may miss cycles, industry trends, or a company capitalizing on catalysts such as a new contract win or a successful product line. Hillman’s annualized revenue growth of 2.9% over the last two years aligns with its five-year trend, suggesting its demand was consistently weak. 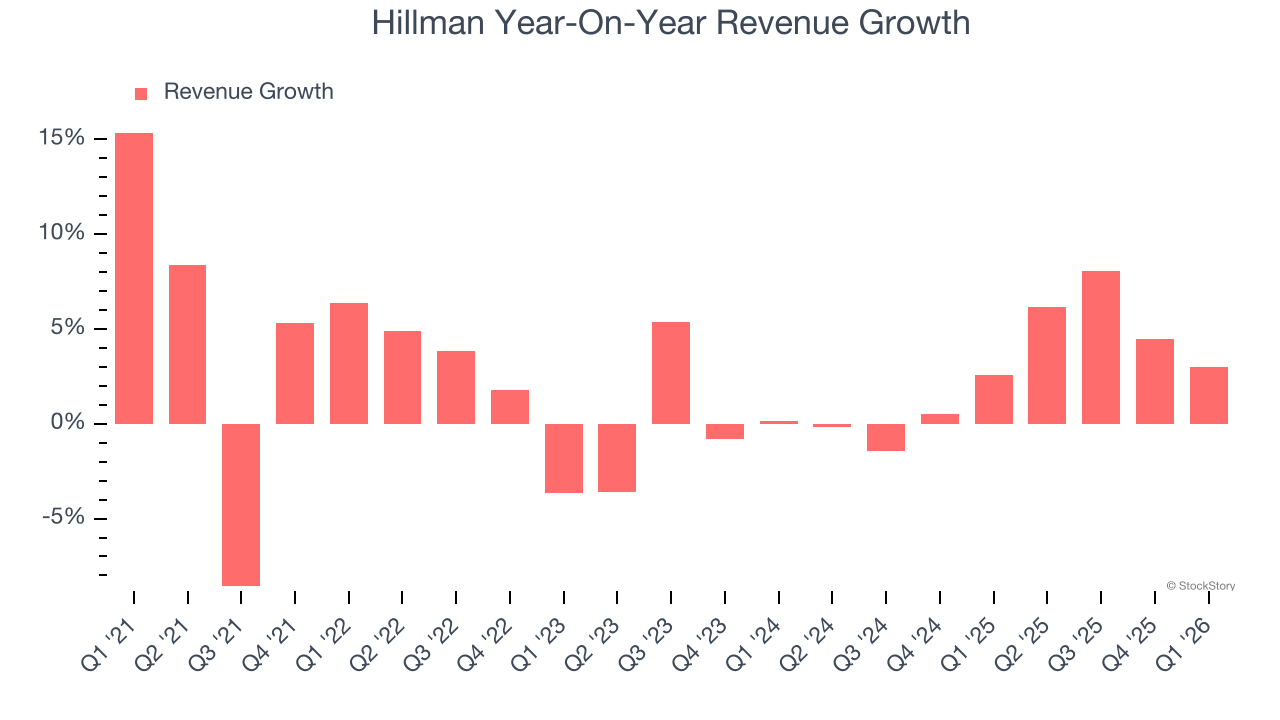
This quarter, Hillman’s revenue grew by 3% year on year to $370.1 million, falling short of Wall Street’s estimates.
Looking ahead, sell-side analysts expect revenue to grow 6.1% over the next 12 months. While this projection implies its newer products and services will catalyze better top-line performance, it is still below the sector average.
WHILE YOU’RE HERE: The Next Palantir? One satellite company captures images of every point on Earth. Every single day. The Pentagon wants it. Hedge funds are using it to beat earnings. You’ve probably never heard of it.
This is what the early days of Palantir looked like before it became a $437 billion giant. Same playbook. Different technology. If you missed Palantir, you need to see this. Claim The Stock Ticker for Free HERE.
Operating Margin
Operating margin is a key measure of profitability. Think of it as net income - the bottom line - excluding the impact of taxes and interest on debt, which are less connected to business fundamentals.
Hillman was profitable over the last five years but held back by its large cost base. Its average operating margin of 4.2% was weak for an industrials business. This result is surprising given its high gross margin as a starting point.
On the plus side, Hillman’s operating margin rose by 5.9 percentage points over the last five years, as its sales growth gave it operating leverage.
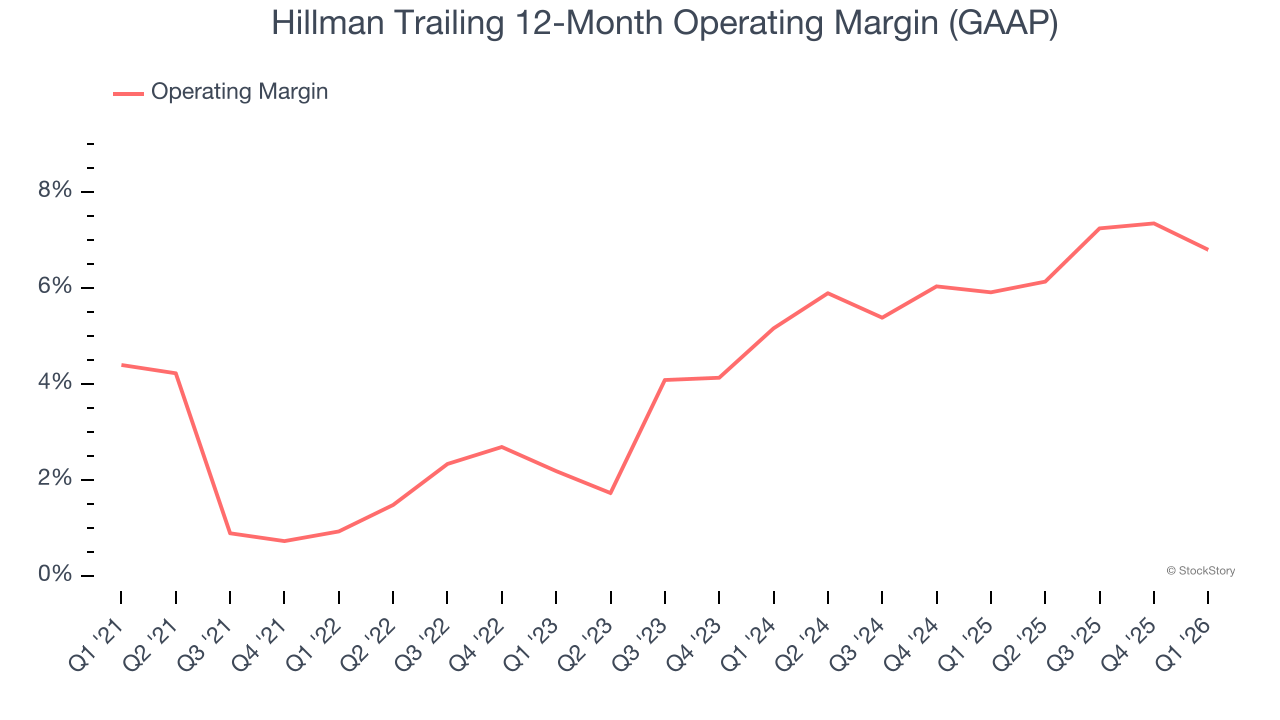
This quarter, Hillman generated an operating margin profit margin of 1.9%, down 2.2 percentage points year on year. Since Hillman’s operating margin decreased more than its gross margin, we can assume it was less efficient because expenses such as marketing, R&D, and administrative overhead increased.
Earnings Per Share
Revenue trends explain a company’s historical growth, but the long-term change in earnings per share (EPS) points to the profitability of that growth – for example, a company could inflate its sales through excessive spending on advertising and promotions.
Hillman’s full-year EPS grew at an astounding 19.7% compounded annual growth rate over the last four years, better than the broader industrials sector.
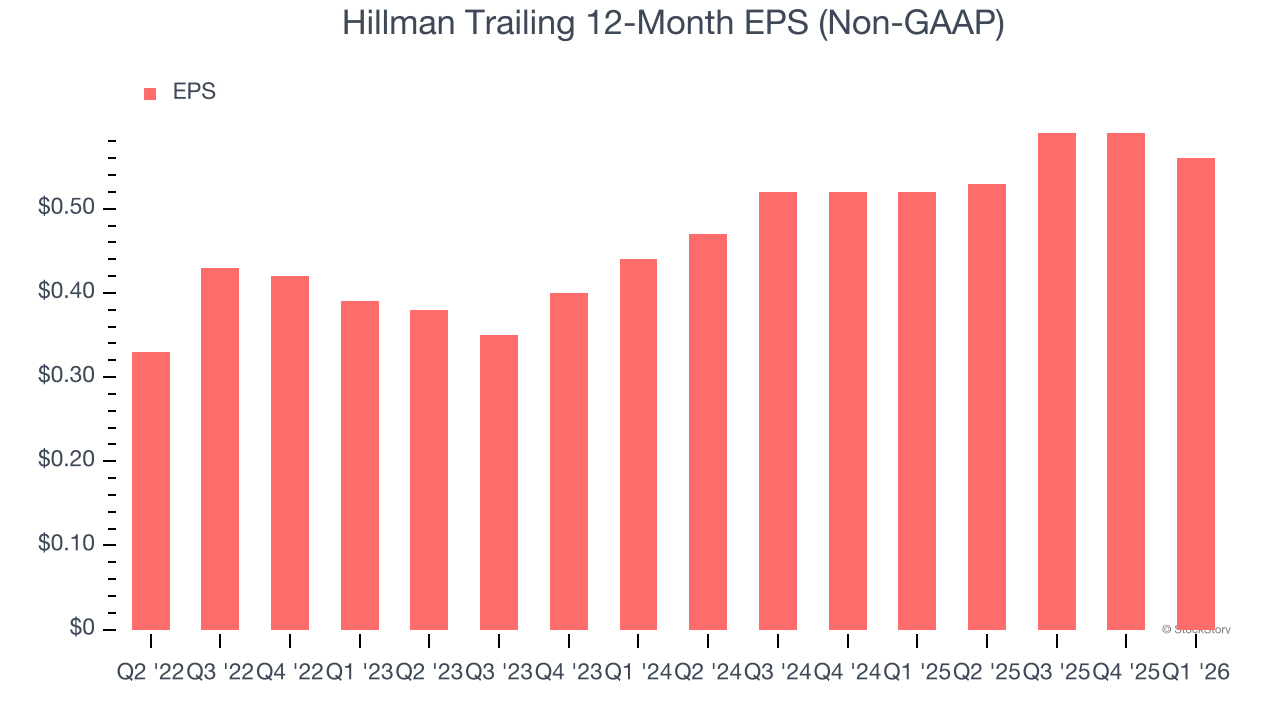
Like with revenue, we analyze EPS over a shorter period to see if we are missing a change in the business.
Hillman’s EPS grew at a remarkable 12.8% compounded annual growth rate over the last two years, higher than its 2.9% annualized revenue growth. This tells us the company became more profitable on a per-share basis as it expanded.
In Q1, Hillman reported adjusted EPS of $0.07, down from $0.10 in the same quarter last year. This print missed analysts’ estimates, but we care more about long-term adjusted EPS growth than short-term movements. Over the next 12 months, Wall Street expects Hillman’s full-year EPS of $0.56 to grow 9%.
Key Takeaways from Hillman’s Q1 Results
It was great to see Hillman’s full-year revenue guidance top analysts’ expectations. We were also glad its full-year EBITDA guidance was in line with Wall Street’s estimates. On the other hand, its revenue and adjusted operating income both missed Wall Street’s estimates. Overall, this was a mixed quarter. The stock remained flat at $8.79 immediately following the results.
Is Hillman an attractive investment opportunity at the current price? When making that decision, it’s important to consider its valuation, business qualities, as well as what has happened in the latest quarter. We cover that in our actionable full research report which you can read here (it’s free).