Cash management services provider Brink's (NYSE: BCO) fell short of the market’s revenue expectations in Q3 2026 as revenue rose 3% year on year to $1.38 billion. Next quarter’s revenue guidance of $1.39 billion underwhelmed, coming in 0.6% below analysts’ consensus estimates. Its non-GAAP profit of $2.46 per share was 2.2% above analysts’ consensus estimates.
For more on Brink's, read our free full research report.
Brink's (BCO) Q3 2026 highlights:
- Revenue $1.38 billion vs S&P analysts’ consensus estimates of $1.38 billion (3% year-on-year growth, 0.5% miss)
- Adjusted EPS $2.46 vs S&P analysts’ consensus estimates of $2.41 (2.2% beat)
- Adjusted EBITDA $274 million vs analysts’ consensus estimates of $271.5 million (19.9% margin, 0.9% beat)
- Revenue guidance $1.39 billion at the midpoint for Q4 2026, below analysts’ consensus estimates of $1.4 billion
- Adjusted EPS guidance $2.63 at the midpoint for Q4 2026, below analysts’ consensus estimates of $2.74
- EBITDA guidance $285 million at the midpoint for Q4 2026, below analysts’ consensus estimates of $288.6 million
- Operating margin 9.5%, down from 11.1% in the same quarter last year
- Free cash flow margin 3.8%, down from 5.8% in the same quarter last year
- Market capitalization $4.45 billion
Mark Eubanks, President and CEO, said: “We delivered a strong third quarter and continued to build real momentum in our strategic focus areas of AMS and DRS. Growth in these lines of business accelerated sequentially, even against a challenging economic backdrop in many of our larger markets. Adjusted EBITDA grew 8%, and margins expanded by 90 basis points year-over-year, powered by favorable revenue mix and strong pricing dynamics. Heading into the fourth quarter, customer demand for our solutions remains healthy, and we remain firmly committed to our full-year framework.”
Revenue growth
A company’s long-term performance is an indicator of its overall quality. Even a bad business can perform well for one or two quarters, but a high-quality one grows for years.
With $5.52 billion in revenue over the past 12 months, Brink's is one of the larger companies in the business services industry and benefits from a well-known brand that influences purchasing decisions.
Brink's grew its revenue at a decent 6% compounded annual growth rate over the last five years. This shows its offerings generated slightly more demand than the average business services company.
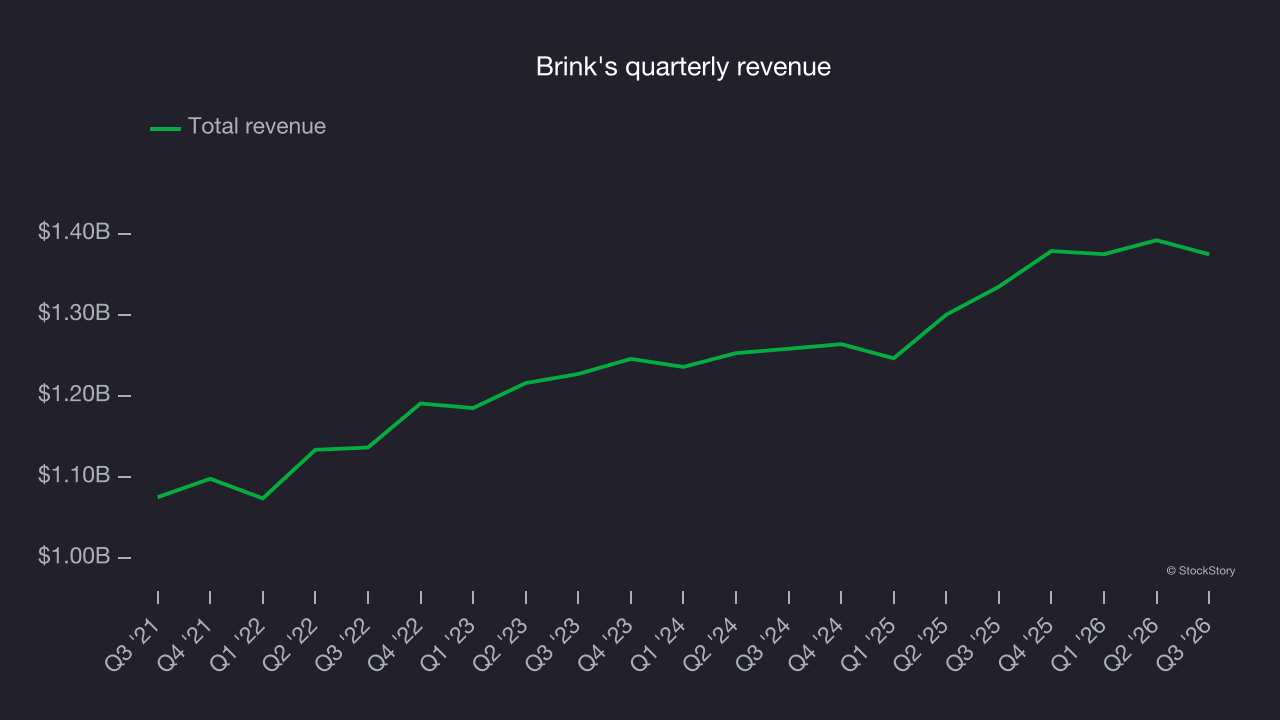
Long-term growth is the most important, but within business services, a half-decade historical view may miss new innovations or demand cycles. Brink’s annualized revenue growth of 5.2% over the last two years aligns with its five-year trend, suggesting its demand was stable. 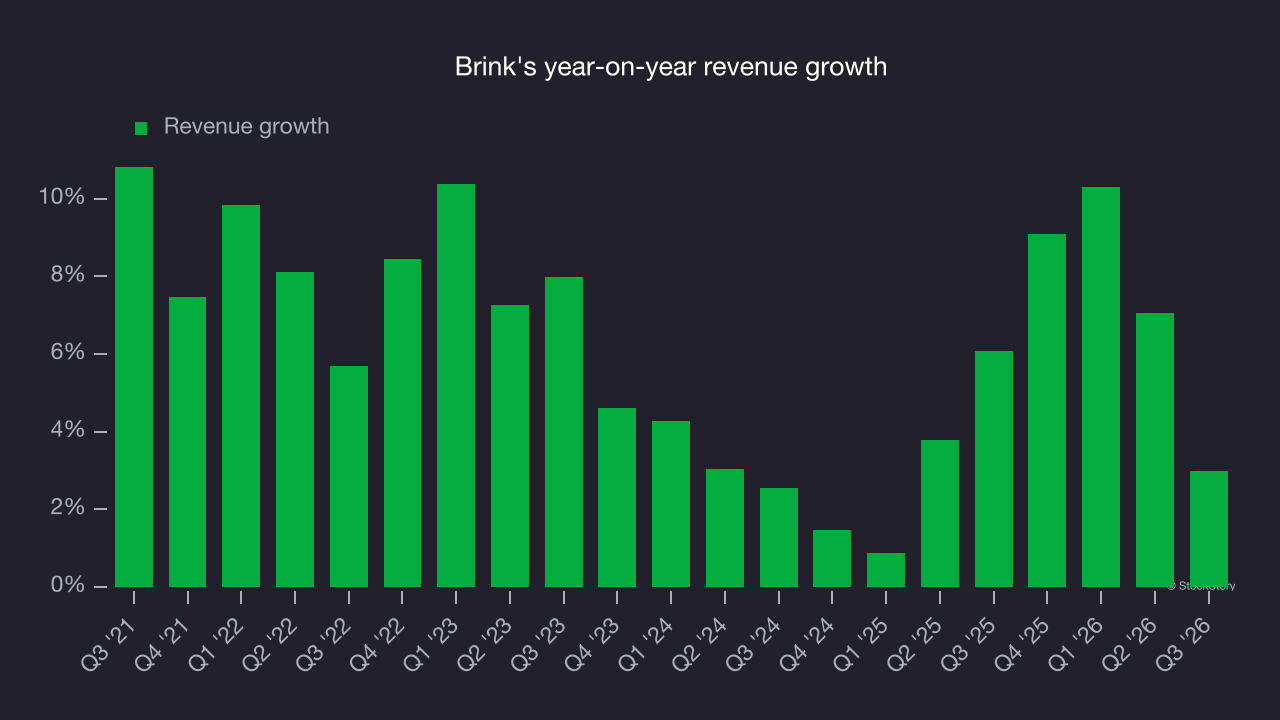
This quarter, Brink’s revenue grew by 3% year on year to $1.38 billion, falling short of Wall Street’s consensus estimates. Management is guiding for flat revenue next quarter.
Looking further ahead, sell-side analysts expect revenue to grow 2.4% over the next 12 months, according to S&P, a slight deceleration versus the last two years. This projection is underwhelming and implies its products and services will see some demand headwinds.
Adjusted operating margin
Adjusted operating margin is an important measure of profitability as it shows the portion of revenue left after accounting for all core expenses, from the cost of goods sold to advertising and wages. It’s also useful for comparing profitability across companies because it excludes non-recurring expenses, interest on debt and taxes.
Brink's has managed its cost base well over the last five years. It demonstrated solid profitability for a business services company, producing an average adjusted operating margin of 12.7%.
Brink’s adjusted operating margin rose by 1.1 percentage points over the last five years, as its revenue growth gave it operating leverage.
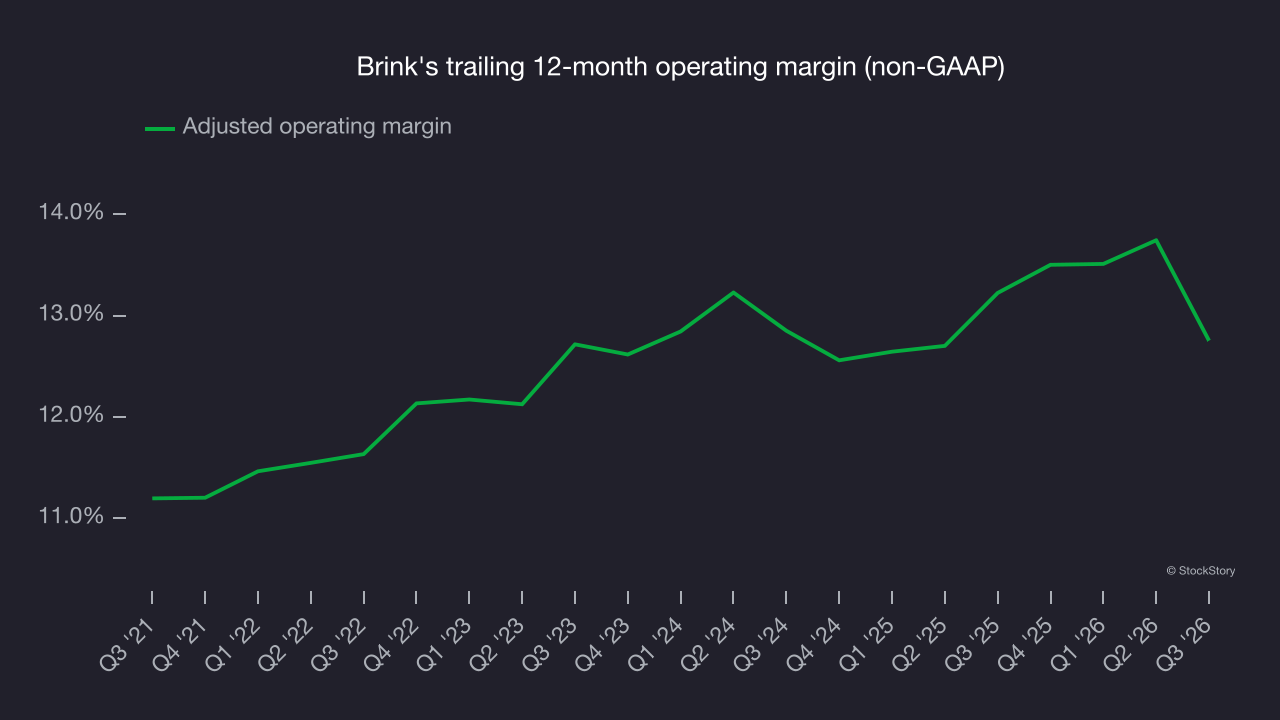
This quarter, Brink's generated an adjusted operating margin of 10.1%, down 4 percentage points year on year. This contraction shows it was less efficient because its expenses grew faster than its revenue.
Earnings per share
We track the long-term change in earnings per share (EPS) for the same reason as long-term revenue growth. Compared to revenue, however, EPS highlights whether a company’s growth is profitable.
Brink’s EPS grew at a 13.3% compounded annual growth rate over the last five years, higher than its 6% annualized revenue growth. This indicates the company became more profitable on a per-share basis as it expanded.
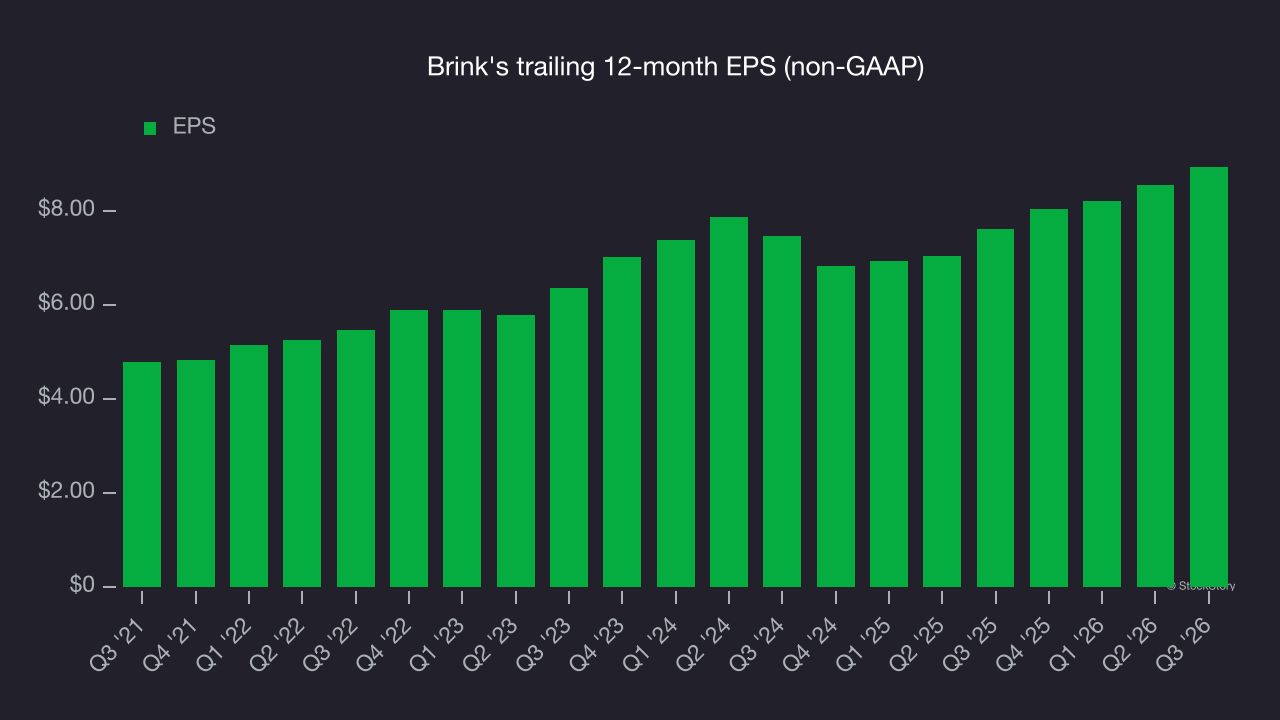
A closer look at Brink’s quality of earnings helps explain its performance. As mentioned earlier, Brink’s adjusted operating margin declined this quarter but expanded by 1.1 percentage points over the last five years. Its share count also shrank by 14.8%, and these factors together are positive signs for shareholders because improving profitability and share buybacks boost EPS growth relative to revenue growth. 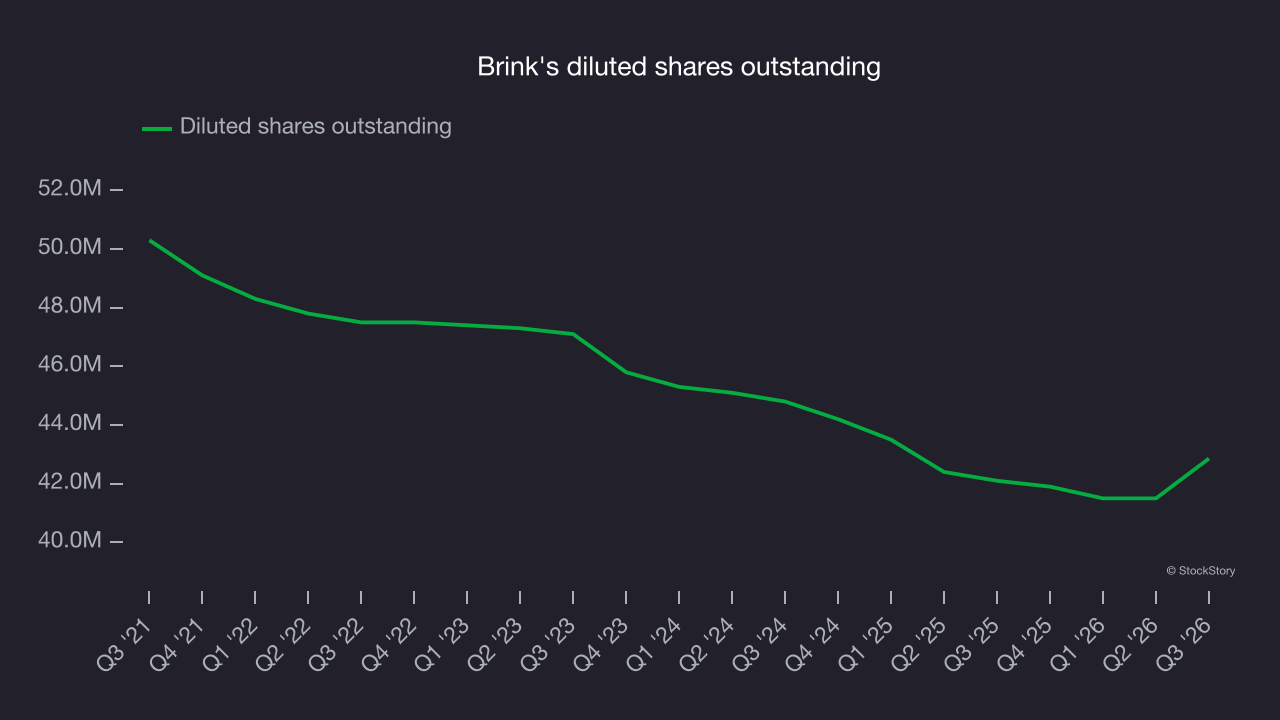
As with revenue, we analyze EPS over a more recent period because it can provide insight into an emerging theme or development for the business.
Brink's two-year annual EPS growth of 9.4% was lower than its five-year trend.
In Q3, Brink's reported adjusted EPS of $2.46, up from $2.08 in the same quarter last year. This result beat analysts’ consensus estimates by 2.2%. Over the next 12 months, Wall Street expects Brink’s full-year EPS to grow 9.4% from $8.93 to $9.77, according to S&P.
Key takeaways from Brink’s Q3 results
Brink’s reported a weaker quarter overall, despite beating analysts’ consensus EPS estimates. Revenue fell slightly short of Wall Street’s consensus, and next-quarter EPS guidance also missed expectations. Shares remained flat at $108 immediately after the release.
To assess Brink's as an investment, consider the bigger picture of valuation and business quality, as well as the latest earnings. Read the full research report here (it’s free).