Railcar products and services provider Trinity (NYSE: TRN) reported Q3 2026 results beating Wall Street’s revenue expectations, with revenue up 17.8% year on year to $535.1 million. Its GAAP profit of $0.22 per share was 21.4% below analysts’ consensus estimates.
For more on Trinity, read the full research report, available free.
Trinity (TRN) Q3 2026 highlights:
- Revenue $535.1 million vs S&P analysts’ consensus estimates of $498.4 million (17.8% year-on-year growth, 7.4% beat)
- Non-GAAP EPS (GAAP) $0.27 vs analysts’ consensus estimates of $0.28 (21.4% miss)
- Adjusted EBITDA $168.6 million vs analysts’ consensus estimates of $169.6 million (31.5% margin, 0.6% miss)
- Non-GAAP EPS guidance $2.30 at the midpoint for the full year, beating analysts’ consensus estimates by 4.5%
- Operating margin 17.9%, down from 21.2% in the same quarter last year
- Free cash flow -$119.6 million compared to -$199.3 million in the same quarter last year
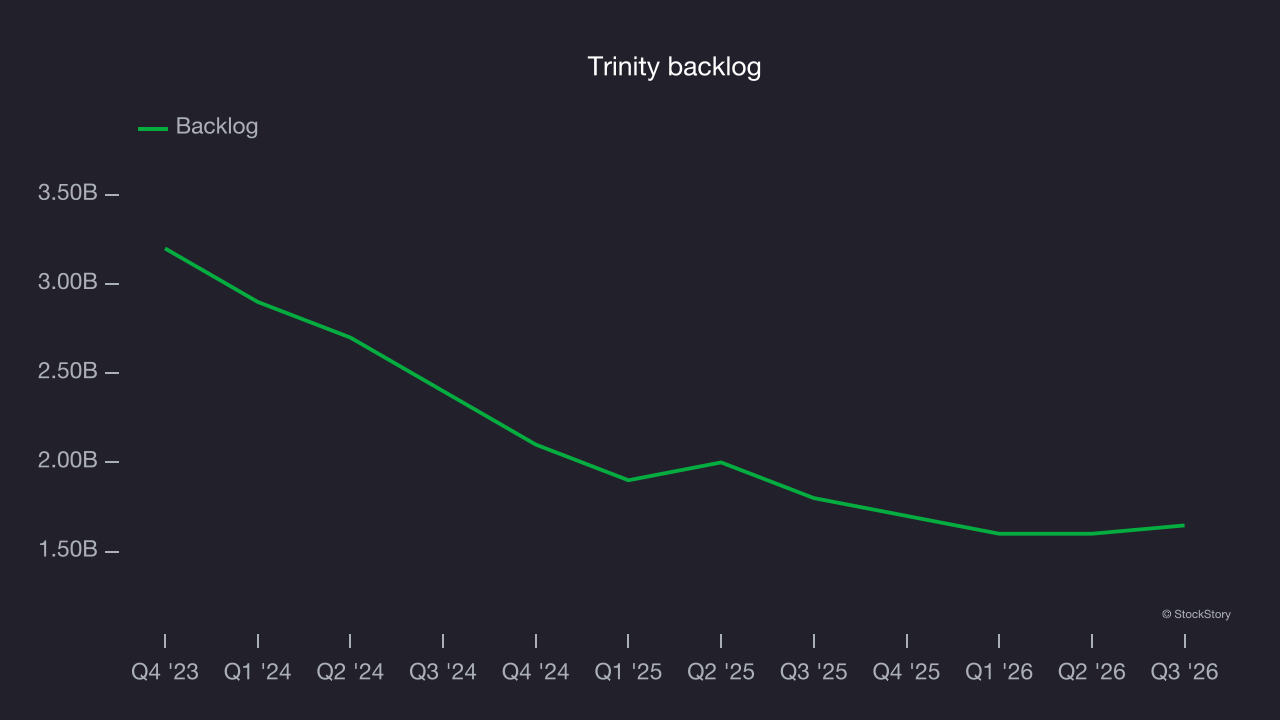
- Backlog $1.65 billion at quarter end, down 8.5% year on year
- Market capitalization $2.04 billion
“Our third quarter reflects a business positioned for growth, with momentum building,” said Jean Savage, Trinity’s Chief Executive Officer and President. “Revenues grew 18% year over year, and last twelve months Adjusted ROE was 31.8%, above our target range, reflecting both the value unlocked through our railcar partnership transactions and improving operational performance.”
Revenue growth
A company’s long-term revenue performance can indicate its overall quality. Even a poor business can perform well for one or two quarters, but a high-quality one grows for years. Over the last five years, Trinity grew its revenue at an impressive 11.9% compounded annual growth rate. Its growth beat the average industrials company and shows its offerings resonate with customers.
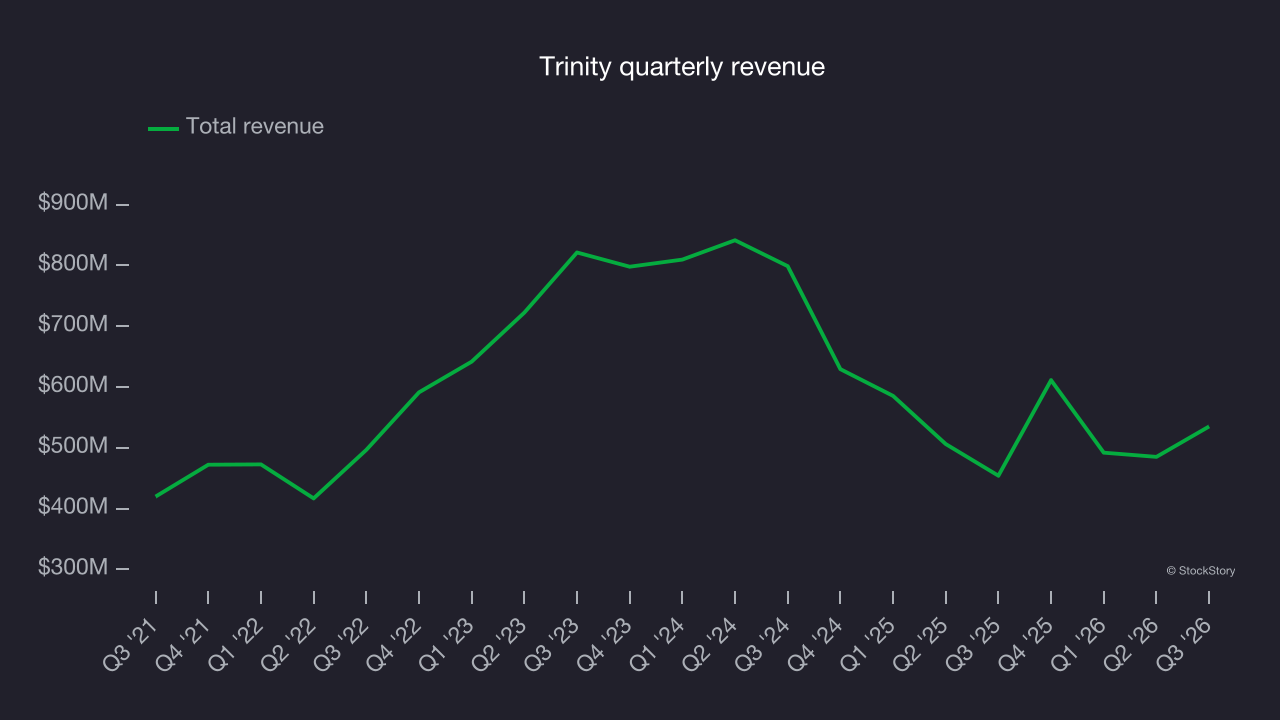
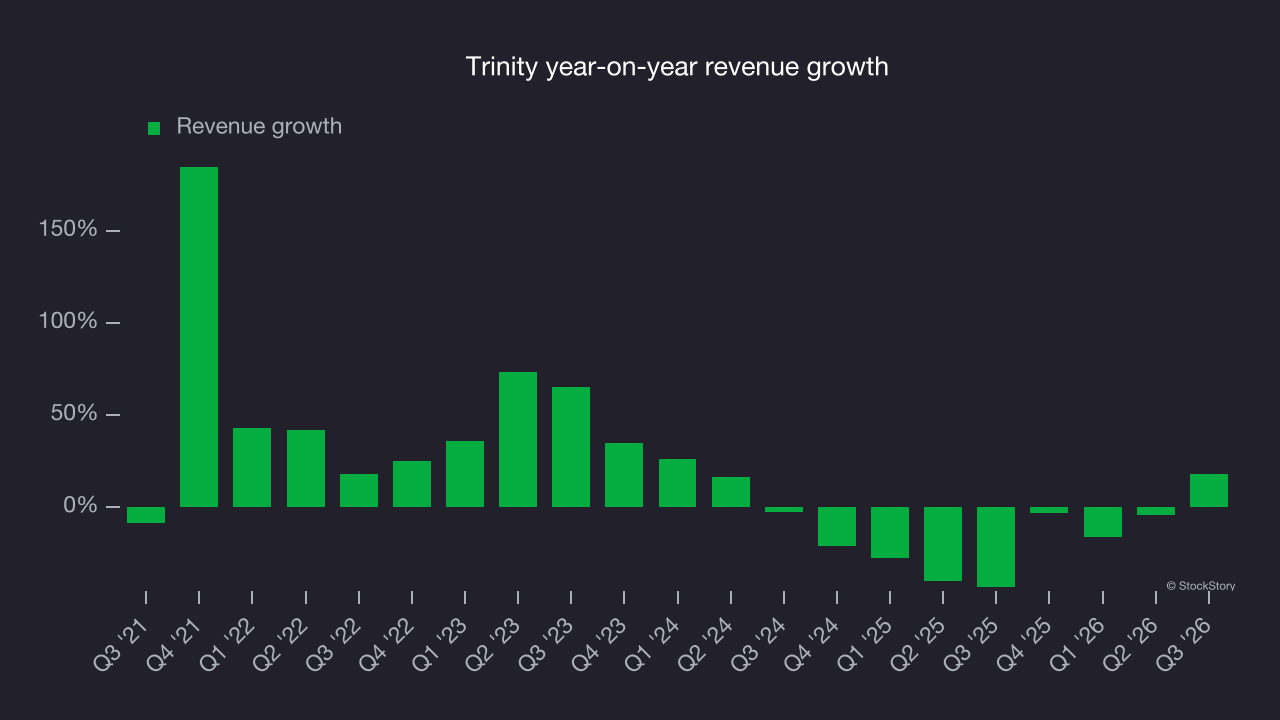
This quarter, Trinity reported year-on-year revenue growth of 17.8%, and its $535.1 million of revenue exceeded Wall Street’s consensus estimates by 7.4%.
Looking ahead, sell-side analysts expect revenue to decline by 3.6% over the next 12 months, according to S&P. While this projection is better than its two-year trend, the company’s demand difficulties remain a concern.
Operating margin
Trinity has been an efficient company over the last five years. It was one of the more profitable businesses in the industrials sector, with an average operating margin of 13%. This result was particularly impressive because of its low gross margin, which largely reflects what it sells and requires substantial shifts to change meaningfully. Companies have more control over their operating margins, and high operating margins alongside low gross margins indicate well-managed operations.
Looking at the trend in its profitability, Trinity’s operating margin rose by 5.2 percentage points over the last five years, as its revenue growth provided substantial operating leverage.
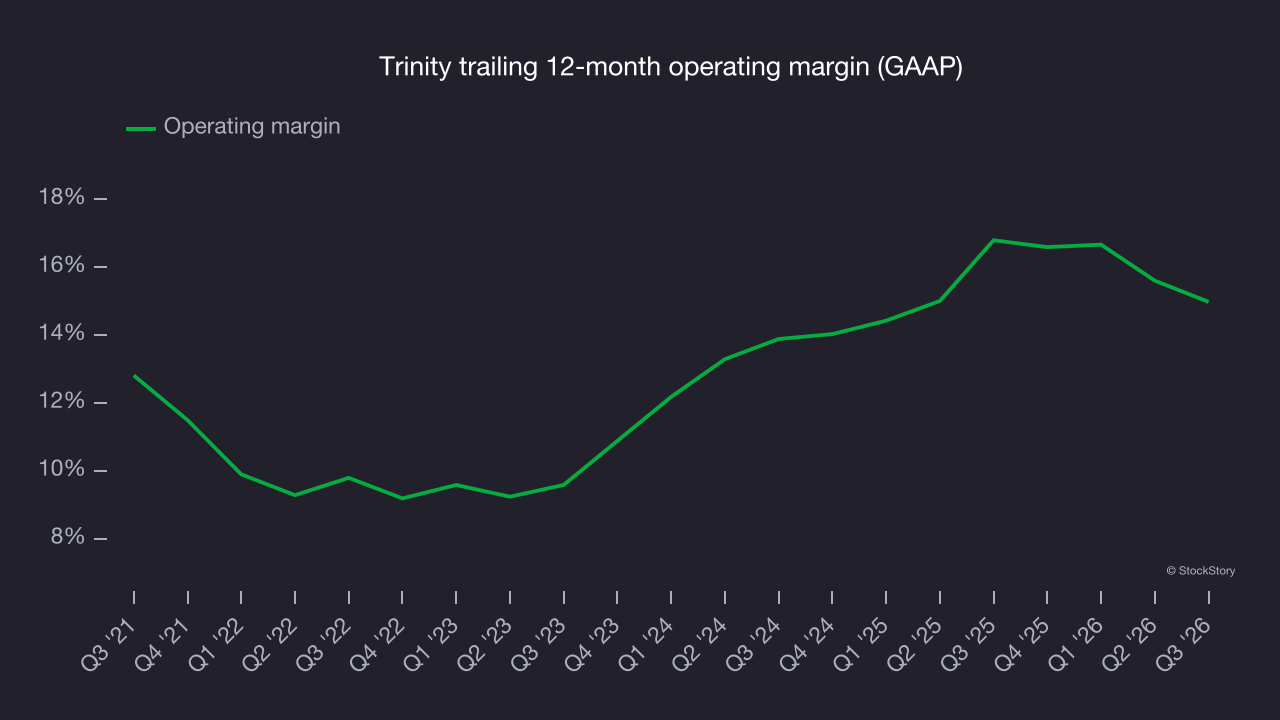
In Q3, Trinity generated an operating margin of 17.9%, down 3.3 percentage points year on year. Since Trinity’s gross margin decreased more than its operating margin, this suggests its recent inefficiencies were driven more by weaker leverage on its cost of sales than by increased marketing, R&D and administrative overhead expenses.
Earnings per share
Revenue trends explain a company’s historical growth, but the long-term change in earnings per share (EPS) points to the profitability of that growth. For example, a company could inflate its revenue through excessive spending on advertising and promotions.
Trinity’s full-year EPS turned positive over the last five years, a positive sign that marks a critical point for the business.
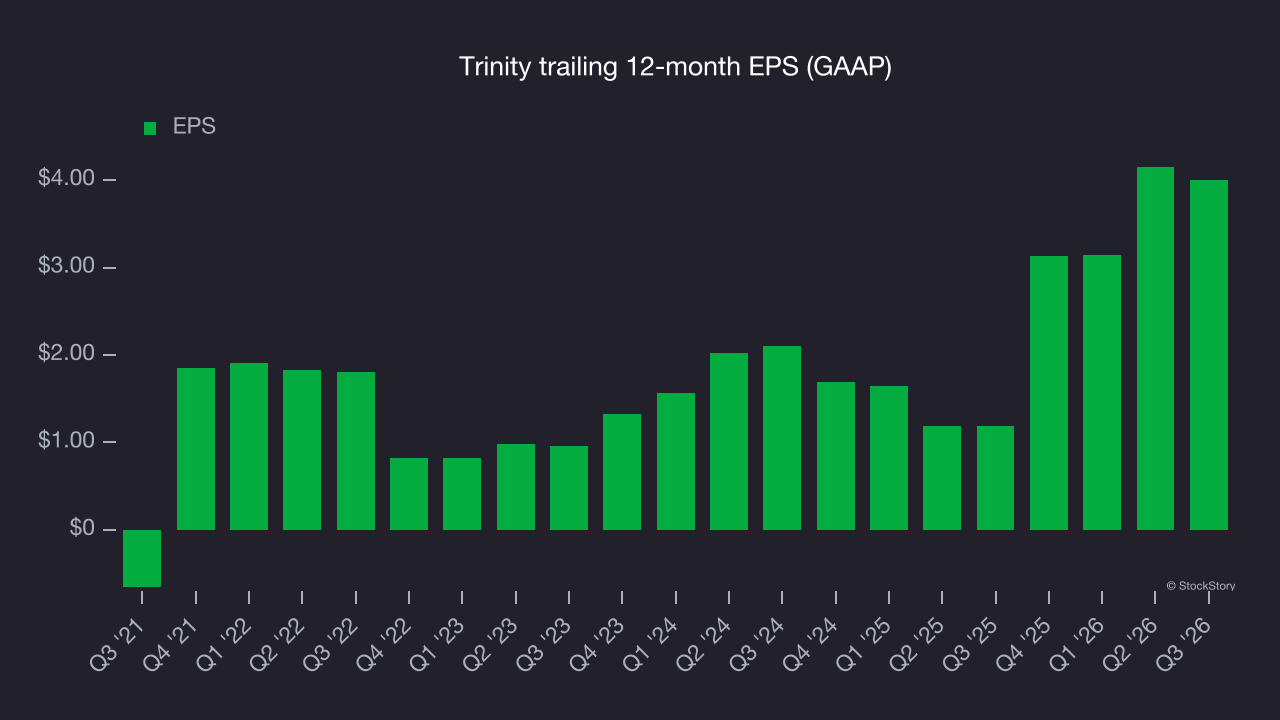
As with revenue, examining EPS over a shorter period can reveal a change in the business.
Trinity’s EPS grew at a strong 38% compounded annual growth rate over the last two years, higher than its 19.1% annualized revenue declines. This indicates management adapted its cost structure in response to a challenging demand environment.
A closer look at Trinity’s earnings helps explain its performance. While Trinity’s operating margin declined this quarter, as noted earlier, a two-year view shows its margin has expanded while its share count has shrunk 3.7%. Improving profitability and share buybacks are positive signs for shareholders as they boost EPS growth relative to revenue growth.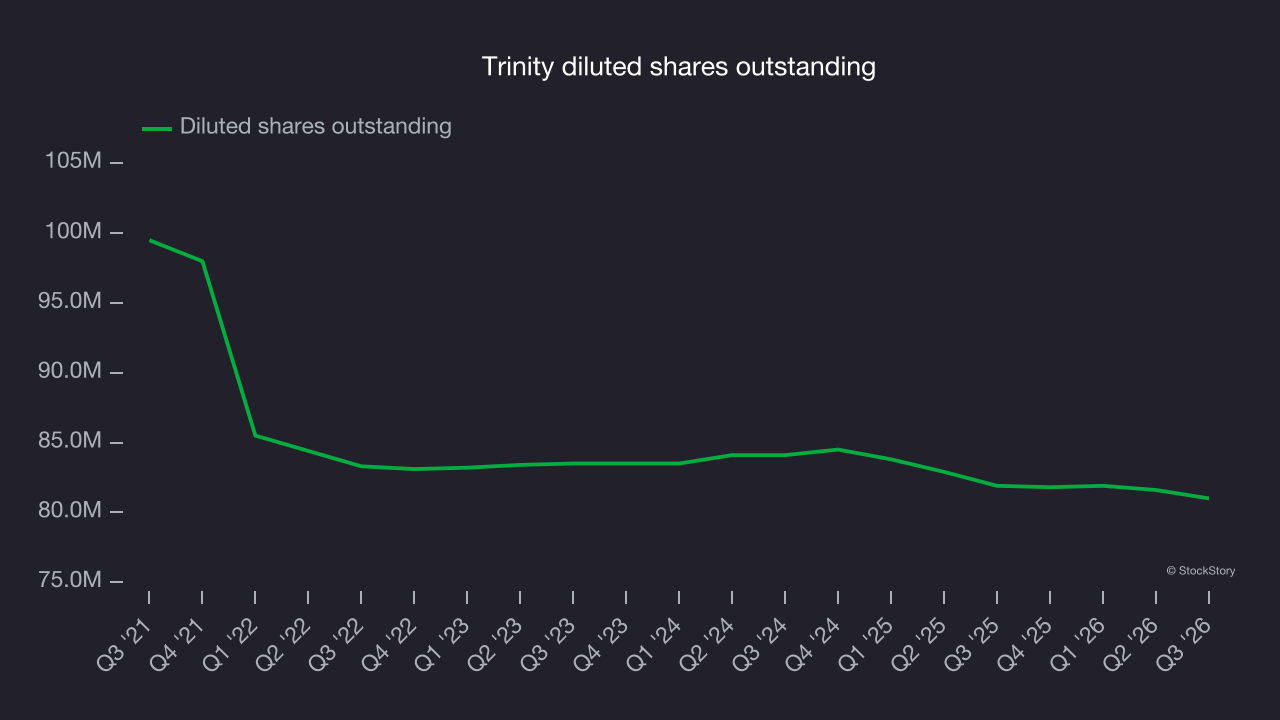
In Q3, Trinity reported EPS of $0.22, down from $0.37 in the same quarter last year. The result missed analysts’ consensus estimates, but long-term EPS growth matters more than short-term movements. Expected EPS growth based on Wall Street analysts’ consensus projections is also worth examining, but there is insufficient data.
Key takeaways from Trinity’s Q3 results
Trinity’s Q3 results were mixed, with a sizable revenue beat and full-year EPS guidance above Wall Street’s consensus providing key positives. But quarterly EPS narrowly missed consensus estimates, and EBITDA came in slightly below expectations. Shares remained flat at $25.36 immediately after the report.
When considering an investment in Trinity, the latest quarter is only one piece of the longer-term business quality picture. Quality, when combined with valuation, can help determine if the stock is a buy. For more on these factors, read our full research report here (it’s free).