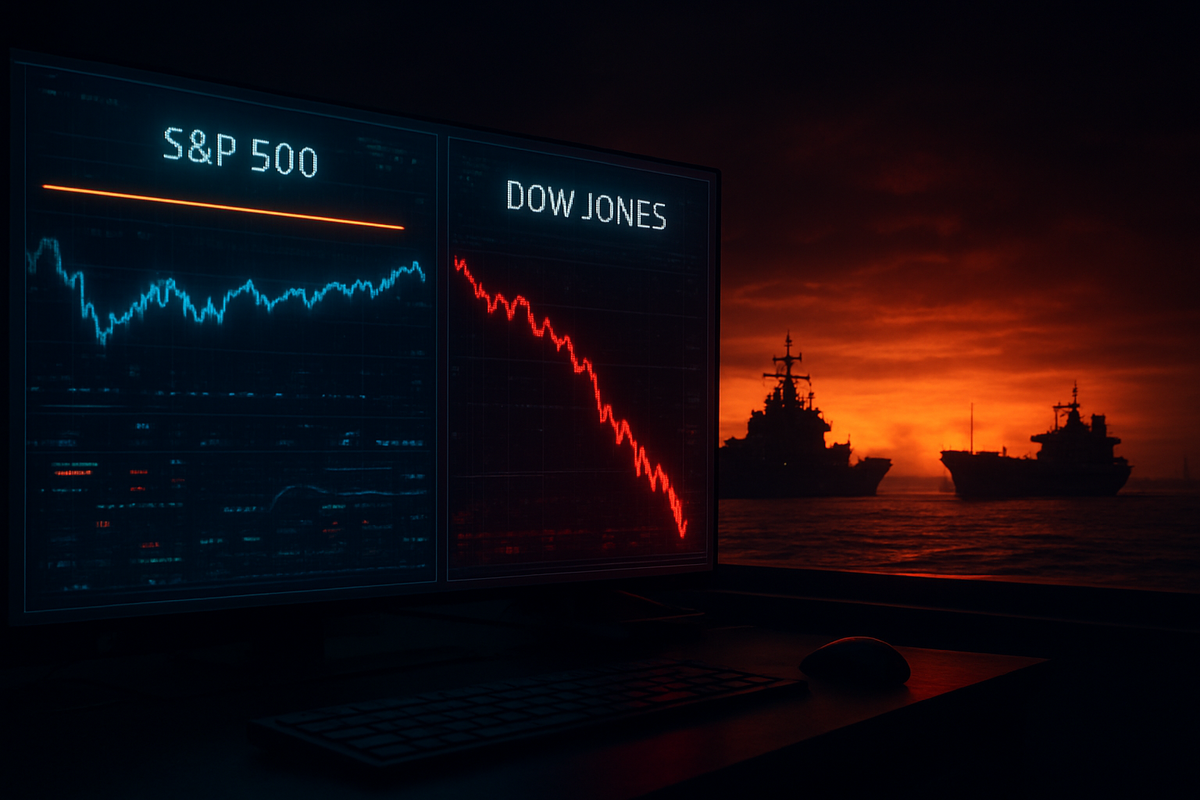
The first week of April 2026 has proven to be a crucible for global markets as the S&P 500 (INDEXSP: .INX) fights a losing battle to preserve its narrow monthly gains. While the broader index had initially ridden a wave of early spring optimism, a sharp escalation in Middle Eastern tensions—specifically rumors of a complete maritime blockade in the Strait of Hormuz—has sent investors scrambling for the exits. The divergence between the major indices is stark: while the S&P 500 clings to a flatline, the Dow Jones Industrial Average (INDEXDJX: .DJI) has surrendered over 1,200 points in just four trading sessions, highlighting a massive rotation out of industrial cyclicals and into defensive havens.
As of April 7, 2026, the technical floor for the S&P 500 at the 6,600 level is under heavy fire. Market analysts are growing increasingly concerned that the "war-driven inflation" narrative will force the Federal Reserve to pivot from its long-awaited rate-cut path back to a "higher-for-longer" stance. With oil prices surging toward three-digit territory and supply chain anxieties returning to 2024 levels, the market's resilience is being tested by a "triple threat" of geopolitical instability, technical resistance, and an unforgiving macroeconomic environment.
The Breaking Point at 6,600: A Week of Market Turmoil
The current volatility began in late March when diplomatic efforts to secure the "2026 Peace Accord" in the Persian Gulf stalled, but the situation reached a boiling point on April 1, 2026. Following a series of naval skirmishes involving unmanned maritime drones, insurance premiums for oil tankers tripled overnight. This "black swan" event shattered the calm that had defined the first quarter of the year. The S&P 500, which had peaked at an all-time intraday high of 6,715 in late March, immediately retreated to test its 50-day moving average, a level it has not convincingly broken since the start of the year.
The timeline of the slide reveals a market that was already overextended. By April 3, the Dow Jones began its vertical descent, pressured by heavy selling in aerospace and traditional manufacturing components that are most sensitive to fuel costs. Key stakeholders, including major institutional funds and the "Big Three" asset managers, have notably shifted their allocations. According to recent flow data, there has been a record $14 billion exit from consumer discretionary ETFs in the last 72 hours, with that capital flowing almost exclusively into short-term Treasury bills and energy-linked commodities.
Initial market reactions were fueled by a "flash crash" in the early hours of Monday, April 6, when rumors of "Operation Epic Fury"—a rumored defensive mobilization plan—hit the wires. Although the Pentagon has not officially confirmed the scale of the mobilization, the mere suggestion of a prolonged regional conflict was enough to trigger algorithmic selling. This sell-off was exacerbated by the fact that many retail portfolios were "long and wrong," having banked on a quiet April historically bolstered by tax-refund inflows.
Winners and Losers: The Great Sector Pivot
In this environment of high-stakes geopolitical maneuvering, the market has split into two camps: those positioned for conflict and those vulnerable to it. Lockheed Martin Corporation (NYSE: LMT) and Northrop Grumman (NYSE: NOC) have emerged as the primary beneficiaries of the "war fear" premium. Lockheed Martin has seen its shares jump 8.4% since April 1, as rumors circulate regarding a multi-billion dollar replenishment contract for tactical missile systems. These defense giants are acting as a hedge for portfolios that are otherwise bleeding from their tech and industrial exposures.
Conversely, the technology sector is facing a "valuation winter." NVIDIA Corporation (NASDAQ: NVDA), the long-standing engine of the S&P 500’s growth, has finally hit a wall. As war fears intensify, concerns over the security of semiconductor supply chains in the Pacific and Middle East have led to a 7% slide in its stock price this week. Similarly, Microsoft Corporation (NASDAQ: MSFT) has struggled as investors worry that a spike in energy costs will significantly eat into the margins of its massive global data center network. For these high-growth companies, the combination of rising discount rates and geopolitical risk is a toxic mix.
The energy sector, led by Exxon Mobil Corporation (NYSE: XOM) and Chevron Corporation (NYSE: CVX), remains the only "green" spot on the heat map. With Brent crude surpassing $105 per barrel this morning, Exxon Mobil has reached a new 52-week high, effectively keeping the S&P 500 from falling into the red for the year. However, this is a double-edged sword; while it protects the index's value, the rising cost of energy acts as a tax on the rest of the economy, further depressing the outlook for retail and transportation stocks.
Broader Implications and Historical Echoes
The current market state mirrors the "April Anxiety" seen in 2024, when the S&P 500 faced a similar 4% correction following the escalation of the Iran-Israel conflict. However, the 2026 iteration is more complex due to the "stickiness" of inflation. Unlike 2024, where the Fed was still signaling a eventual dovish turn, the 2026 central bank is caught between a rock and a hard place. If they cut rates to support the sliding Dow, they risk hyper-inflating an energy market already strained by war. If they hold steady, they risk a deep recession led by the industrial sector.
This event fits into a broader industry trend of "De-globalization 2.0." The threat to the Strait of Hormuz isn't just a temporary price spike; it represents a fundamental challenge to the "just-in-time" global economy. Competitors in the renewable energy space, such as NextEra Energy, Inc. (NYSE: NEE), might eventually see long-term benefits, but in the short term, even they are being dragged down by the general "risk-off" sentiment and the rising cost of capital needed for infrastructure projects.
Historically, when the Dow slides significantly more than the S&P 500, it often signals a "hollow" market being propped up by a handful of mega-cap stocks or a single booming sector (in this case, Energy). This divergence has preceded major market corrections in 2000 and 2008. Regulatory scrutiny is also expected to heighten, as policymakers in Washington begin discussing emergency price caps on energy, a move that could have massive ripple effects on the profitability of the S&P's top energy constituents.
Looking Ahead: The 6,400 Floor or a Diplomatic Bounce?
The short-term outlook depends entirely on the headlines coming out of the Gulf. If a diplomatic "off-ramp" is discovered in the coming days, we could see one of the most violent "relief rallies" in recent memory, as short-sellers cover their positions in tech and industrials. However, if the blockade becomes a physical reality, the S&P 500 is likely to break the 6,600 support level and begin a rapid descent toward the 6,400 mark, which represents its 200-day moving average.
Strategic pivots are already underway. Wealth managers are advising a "Barbell Strategy"—holding defensive defense and energy stocks on one side, and ultra-short duration bonds on the other. The "AI growth at any price" trade that dominated 2025 has been officially shelved. Moving forward, the market opportunity lies in companies with "energy sovereignty" and those that can maintain high margins despite rising logistics costs. Scenarios where the Fed is forced to raise rates again in May are no longer being dismissed as "fringe" theories.
Conclusion: A Market at a Crossroads
The struggle of the S&P 500 to stay positive this April is more than just a technical glitch; it is a symptom of a world returning to a state of geopolitical volatility. The key takeaway for investors is that the era of "easy gains" driven by AI optimism and falling rates has met its fiercest opponent yet: the reality of global conflict. While the S&P 500 is currently "clinging to flat," the underlying rot in the Dow suggests that the broader economy is feeling the squeeze of high energy prices and supply chain uncertainty.
Moving forward, the market will likely remain in a "wait-and-see" mode. Investors should keep a close eye on the $110 oil mark and the 6,600 technical level on the S&P 500. A break below either could trigger a wider capitulation. In the coming months, the resilience of the consumer and the Fed’s willingness to look past energy-driven inflation will determine whether this is a temporary April shower or the beginning of a long, cold winter for equities.
This content is intended for informational purposes only and is not financial advice.