Lennar Corporation (NYSE: LEN) reported its first-quarter 2026 financial results on March 12, revealing a housing market caught between a structural supply deficit and the persistent weight of high mortgage rates. While the homebuilder managed to keep its production lines moving and even saw a slight uptick in new orders, the cost of maintaining that momentum was evident in its compressed margins and lower bottom-line earnings. As of late March 2026, the results serve as a bellwether for the broader industry, suggesting that while the "lock-in effect" of previous years is beginning to thaw, affordability remains the primary hurdle for the American homebuyer.
The quarterly report highlights a strategic pivot toward volume over pricing power, a trend that is defining the early 2026 real estate landscape. With total revenue falling 13% year-over-year to $6.6 billion, Lennar is leaning heavily into sales incentives—such as mortgage rate buydowns—to bridge the gap for consumers. This "production-first" approach is keeping inventory flowing in a market that still lacks roughly 4 to 5 million homes to meet demand, but it has forced the company to accept a lower gross margin profile as it prioritizes market share and liquidity over record-breaking profits.
A Strategic Inflection Point Amid Affordability Constraints
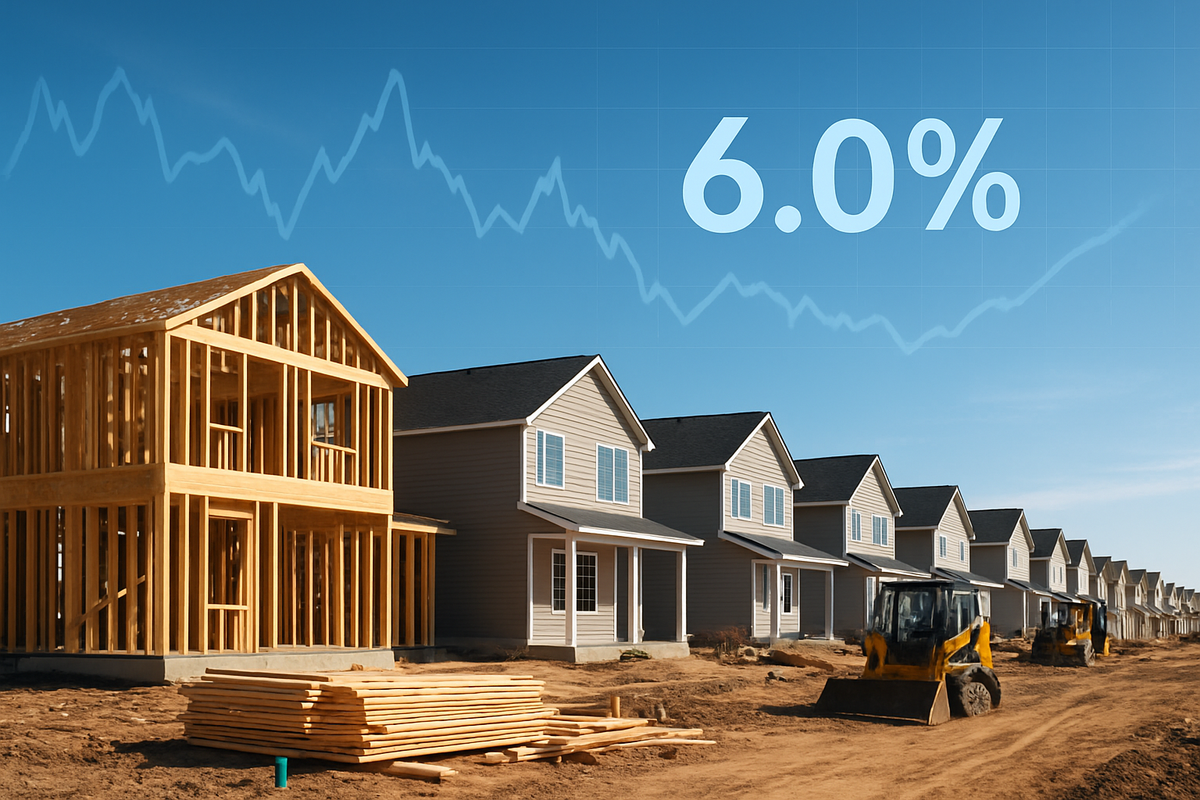
Lennar’s Q1 2026 performance was characterized by a push-and-pull between operational efficiency and macroeconomic headwinds. The company delivered 16,863 homes during the quarter, a 5% decline from the previous year, while new orders actually grew by 1% to 18,515 homes. This growth in orders, despite a 30-year fixed mortgage rate hovering between 6.0% and 6.3%, indicates that demand for new housing remains resilient when priced correctly. However, the average sales price of a Lennar home dropped 8% to $374,000, reflecting both a shift toward more affordable product lines and the aggressive use of incentives.
The most striking figure in the report was the contraction of Lennar’s gross margin to 15.2%, down significantly from 18.7% in the same period last year. The company disclosed that it utilized sales incentives ranging from 14.1% to 14.5% of the sale price to drive traffic and close deals. Executive Chairman and CEO Stuart Miller described the current environment as an "inflection point," noting that while high rates remain the primary obstacle, the company has successfully "designed around the affordability challenge." By reducing direct construction costs by 7% and achieving an all-time low cycle time of 122 days for single-family homes, Lennar is attempting to out-operate the margin squeeze through sheer industrial speed.
The reaction from Wall Street has been one of cautious recalibration. Following the March 12 announcement, Lennar's stock saw immediate volatility as investors weighed the miss on earnings per share—$0.93 compared to the $1.96 recorded a year prior—against the strong order backlog of 15,588 homes valued at approximately $6.0 billion. Market analysts are now closely watching whether Lennar’s aggressive "asset-light" land strategy, which aims to improve capital efficiency, can offset the near-term earnings drag caused by the high-interest-rate environment that has persisted into the first half of 2026.
Winners and Losers in the Rebalanced Housing Market
In this environment of high rates and tight margins, the divide between large-scale national builders and smaller regional players is widening. Lennar and its primary competitor, D.R. Horton (NYSE: DHI), are emerging as relative winners because of their "fortress" balance sheets and ability to self-fund mortgage buydowns. By offering rates significantly lower than the market average through their internal mortgage subsidiaries, these giants are capturing a larger slice of the first-time buyer market. Conversely, smaller builders who lack the scale to negotiate deep discounts on materials or provide significant financing incentives are finding it increasingly difficult to compete on price.
Supply chain and material providers like Builders FirstSource (NYSE: BLDR) are also navigating a complex landscape. While homebuilder production remains steady, the 8% drop in average sales prices suggests that builders are opting for smaller, more efficient floor plans, which may change the mix of products sold by suppliers. Meanwhile, luxury-focused builders like Toll Brothers (NYSE: TOL) may face different pressures; while their clientele is less sensitive to mortgage rates, the "wealth effect" from stock market volatility in early 2026 is becoming a more critical factor in their sales velocity compared to the entry-level segment dominated by PulteGroup (NYSE: PHM) and KB Home (NYSE: KBH).
On the losing side of this equation are traditional mortgage lenders and regional banks. With the big homebuilders increasingly capturing mortgage volume through in-house financing, independent lenders are seeing a further reduction in their share of the new-home market. Additionally, as national housing inventory moves closer to a balanced state of 4.6 months, the extreme sellers' market of the early 2020s has vanished. Real estate platforms that rely on high transaction volume and high prices, such as Zillow Group (NASDAQ: Z) and Redfin (NASDAQ: RDFN), continue to face headwinds as the "lock-in effect" only slowly dissipates and total transaction counts remain below historical norms.
The Structural Deficit and the End of the "Lock-In" Effect
The significance of Lennar's Q1 results extends beyond a single company; it highlights a fundamental shift in the U.S. housing narrative. For the past two years, the market was paralyzed by the "lock-in effect," where homeowners with 3% mortgage rates refused to sell, starving the market of inventory. As we enter the spring of 2026, this effect is finally starting to fray. Life events—marriages, births, and job changes—are forcing moves that were delayed during 2024 and 2025. This increase in existing home inventory, which is expected to rise nearly 9% this year, is finally providing consumers with choices beyond new construction.
However, the "structural deficit" mentioned by Stuart Miller remains the dominant theme. Even with the slight rise in inventory, the U.S. is still millions of units short of what is needed to house its population. This shortage is a historical anomaly caused by a decade of under-building following the 2008 financial crisis. Lennar's strategy of maintaining a high production rate despite lower margins is a direct bet on this long-term supply-demand imbalance. If Lennar can maintain its production engine through this period of high rates, it will be positioned to capture massive gains if and when the Federal Reserve begins a more aggressive easing cycle later in 2026 or 2027.
Regulatory and policy implications are also coming into focus as 2026 progresses. With housing affordability a top-tier political issue, there is increasing pressure on local governments to ease zoning restrictions and on the federal level to provide tax credits for first-time buyers. Lennar’s move toward smaller, "attainably priced" homes aligns with these policy goals, potentially insulating the company from future regulatory crackdowns on housing costs. This shift mirrors historical precedents where builders had to reinvent their product offerings during the high-inflation era of the late 1970s to survive.
Looking Ahead: The Path to 2027
In the short term, Lennar and its peers must navigate a "muddle-through" economy. The company’s focus on cycle-time reduction and cost-cutting suggests that they expect rates to remain "higher for longer" throughout the remainder of 2026. The strategic pivot required here is one of extreme operational discipline. Builders will need to continue refining their "asset-light" models, moving land off their balance sheets and into land-banking arrangements to preserve cash and reduce risk during this period of price discovery.
Market opportunities may emerge in the form of "built-to-rent" communities, a segment Lennar has already begun to explore. As individual ownership remains out of reach for many despite the drop in average sales prices, the demand for high-quality rental housing is expected to surge. By 2027, the success of these diversified portfolios could be the factor that separates the top-tier homebuilders from the rest of the pack. Investors should prepare for a period of "sideways" price movement in the housing market, where volume remains the primary metric for corporate health.
Wrap-Up and Investor Outlook
Lennar’s Q1 2026 earnings report is a testament to the resilience of the U.S. homebuilding industry in the face of daunting economic math. By prioritizing deliveries and new orders over peak margins, Lennar is proving that there is a floor to the housing market, supported by a fundamental lack of shelter. The key takeaway for investors is that the "golden age" of 25%+ gross margins for homebuilders has passed, replaced by a more mature, industrial-scale phase where efficiency and financing incentives are the primary tools for growth.
Moving forward, the market will likely see a stabilization of home prices with growth projected between 0% and 2.2% for the full year. For investors, the metrics to watch in the coming months will be the "absorption rate"—how quickly new homes are being sold—and the level of incentives required to maintain that rate. If Lennar can begin to pull back on incentives without sacrificing order volume, it will be the first clear signal that the housing market has fully adjusted to the new interest rate reality. For now, the "production-first" strategy remains the only viable path through the current affordability crisis.
This content is intended for informational purposes only and is not financial advice.