In my October 16, 2025, Q3 Barchart wrap-up on the soft commodities sector, I wrote that “I remain bullish on sugar and cotton prices at the current price levels, but will leave plenty of room to add on further declines, as picking bottoms can be dangerous.” ICE world sugar futures #11 were 4% higher in Q3, but fell 16.41% over the first nine months of 2025, closing at 16.10 cents per pound on September 30, 2026. On October 15, they had already declined to the 15.60 cents level, on their way to just above 14 cents in early November.
The bearish trend in sugar futures continues
After reaching the highest price since October 2011 at 28.14 cents per pound in November 2023, world sugar futures prices have made lower highs and lower lows, and have recently traded at half the price of the November 2023 peak.
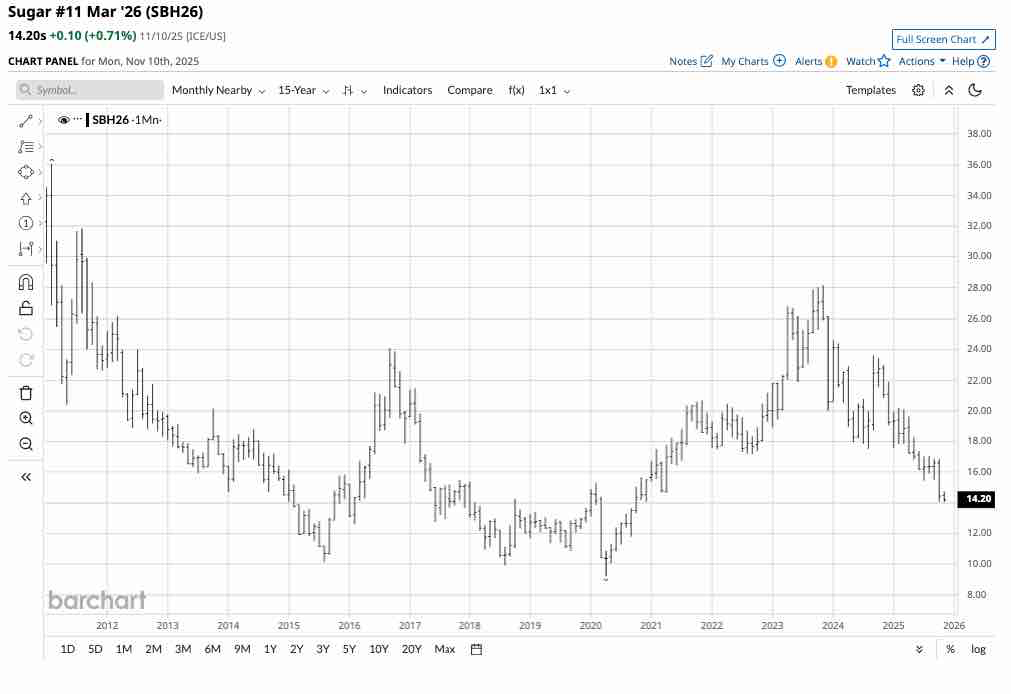
The monthly chart highlights that sugar prices have dissolved to the lowest level since October 2020 at the latest low of 14.04 cents per pound. Sugar futures prices were at the 14.20 cent level on November 10, and the path of least resistance of prices suggests that lower lows are likely before the end of 2025.
A global supply surplus in 2025/2025 from Brazil and India
Brazil and India are, by far, the world’s leading sugarcane-producing countries. There has been a substantial year-on-year increase in sugar production in Brazil’s Center-South region, and projections for the 2026/2027 season forecast further increases.
Meanwhile, favorable monsoon rains improved India’s sugarcane crop prospects, leading to a significant increase in sugar output for the 2025/2026 season. Moreover, the Indian government’s Fair and Remunerative Price for sugarcane supports higher production levels.
More sugarcane output from the world’s leading producers has led many analysts to forecast a sugar surplus or glut for the 2025/2026 season, which has weighed on prices.
Commodity cyclicality says sugar is closer to a low than a high
While the path of least resistance for sugar prices is lower, it may only be a matter of time before commodity cyclicality kicks in, creating a price bottom. During bear markets, commodity prices tend to decline to levels where production slows, as it becomes less economically viable, and even leads to a loss when costs exceed market prices. As output slows, inventories begin to decline, and consumption increases at lower price levels, leading to bottoms. However, there is always a chance that prices can decline to levels that defy fundamental and technical analysis before turning higher. Therefore, it is virtually impossible to pick or identify bottoms during price declines.
However, cyclicality tends to influence prices over time.
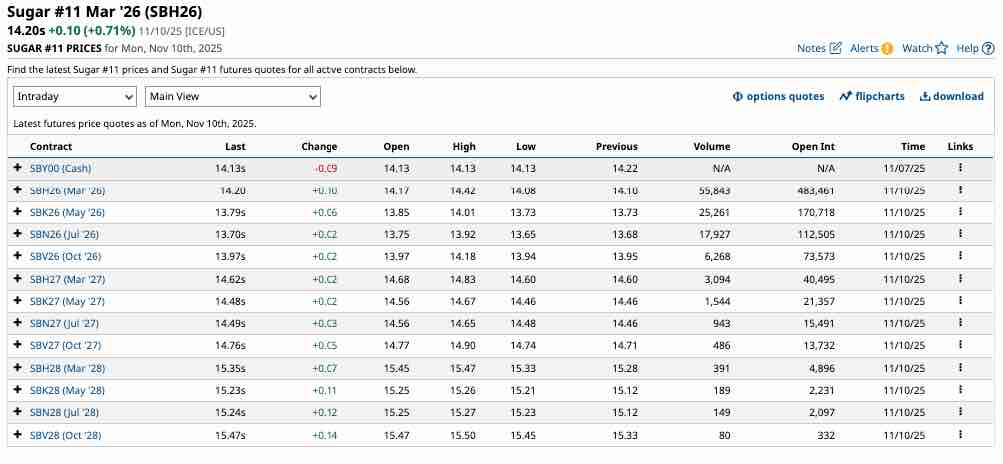
The forward curve in world sugar #11 futures shows a contango, where prices for deferred delivery are higher than for nearby delivery. The contango confirms that sugar’s fundamentals point to oversupply in the current environment. However, as an agricultural commodity, the weather and growing conditions in Brazil and India over the coming years will be the primary factor that determines future prices.
Technical levels to watch in the sugar futures market
Sugar has a long history as a very volatile agricultural commodity.

The long-term quarterly chart highlights that sugar futures have traded as high as 66 cents in 1974 and as low as 1.23 cents per pound in 1967. Since 2000, the high and low have been 36.08 cents and 4.82 cents per pound. Technical support over the past years is at the April 2020 pandemic-inspired low of 9.21 cents, with resistance at the November 2023 twelve-year high of 28.14 cents per pound. At 14.20 cents in November 2025, sugar is closer to the low than the high, but commodity cyclicality could be a critical factor for 2026 and beyond.
CANE is an ETF that moves higher and lower with a portfolio of ICE world sugar futures contracts
The soft sector of the raw materials asset class includes tropical commodities trading on the Intercontinental Exchange, including world sugar, Arabica coffee, cocoa, cotton, and frozen concentrated orange juice futures. World sugar #11 is the only soft commodity with an ETF product reflecting its price action.
At $9.21 per share, the Teucrium Sugar ETF (CANE) had over $11.6 million in assets under management. CANE trades an average of 67,600 shares daily, and the Teucrium website states that CANE charges a 0.93% management fee. CANE owns three actively traded ICE world sugar futures contracts, excluding the nearby contract, to minimize roll risks when the active month contract rolls to the next contract. Since the most speculative activity tends to occur in the nearby futures month, CANE often underperforms sugar futures on the upside, while it tends to outperform the nearby contract during price declines.
The multi-year decline in the continuous world sugar futures took them just over 50% lower, from 28.14 in November 2023 to the most recent low of 14.04 cents in October 2025.
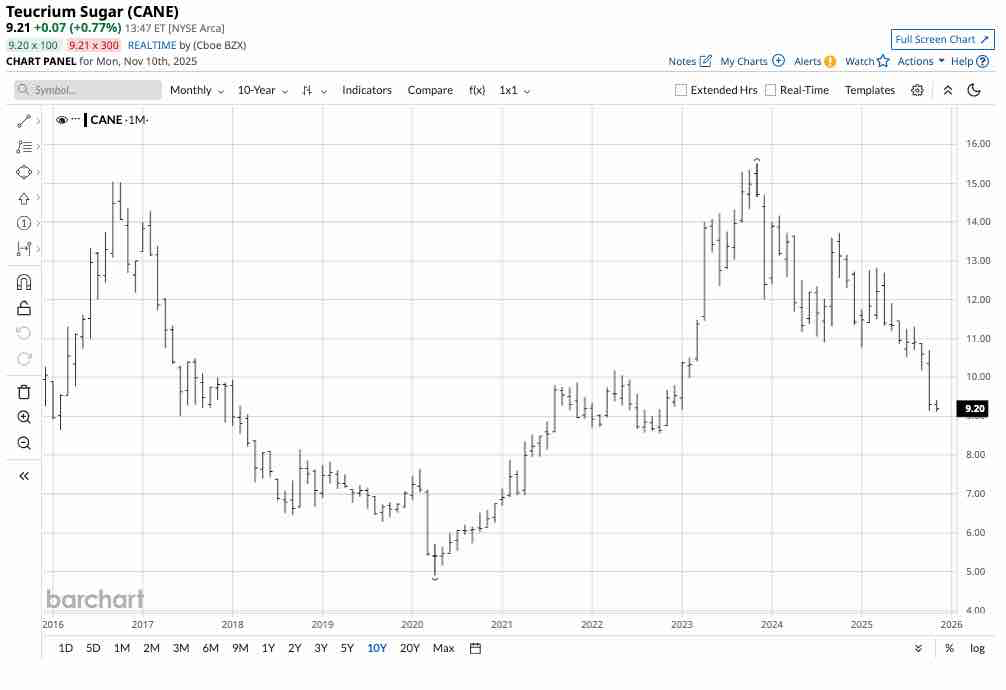
Over the same period, the unleveraged CANE ETF fell 41.2% from $15.51 to $9.12 per share, as the ETF’s structure outperformed the continuous world sugar #11 futures contract.
I believe that sugar is approaching a price where commodity cyclicality will create a bottom, leading to a price recovery. However, picking a bottom is virtually impossible when a market is making lower highs and lower lows. Therefore, I favor a scale-down approach to sugar, leaving plenty of room to add on further declines. While sugar futures are the primary route for exposure, the CANE ETF, available in standard equity accounts, is an acceptable proxy for the sweet commodity.
On the date of publication, Andrew Hecht did not have (either directly or indirectly) positions in any of the securities mentioned in this article. All information and data in this article is solely for informational purposes. For more information please view the Barchart Disclosure Policy here.
More news from Barchart