Measurement equipment distributor Transcat (NASDAQ: TRNS) reported Q2 CY2026 results topping the market’s revenue expectations, with sales up 21.6% year on year to $92.95 million. Its non-GAAP profit of $0.51 per share was 35.1% above analysts’ consensus estimates.
Is now the time to buy Transcat? Find out by accessing our full research report, it’s free.
Transcat (TRNS) Q2 CY2026 Highlights:
- Revenue: $92.95 million vs analyst estimates of $86.55 million (21.6% year-on-year growth, 7.4% beat)
- Adjusted EPS: $0.51 vs analyst estimates of $0.38 (35.1% beat)
- Adjusted EBITDA: $14 million vs analyst estimates of $12.46 million (15.1% margin, 12.4% beat)
- Operating Margin: 4%, down from 7.1% in the same quarter last year
- Free Cash Flow was $4.84 million, up from -$975,000 in the same quarter last year
- Market Capitalization: $838.5 million
Company Overview
Serving the pharmaceutical, industrial manufacturing, energy, and chemical process industries, Transcat (NASDAQ: TRNS) provides measurement instruments and supplies.
Revenue Growth
Reviewing a company’s long-term sales performance reveals insights into its quality. Any business can have short-term success, but a top-tier one grows for years. Thankfully, Transcat’s 13.8% annualized revenue growth over the last five years was exceptional. Its growth beat the average industrials company and shows its offerings resonate with customers.
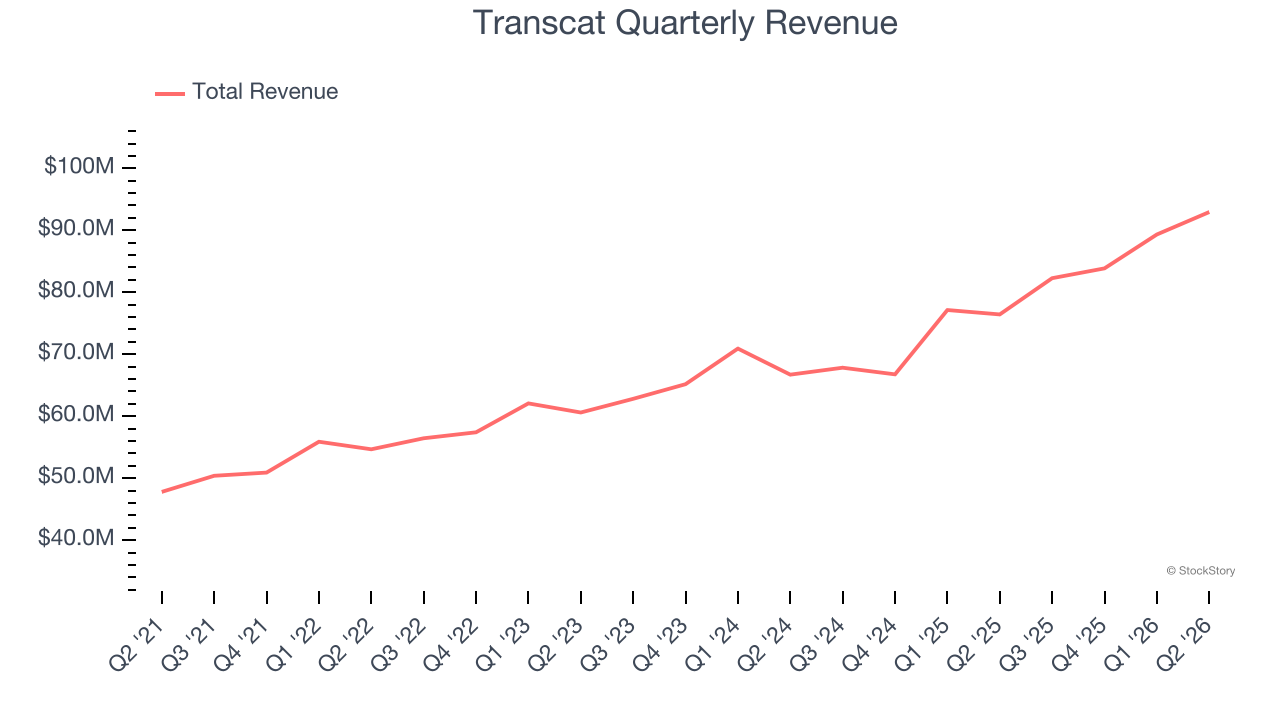
Long-term growth is the most important, but within industrials, a half-decade historical view may miss new industry trends or demand cycles. Transcat’s annualized revenue growth of 14.5% over the last two years aligns with its five-year trend, suggesting its demand was predictably strong. 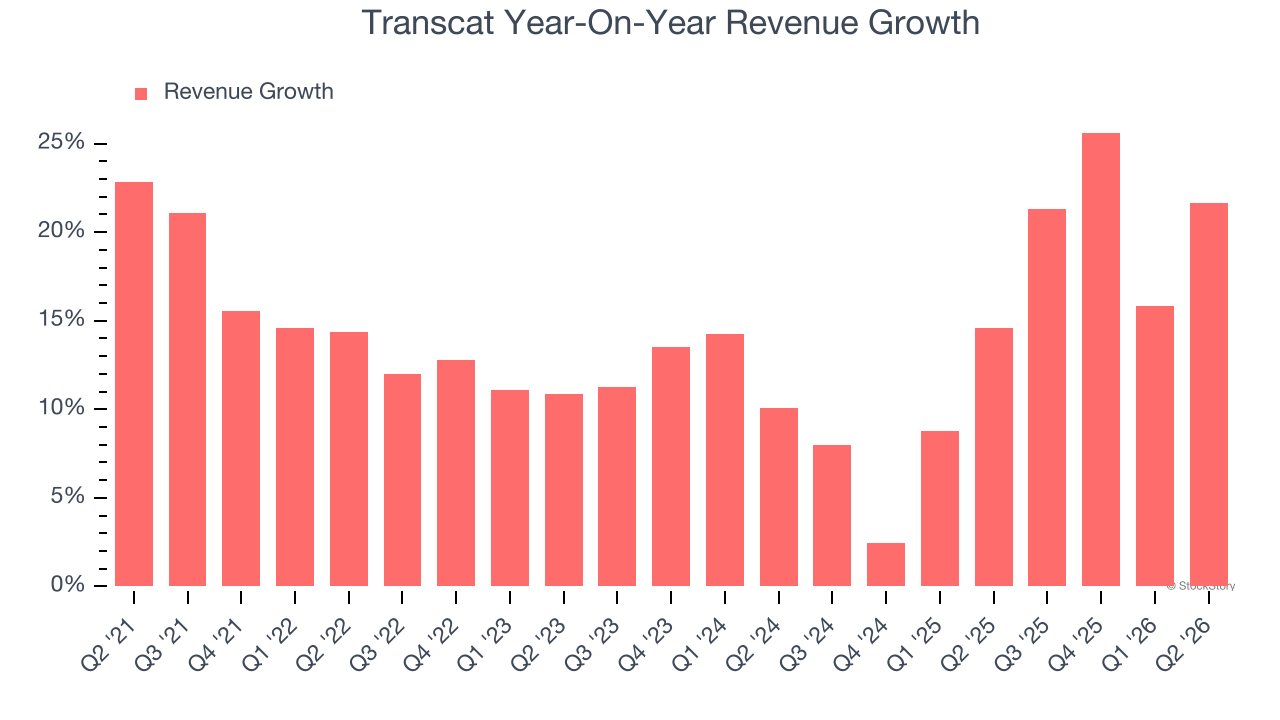
This quarter, Transcat reported robust year-on-year revenue growth of 21.6%, and its $92.95 million of revenue topped Wall Street estimates by 7.4%.
Looking ahead, sell-side analysts expect revenue to grow 6% over the next 12 months, a deceleration versus the last two years. This projection is underwhelming and suggests its products and services will face some demand challenges.
ONE MORE THING: 3 Hidden Platforms Growing 3X Faster than Amazon, Google, and PayPal. Amazon, Google, and Meta all followed the same playbook: Dominate an ignored market. Build an unbeatable moat. Scale until you’re unstoppable.
These three platforms are running that exact playbook right now. The early investors in Amazon made fortunes. The early investors in these could do the same. Get All 3 Stocks Here for FREE.
Operating Margin
Transcat was profitable over the last five years but held back by its large cost base. Its average operating margin of 6.3% was weak for an industrials business.
Analyzing the trend in its profitability, Transcat’s operating margin decreased by 3.4 percentage points over the last five years. This raises questions about the company’s expense base because its revenue growth should have given it leverage on its fixed costs, resulting in better economies of scale and profitability. Transcat’s performance was poor no matter how you look at it - it shows that costs were rising and it couldn’t pass them onto its customers.
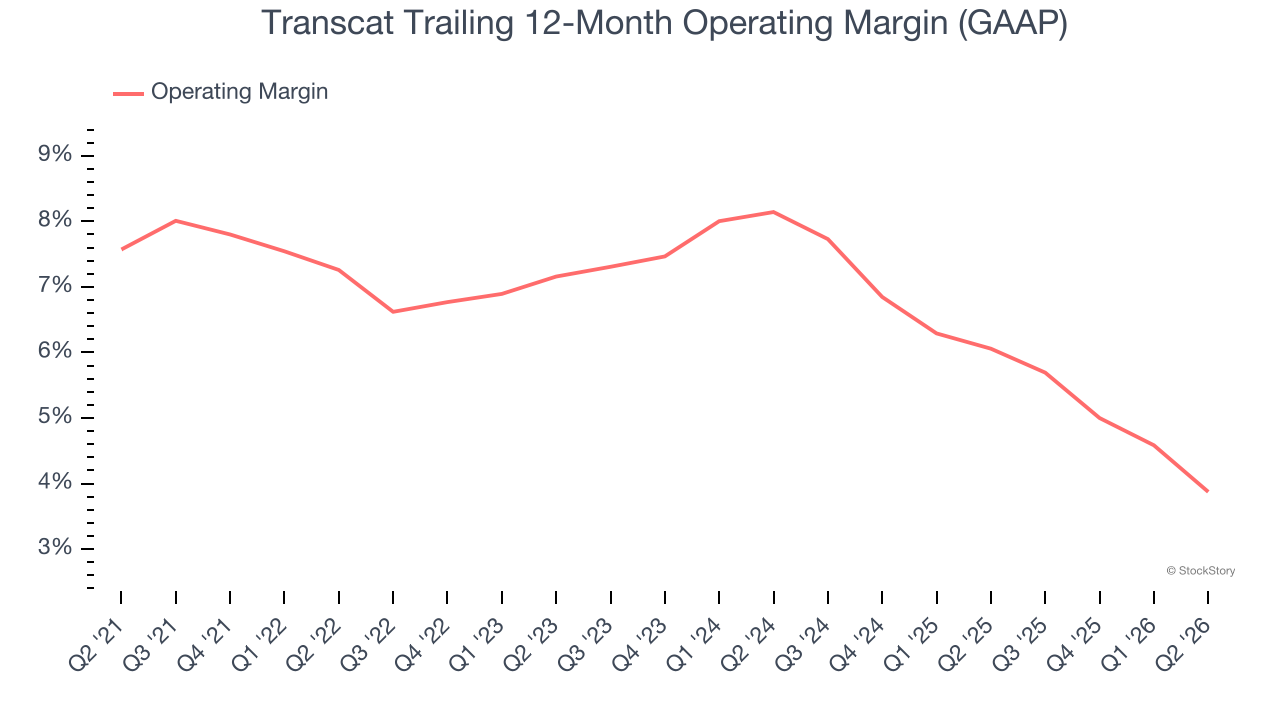
This quarter, Transcat generated an operating margin profit margin of 4%, down 3.1 percentage points year on year. Since Transcat’s operating margin decreased more than its gross margin, we can assume it was less efficient because expenses such as marketing, R&D, and administrative overhead increased.
Earnings Per Share
We track the long-term change in earnings per share (EPS) for the same reason as long-term revenue growth. Compared to revenue, however, EPS highlights whether a company’s growth is profitable.
Transcat’s EPS grew at an unimpressive 4.1% compounded annual growth rate over the last five years, lower than its 13.8% annualized revenue growth. This tells us the company became less profitable on a per-share basis as it expanded.
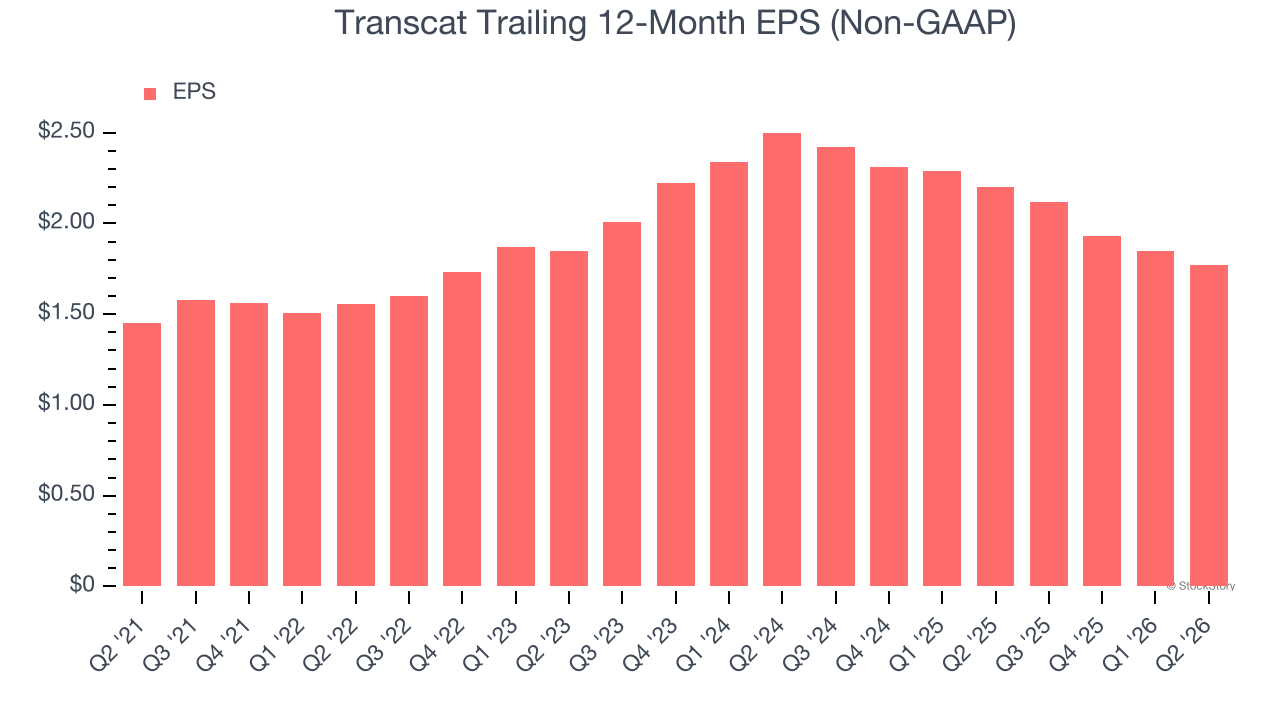
Diving into the nuances of Transcat’s earnings can give us a better understanding of its performance. As we mentioned earlier, Transcat’s operating margin declined by 3.4 percentage points over the last five years. Its share count also grew by 24.8%, meaning the company not only became less efficient with its operating expenses but also diluted its shareholders. 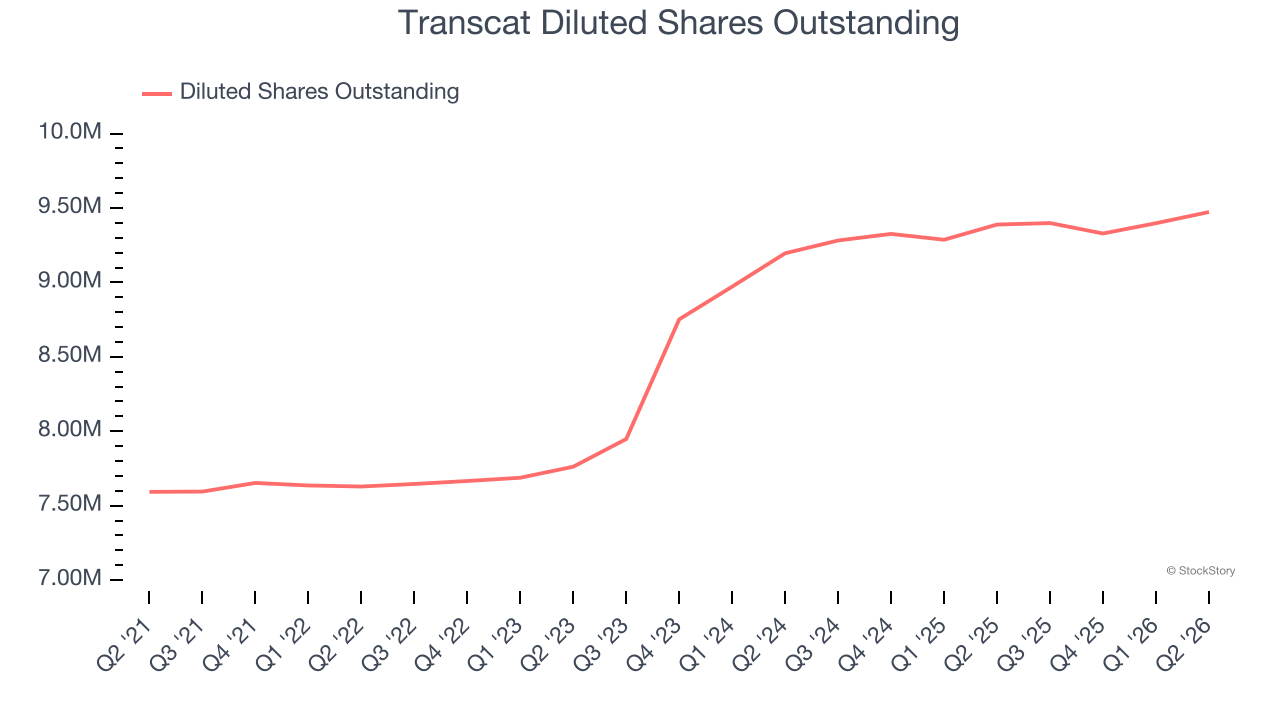
Like with revenue, we analyze EPS over a more recent period because it can provide insight into an emerging theme or development for the business.
For Transcat, its two-year annual EPS declines of 15.9% show it’s continued to underperform. These results were bad no matter how you slice the data.
In Q2, Transcat reported adjusted EPS of $0.51, down from $0.59 in the same quarter last year. Despite falling year on year, this print easily cleared analysts’ estimates. Over the next 12 months, Wall Street expects Transcat’s full-year EPS to grow 1.8% from $1.77 to $1.80.
Key Takeaways from Transcat’s Q2 Results
It was good to see Transcat beat analysts’ EPS expectations this quarter. We were also excited its EBITDA outperformed Wall Street’s estimates by a wide margin. Zooming out, we think this was a good print with some key areas of upside. The stock remained flat at $91.70 immediately after reporting.
Indeed, Transcat had a rock-solid quarterly earnings result, but is this stock a good investment here? We think that the latest quarter is only one piece of the longer-term business quality puzzle. Quality, when combined with valuation, can help determine if the stock is a buy. We cover that in our actionable full research report which you can read here (it’s free).