Footwear and apparel conglomerate Deckers (NYSE: DECK) met Wall Street’s revenue expectations in Q2 CY2026, with sales up 5.7% year on year to $1.02 billion. The company’s outlook for the full year was close to analysts’ estimates with revenue guided to $5.89 billion at the midpoint. Its GAAP profit of $0.94 per share was 7.3% above analysts’ consensus estimates.
Is now the time to buy Deckers? Find out by accessing our full research report, it’s free.
Deckers (DECK) Q2 CY2026 Highlights:
- Revenue: $1.02 billion vs analyst estimates of $1.02 billion (5.7% year-on-year growth, in line)
- EPS (GAAP): $0.94 vs analyst estimates of $0.88 (7.3% beat)
- The company reconfirmed its revenue guidance for the full year of $5.89 billion at the midpoint
- EPS (GAAP) guidance for the full year is $7.43 at the midpoint, missing analyst estimates by 1%
- Operating Margin: 15.2%, down from 17.1% in the same quarter last year
- Constant Currency Revenue rose 4.8% year on year (16.3% in the same quarter last year)
- Market Capitalization: $14.23 billion
Company Overview
Established in 1973, Deckers (NYSE: DECK) is a footwear and apparel conglomerate with a portfolio of lifestyle and performance brands.
Revenue Growth
A company’s long-term sales performance can indicate its overall quality. Any business can put up a good quarter or two, but many enduring ones grow for years. Over the last five years, Deckers grew its sales at a 14.8% compounded annual growth rate. Though this growth is acceptable on an absolute basis, we need to see more than just topline growth for the consumer discretionary sector, which can display significant earnings volatility. This means our bar for the sector is particularly high, reflecting the non-essential and hit-driven nature of the products and services offered. Additionally, five-year CAGR starts around Covid, when revenue was depressed then rebounded.
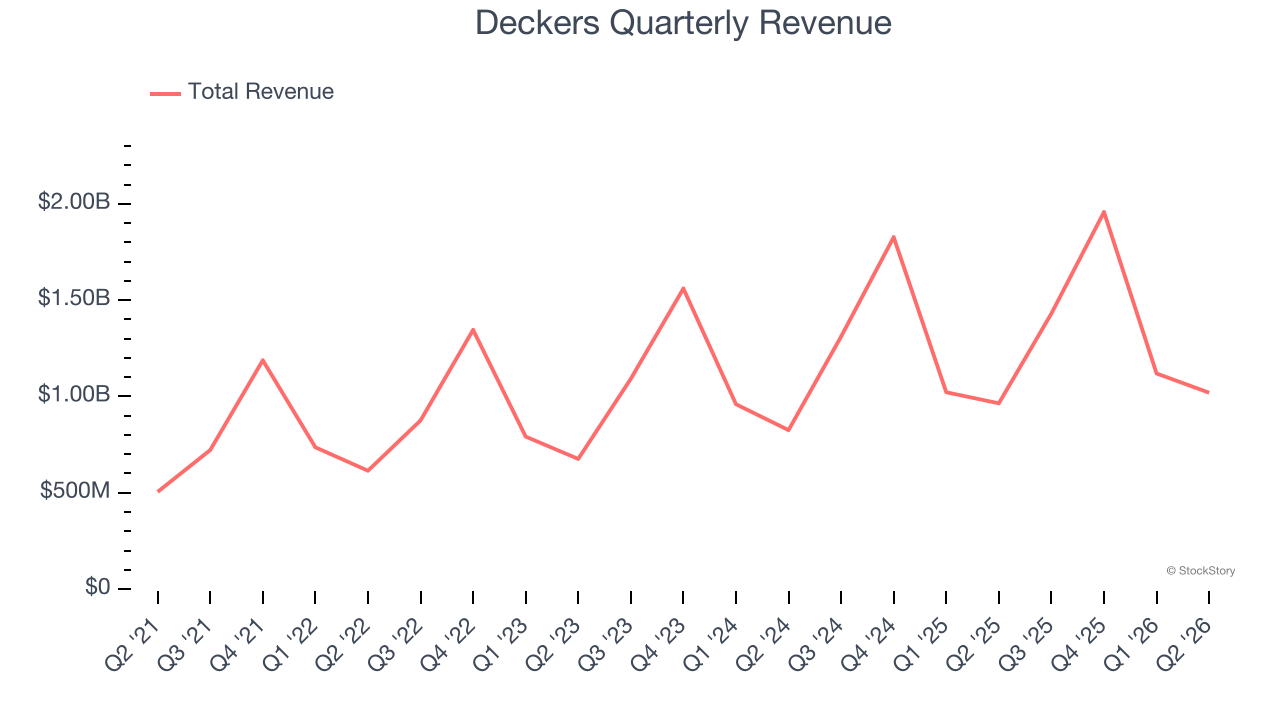
Long-term growth is the most important, but within consumer discretionary, product cycles are short and revenue can be hit-driven due to rapidly changing trends and consumer preferences. Deckers’s recent performance shows its demand has slowed as its annualized revenue growth of 11.6% over the last two years was below its five-year trend. We’re wary when companies in the sector see decelerations in revenue growth, as it could signal changing consumer tastes aided by low switching costs. 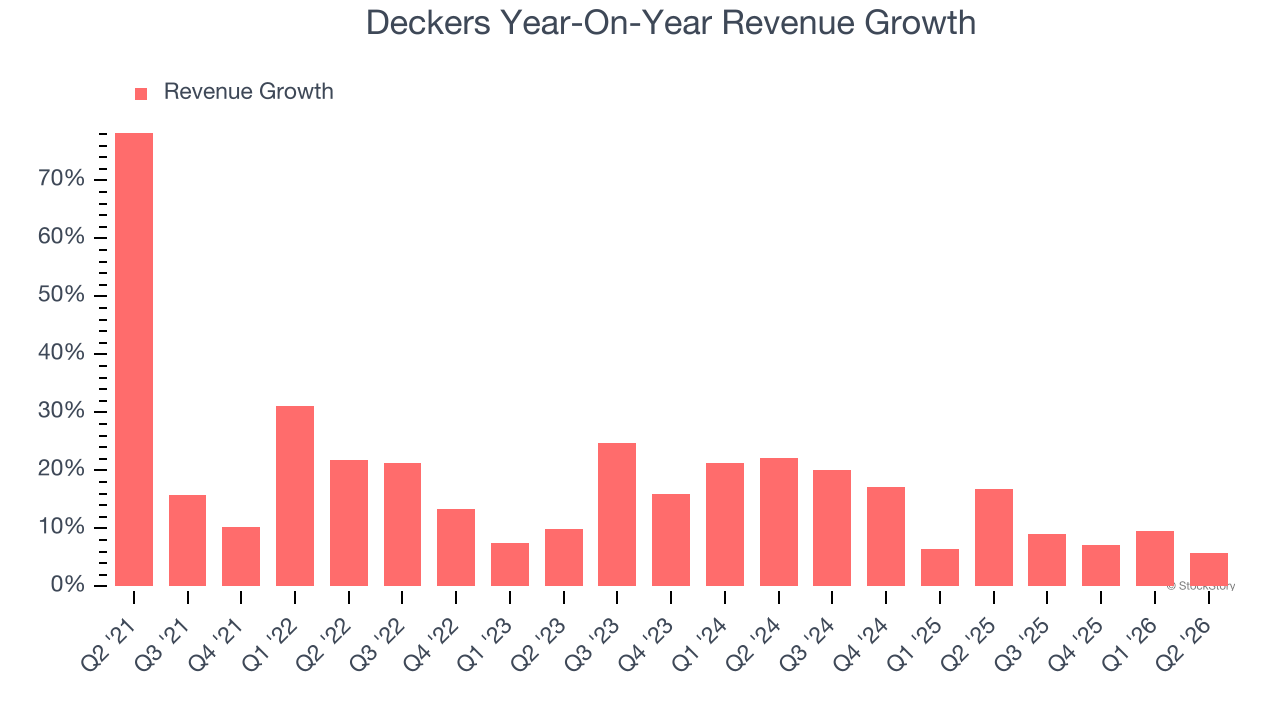
Deckers also reports sales performance excluding currency movements, which are outside the company’s control and not indicative of demand. Over the last two years, its constant currency sales averaged 11.1% year-on-year growth. Because this number aligns with its reported revenue growth, we can see that foreign exchange has not had a meaningful impact on topline. 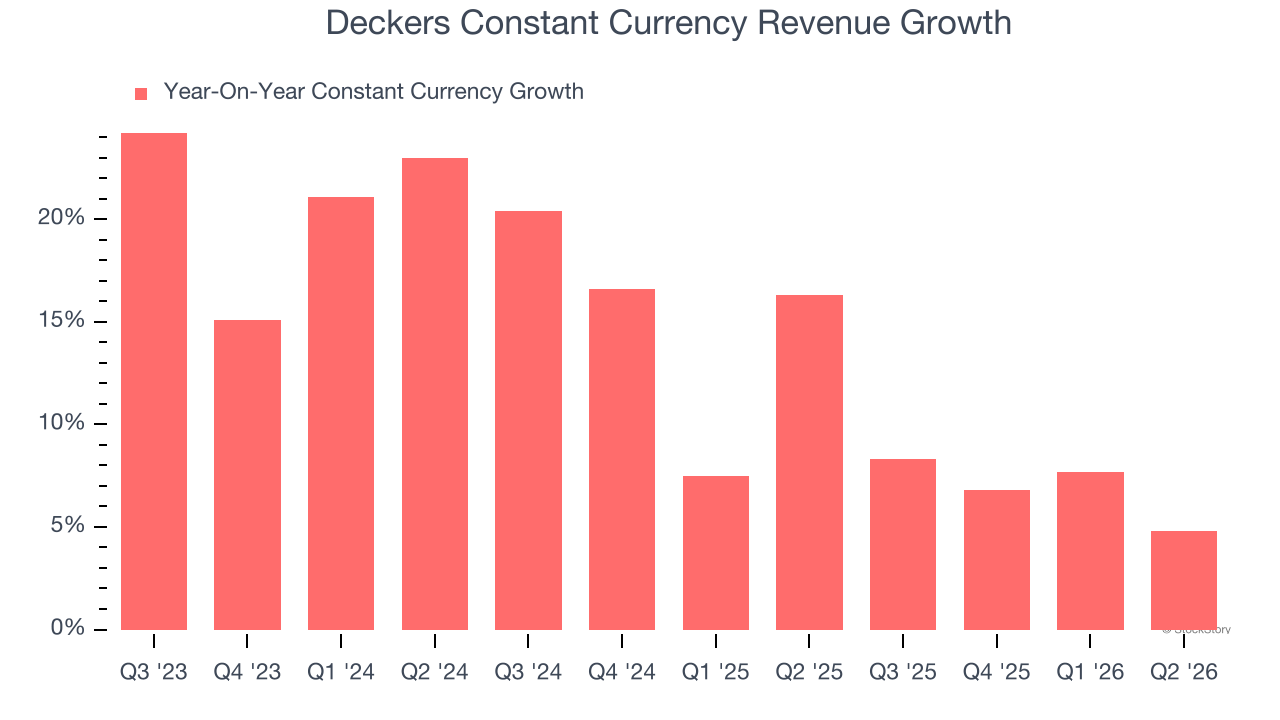
This quarter, Deckers grew its revenue by 5.7% year on year, and its $1.02 billion of revenue was in line with Wall Street’s estimates.
Looking ahead, sell-side analysts expect revenue to grow 8.3% over the next 12 months, a deceleration versus the last two years. This projection is underwhelming and implies its products and services will see some demand headwinds.
ALSO WORTH WATCHING: Nvidia’s Quiet Partner. Nvidia’s chips cost a hundred grand. The connectors that make them work cost even more. One company makes them all.
Every AI server needs specialized infrastructure the chip companies don’t make. High-speed cables. Power connectors. Thermal sensors. This 90-year-old company built a monopoly on it. The AI boom just started. This stock is still flying under the radar. Claim The Stock Ticker Here for FREE.
Operating Margin
Operating margin is an important measure of profitability as it shows the portion of revenue left after accounting for all core expenses — everything from the cost of goods sold to advertising and wages. It’s also useful for comparing profitability across companies with different levels of debt and tax rates because it excludes interest and taxes.
Deckers’s operating margin has shrunk over the last 12 months and averaged 23.2% over the last two years. The company’s profitability was mediocre for a consumer discretionary business and shows it couldn’t pass its higher operating expenses onto its customers.
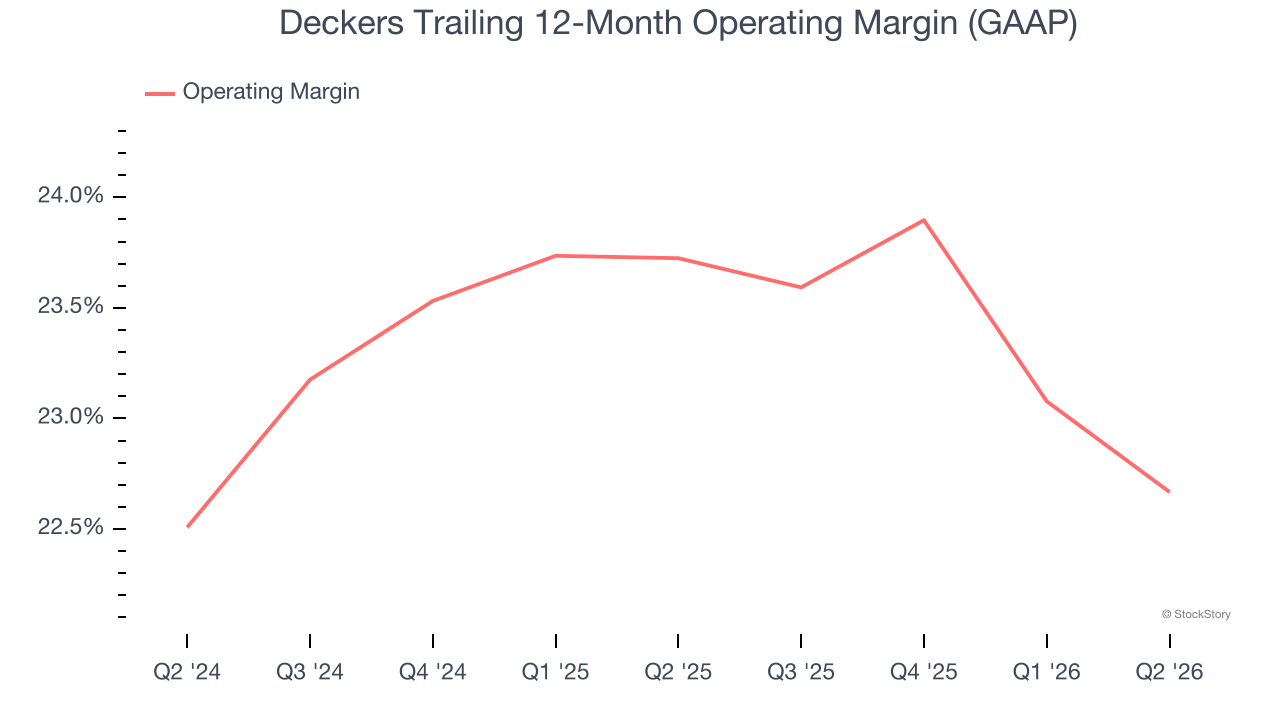
This quarter, Deckers generated an operating margin profit margin of 15.2%, down 1.9 percentage points year on year. This reduction is quite minuscule and indicates the company’s overall cost structure has been relatively stable.
Earnings Per Share
We track the long-term change in earnings per share (EPS) for the same reason as long-term revenue growth. Compared to revenue, however, EPS highlights whether a company’s growth is profitable.
Deckers’s EPS grew at 22.3% compounded annual growth rate over the last five years. On the bright side, this performance was better than its 14.8% annualized revenue growth and tells us the company became more profitable on a per-share basis as it expanded.
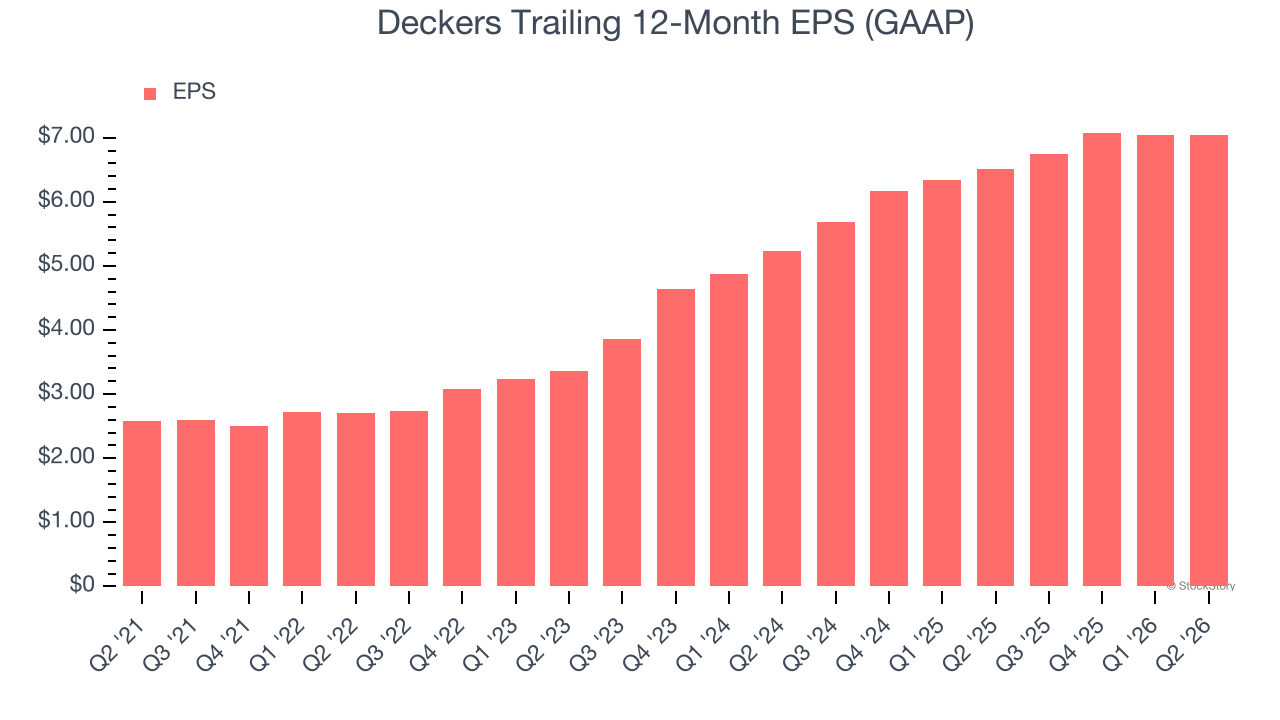
In Q2, Deckers reported EPS of $0.94, in line with the same quarter last year. This print beat analysts’ estimates by 7.3%. Over the next 12 months, Wall Street expects Deckers’s full-year EPS to grow 7.8% from $7.05 to $7.60.
Key Takeaways from Deckers’s Q2 Results
It was good to see Deckers beat analysts’ EPS expectations this quarter despite in-line revenue. Looking ahead, its full-year revenue guidance was in line and its full-year EPS guidance fell slightly short of Wall Street’s estimates. Overall, this quarter was mixed. The stock remained flat at $97.25 immediately following the results.
Big picture, is Deckers a buy here and now? When making that decision, it’s important to consider its valuation, business qualities, as well as what has happened in the latest quarter. We cover that in our actionable full research report which you can read here (it’s free).