
Automotive services company Driven Brands (NASDAQ: DRVN) reported Q1 CY2026 results exceeding the market’s revenue expectations, with sales up 8.2% year on year to $484.4 million. The company expects the full year’s revenue to be around $2 billion, close to analysts’ estimates. Its non-GAAP profit of $0.30 per share was 24.4% above analysts’ consensus estimates.
Is now the time to buy Driven Brands? Find out by accessing our full research report, it’s free.
Driven Brands (DRVN) Q1 CY2026 Highlights:
- Revenue: $484.4 million vs analyst estimates of $481.3 million (8.2% year-on-year growth, 0.6% beat)
- Adjusted EPS: $0.30 vs analyst estimates of $0.24 (24.4% beat)
- Adjusted EBITDA: $104.1 million vs analyst estimates of $97.55 million (21.5% margin, 6.7% beat)
- The company reconfirmed its revenue guidance for the full year of $2 billion at the midpoint
- Management reiterated its full-year Adjusted EPS guidance of $1.20 at the midpoint
- EBITDA guidance for the full year is $445 million at the midpoint, in line with analyst expectations
- Operating Margin: 13.9%, up from 12.2% in the same quarter last year
- Free Cash Flow Margin: 4.8%, up from 3.6% in the same quarter last year
- Same-Store Sales rose 2.1% year on year (-0.2% in the same quarter last year)
- Market Capitalization: $2.23 billion
“Driven Brands delivered a solid start to 2026, with growth across revenue, Adjusted EBITDA and Adjusted EPS,” said Danny Rivera, President and Chief Executive Officer.
Company Overview
With approximately 5,000 locations across 49 U.S. states and 13 other countries, Driven Brands (NASDAQ: DRVN) operates a network of automotive service centers offering maintenance, car washes, paint, collision repair, and glass services across North America.
Revenue Growth
Examining a company’s long-term performance can provide clues about its quality. Any business can put up a good quarter or two, but the best consistently grow over the long haul.
With $1.9 billion in revenue over the past 12 months, Driven Brands is a mid-sized business services company, which sometimes brings disadvantages compared to larger competitors benefiting from better economies of scale. On the bright side, it can still flex high growth rates because it’s working from a smaller revenue base.
As you can see below, Driven Brands grew its sales at an excellent 12.5% compounded annual growth rate over the last five years. This shows it had high demand, a useful starting point for our analysis.
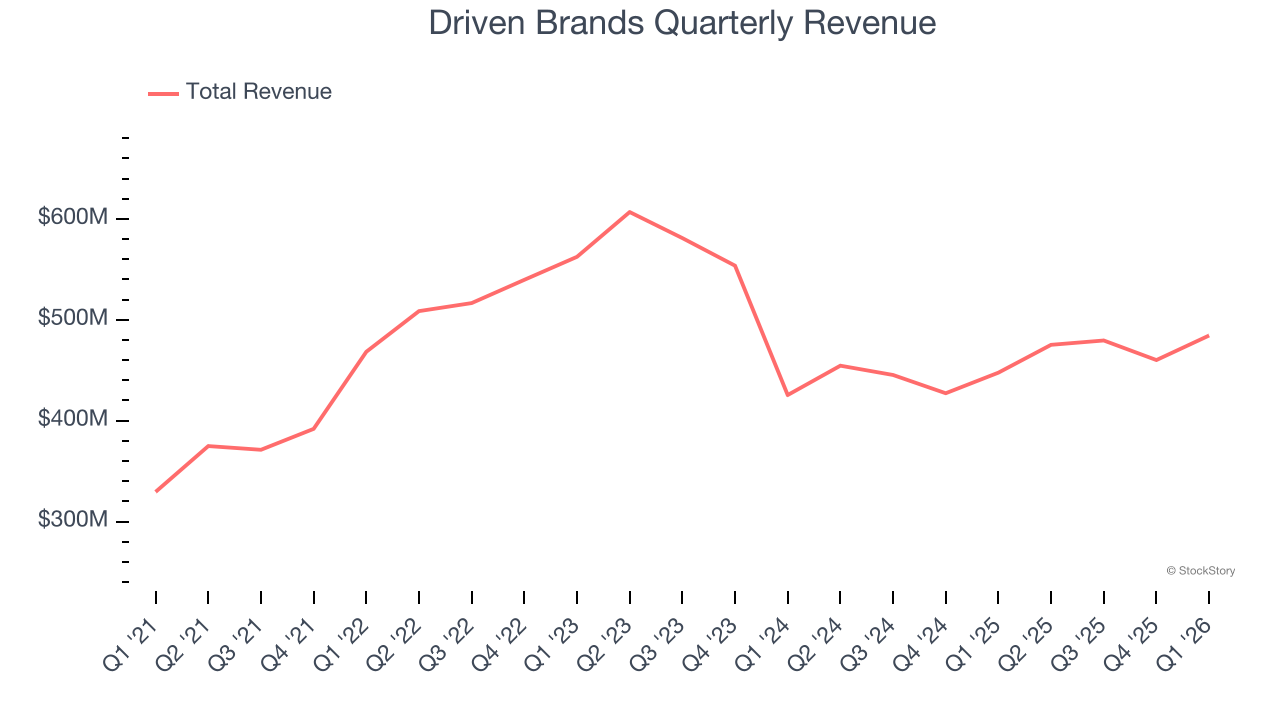
Long-term growth is the most important, but within business services, a half-decade historical view may miss new innovations or demand cycles. Driven Brands’s recent performance marks a sharp pivot from its five-year trend as its revenue has shown annualized declines of 6.4% over the last two years. 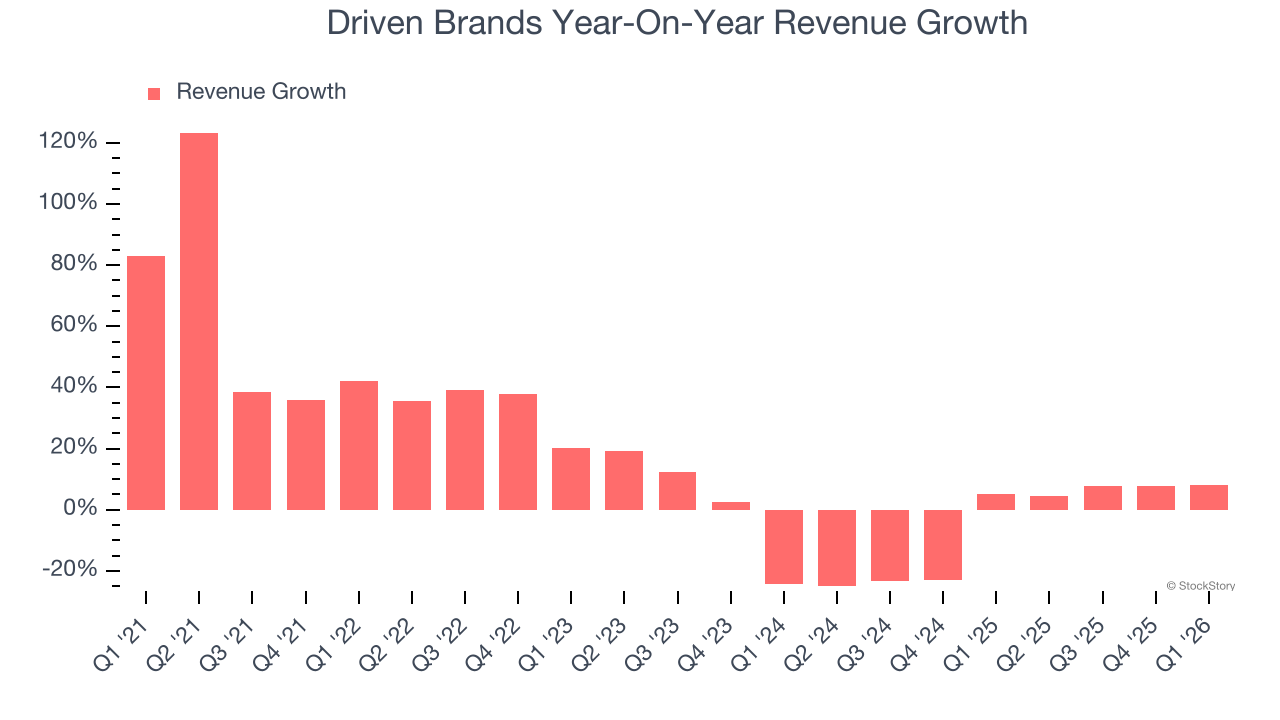
We can dig further into the company’s revenue dynamics by analyzing its same-store sales, which show how much revenue its established locations generate. Over the last two years, Driven Brands’s same-store sales averaged 1.4% year-on-year growth. Because this number is better than its revenue growth, we can see its sales from existing locations are performing better than its sales from new locations. 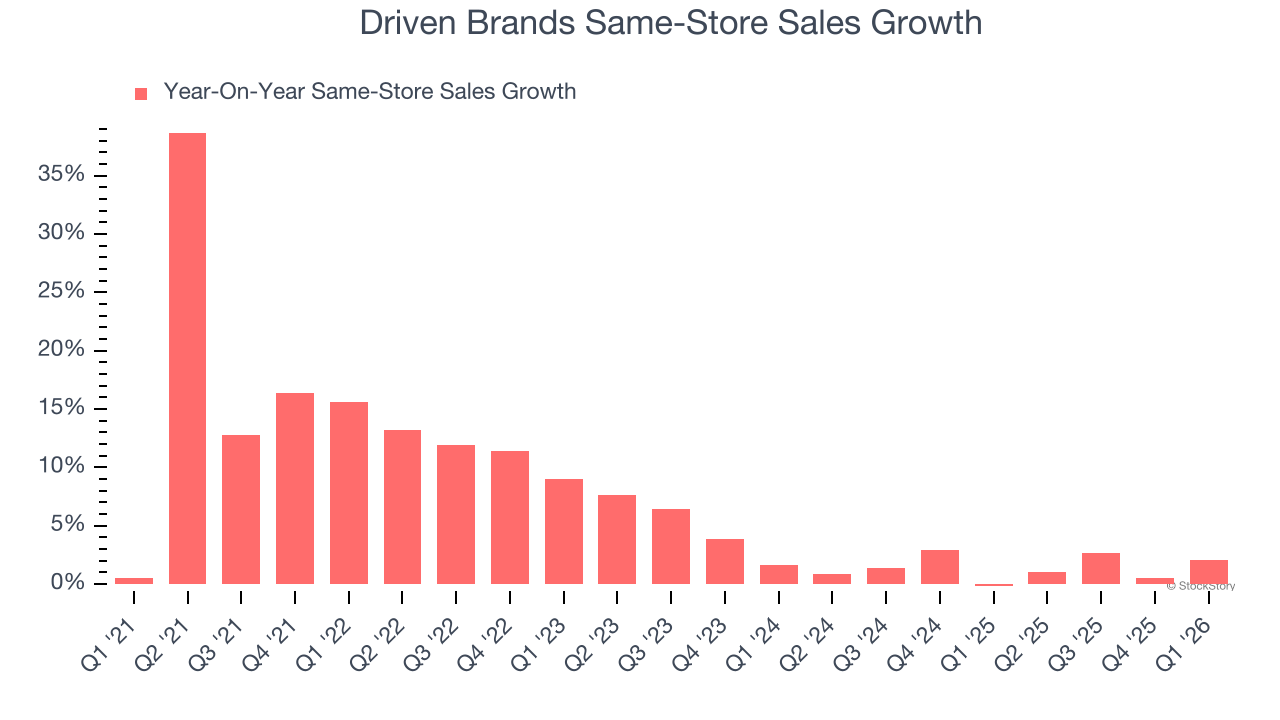
This quarter, Driven Brands reported year-on-year revenue growth of 8.2%, and its $484.4 million of revenue exceeded Wall Street’s estimates by 0.6%.
Looking ahead, sell-side analysts expect revenue to grow 7.7% over the next 12 months, an improvement versus the last two years. This projection is noteworthy and implies its newer products and services will catalyze better top-line performance.
ONE MORE THING: The $21 AI Application Stock Wall Street Forgot. While Wall Street obsesses over who’s building AI, one company is already using it to print money. And nobody’s paying attention.
AI chip stocks trade at ridiculous valuations. This company processes a trillion consumer signals monthly using AI and trades at a third of the price. The gap won’t last. The institutions will figure it out. You need to see this first. Read the FREE Report Before They Notice.
Adjusted Operating Margin
Adjusted operating margin is one of the best measures of profitability because it tells us how much money a company takes home after subtracting all core expenses, like marketing and R&D. It also removes various one-time costs to paint a better picture of normalized profits.
Driven Brands’s adjusted operating margin has more or less stayed the same over the last 12 months , averaging 18.9% over the last five years. This profitability was elite for a business services business thanks to its efficient cost structure and economies of scale.
Looking at the trend in its profitability, Driven Brands’s adjusted operating margin might have fluctuated slightly but has generally stayed the same over the last five years. This raises questions about the company’s expense base because its revenue growth should have given it leverage on its fixed costs, resulting in better economies of scale and profitability.
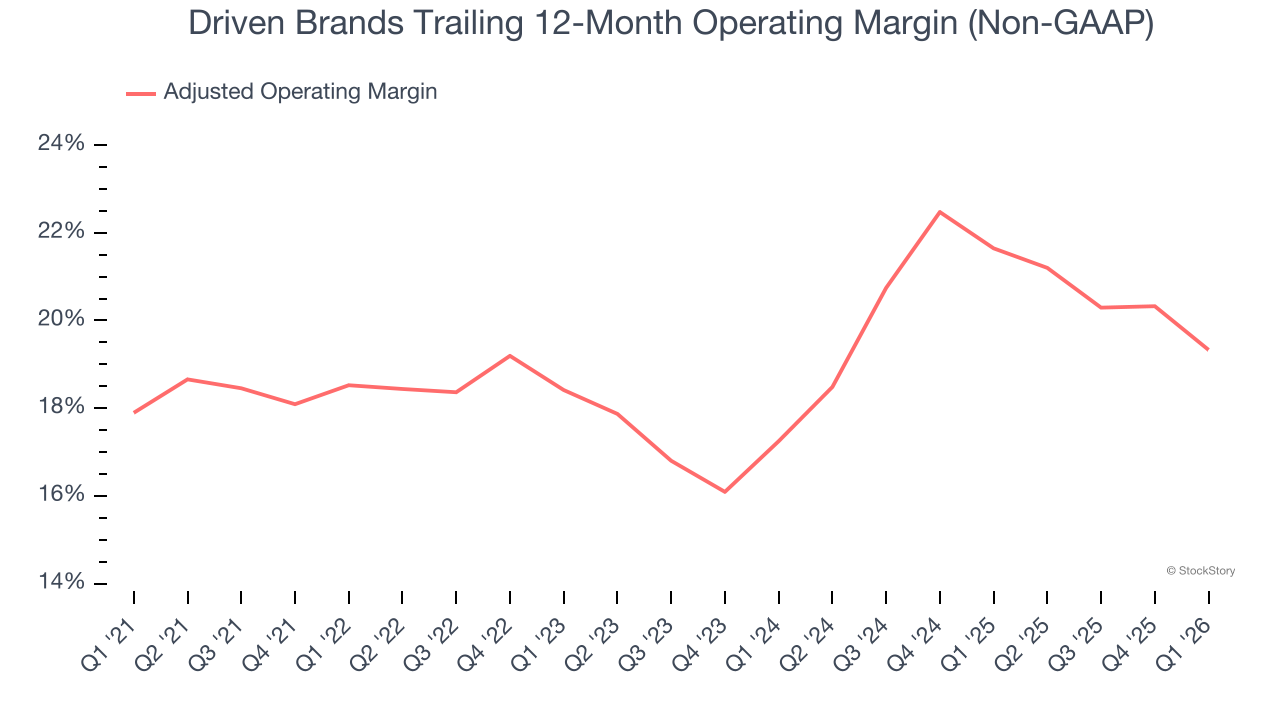
In Q1, Driven Brands generated an adjusted operating margin profit margin of 15.1%, down 3.8 percentage points year on year. This contraction shows it was less efficient because its expenses grew faster than its revenue.
Earnings Per Share
We track the long-term change in earnings per share (EPS) for the same reason as long-term revenue growth. Compared to revenue, however, EPS highlights whether a company’s growth is profitable.
Driven Brands’s EPS grew at 26.2% compounded annual growth rate over the last five years, higher than its 12.5% annualized revenue growth. However, we take this with a grain of salt because its adjusted operating margin didn’t improve and it didn’t repurchase its shares, meaning the delta came from reduced interest expenses or taxes.
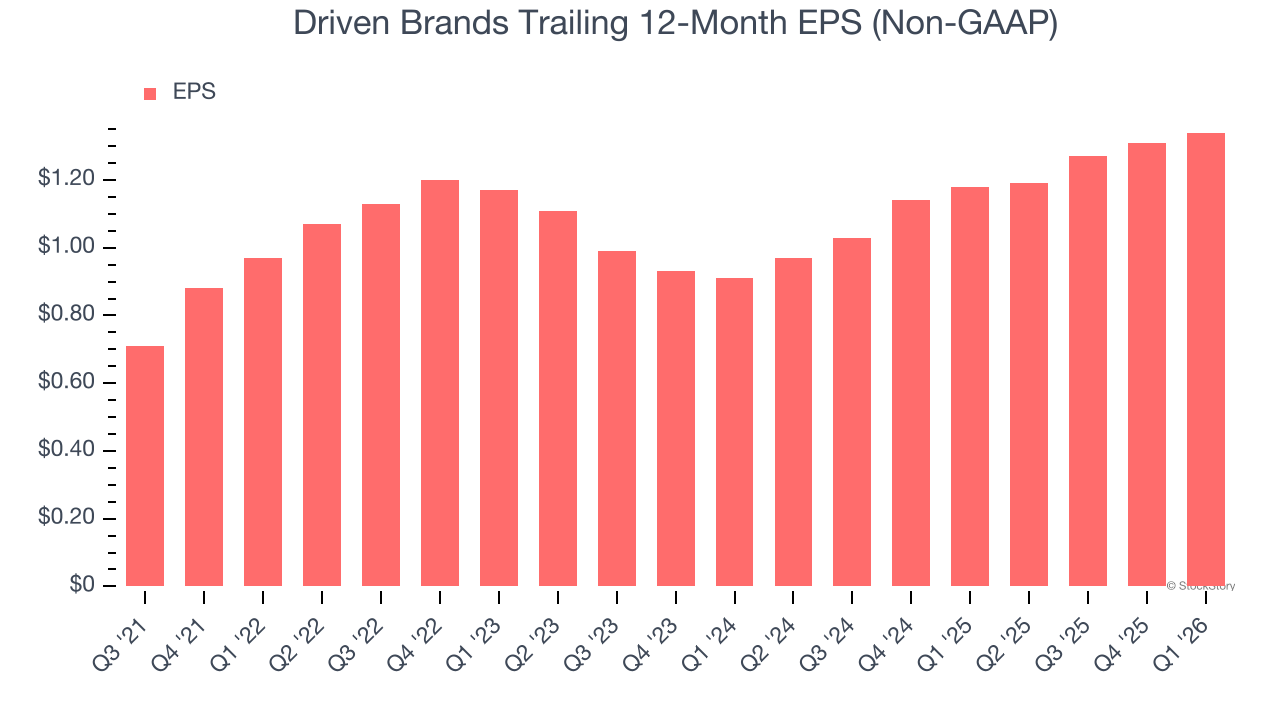
Like with revenue, we analyze EPS over a more recent period because it can provide insight into an emerging theme or development for the business.
For Driven Brands, its two-year annual EPS growth of 21.3% was lower than its five-year trend. We still think its growth was good and hope it can accelerate in the future.
In Q1, Driven Brands reported adjusted EPS of $0.30, up from $0.27 in the same quarter last year. This print easily cleared analysts’ estimates, and shareholders should be content with the results. Over the next 12 months, Wall Street expects Driven Brands’s full-year EPS to shrink by 4.9% from $1.34 to $1.27.
Key Takeaways from Driven Brands’s Q1 Results
It was good to see Driven Brands beat analysts’ EPS expectations this quarter. We were also happy its revenue narrowly outperformed Wall Street’s estimates. Overall, we think this was a decent quarter with some key metrics above expectations. The stock traded up 5.8% to $14.32 immediately after reporting.
Indeed, Driven Brands had a rock-solid quarterly earnings result, but is this stock a good investment here? When making that decision, it’s important to consider its valuation, business qualities, as well as what has happened in the latest quarter. We cover that in our actionable full research report which you can read here (it’s free).