Professional services firm Marsh (NYSE: MRSH) reported Q1 CY2026 results beating Wall Street’s revenue expectations, with sales up 7.6% year on year to $7.60 billion. Its non-GAAP profit of $3.29 per share was 2.1% above analysts’ consensus estimates.
Is now the time to buy Marsh? Find out by accessing our full research report, it’s free.
Marsh (MRSH) Q1 CY2026 Highlights:
- Revenue: $7.60 billion vs analyst estimates of $7.38 billion (7.6% year-on-year growth, 2.9% beat)
- Adjusted EPS: $3.29 vs analyst estimates of $3.22 (2.1% beat)
- Operating Margin: 23.1%, down from 28.4% in the same quarter last year
- Free Cash Flow was -$750 million compared to -$677 million in the same quarter last year
- Organic Revenue rose 4% year on year (beat)
- Market Capitalization: $84.67 billion
John Doyle, President and CEO, said: "We had a solid start to the year, and I am pleased with our execution in a dynamic and challenging environment. For the quarter, we generated 8% overall revenue growth, 4% underlying revenue growth, 8% adjusted operating income growth, and 8% adjusted EPS growth."
Company Overview
With roots dating back to 1871 and a presence in over 130 countries, Marsh (NYSE: MRSH) is a global professional services firm that helps organizations manage risk, strategy, and workforce challenges through its four specialized businesses.
Revenue Growth
A company’s long-term sales performance can indicate its overall quality. Any business can put up a good quarter or two, but the best consistently grow over the long haul.
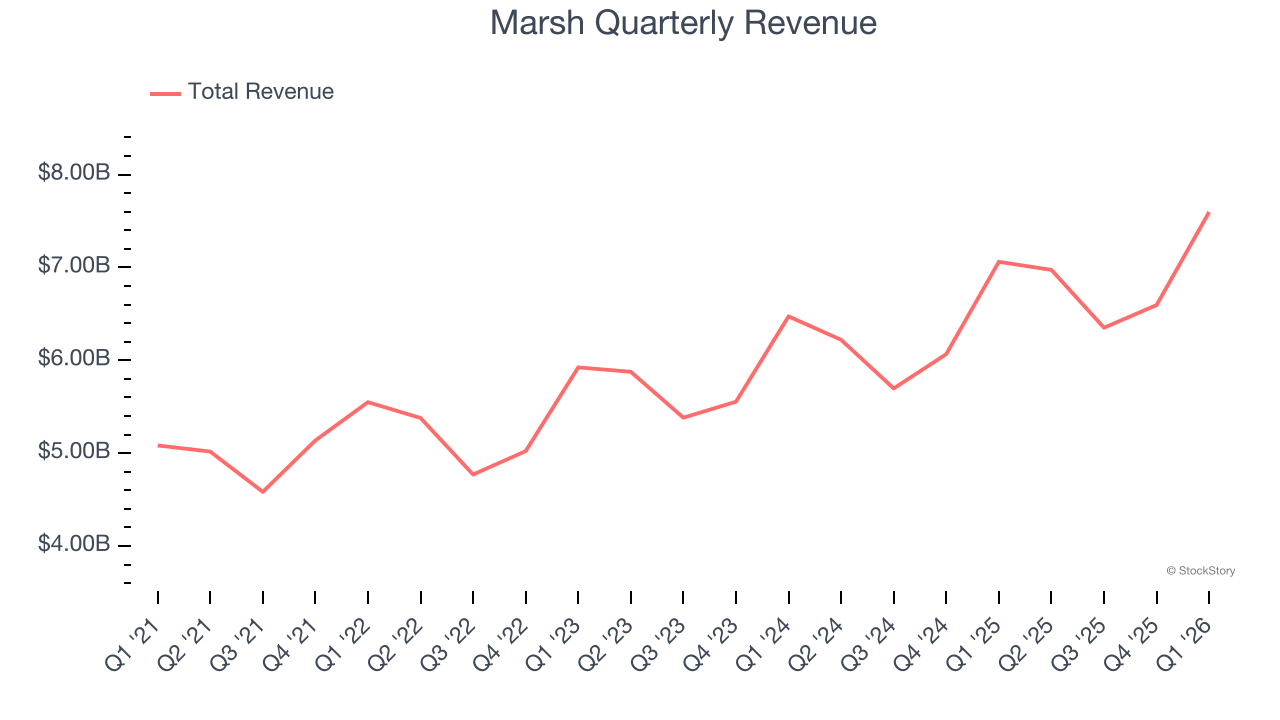
With $27.52 billion in revenue over the past 12 months, Marsh is a behemoth in the business services sector and benefits from economies of scale, giving it an edge in distribution. This also enables it to gain more leverage on its fixed costs than smaller competitors and the flexibility to offer lower prices.
As you can see below, Marsh’s 9.3% annualized revenue growth over the last five years was impressive. This is a great starting point for our analysis because it shows Marsh’s demand was higher than many business services companies.
Long-term growth is the most important, but within business services, a half-decade historical view may miss new innovations or demand cycles. Marsh’s annualized revenue growth of 8.7% over the last two years aligns with its five-year trend, suggesting its demand was predictably strong. 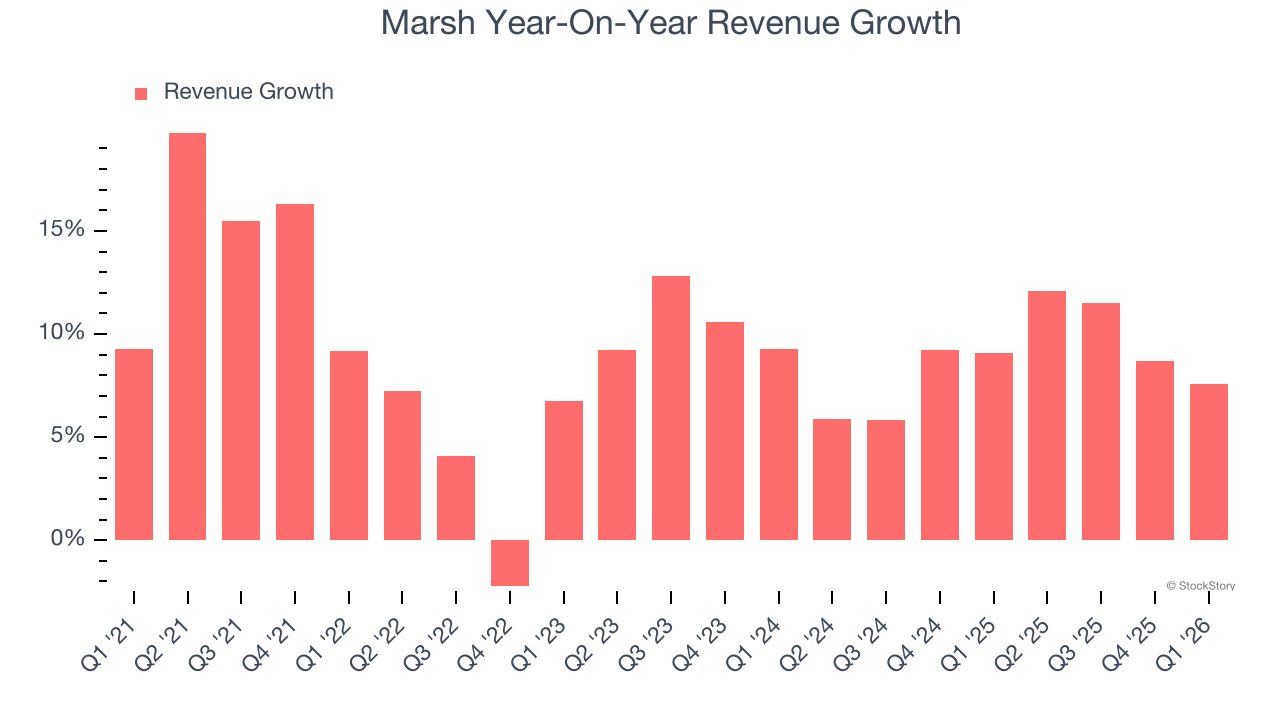
We can better understand the company’s sales dynamics by analyzing its organic revenue, which strips out one-time events like acquisitions and currency fluctuations that don’t accurately reflect its fundamentals. Over the last two years, Marsh’s organic revenue averaged 4.8% year-on-year growth. Because this number is lower than its two-year revenue growth, we can see that some mixture of acquisitions and foreign exchange rates boosted its headline results. 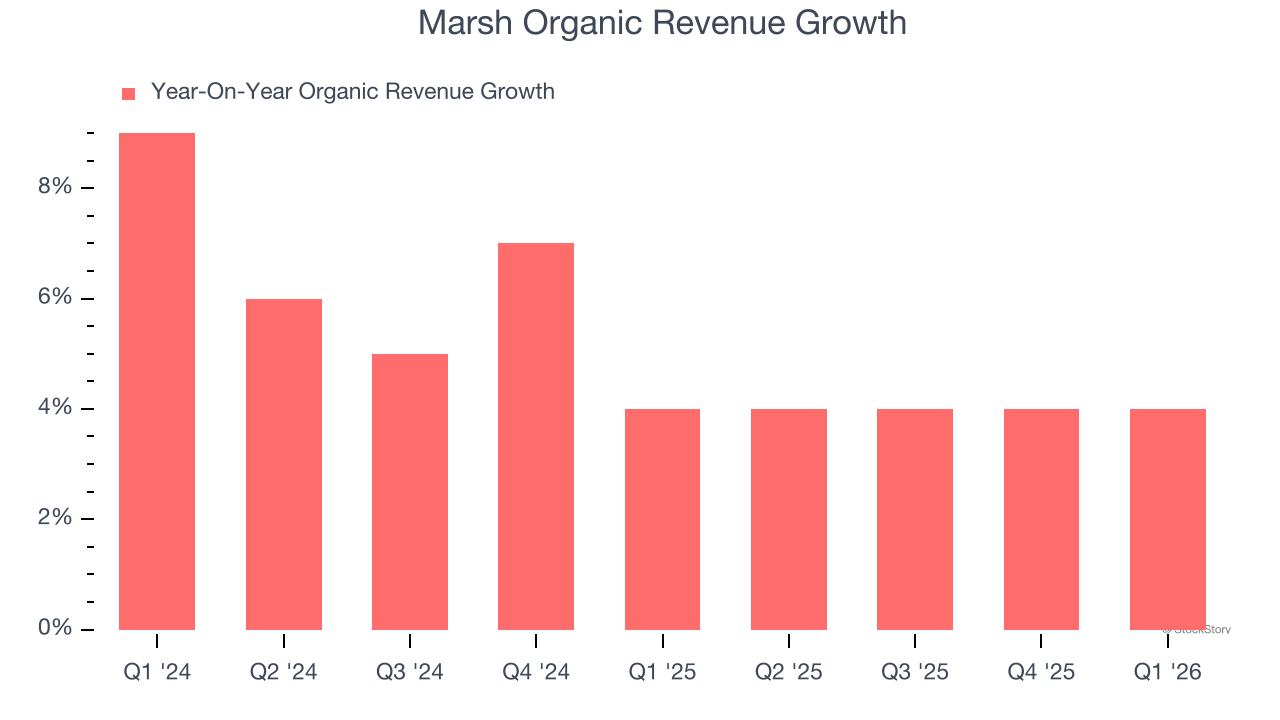
This quarter, Marsh reported year-on-year revenue growth of 7.6%, and its $7.60 billion of revenue exceeded Wall Street’s estimates by 2.9%.
Looking ahead, sell-side analysts expect revenue to grow 4% over the next 12 months, a deceleration versus the last two years. This projection doesn't excite us and suggests its products and services will see some demand headwinds. At least the company is tracking well in other measures of financial health.
ALSO WORTH WATCHING: Nvidia’s Quiet Partner. Nvidia’s chips cost a hundred grand. The connectors that make them work cost even more. One company makes them all.
Every AI server needs specialized infrastructure the chip companies don’t make. High-speed cables. Power connectors. Thermal sensors. This 90-year-old company built a monopoly on it. The AI boom just started. This stock is still flying under the radar. Claim The Stock Ticker Here for FREE.
Adjusted Operating Margin
Adjusted operating margin is an important measure of profitability as it shows the portion of revenue left after accounting for all core expenses – everything from the cost of goods sold to advertising and wages. It’s also useful for comparing profitability across companies because it excludes non-recurring expenses, interest on debt, and taxes.
Marsh has been a well-oiled machine over the last five years. It demonstrated elite profitability for a business services business, boasting an average adjusted operating margin of 25.5%.
Looking at the trend in its profitability, Marsh’s adjusted operating margin rose by 1.6 percentage points over the last five years, as its sales growth gave it operating leverage.
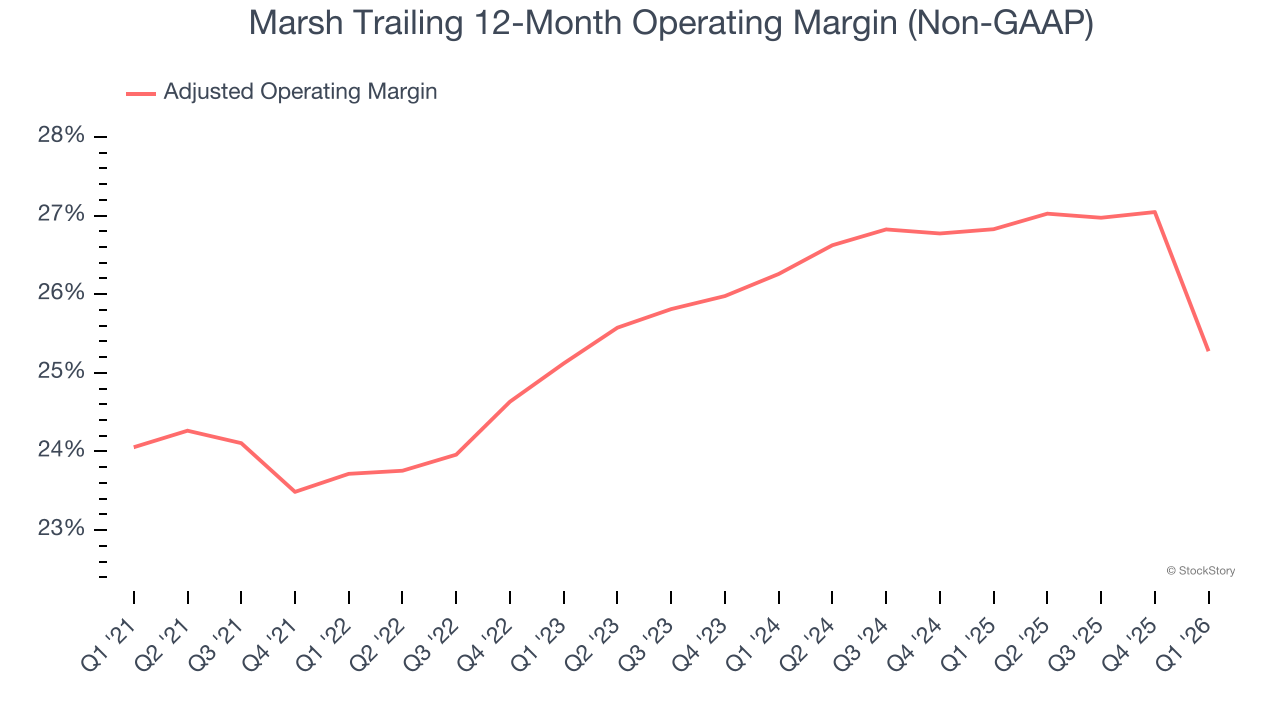
This quarter, Marsh generated an adjusted operating margin profit margin of 24.9%, down 6.7 percentage points year on year. This contraction shows it was less efficient because its expenses grew faster than its revenue.
Earnings Per Share
We track the long-term change in earnings per share (EPS) for the same reason as long-term revenue growth. Compared to revenue, however, EPS highlights whether a company’s growth is profitable.
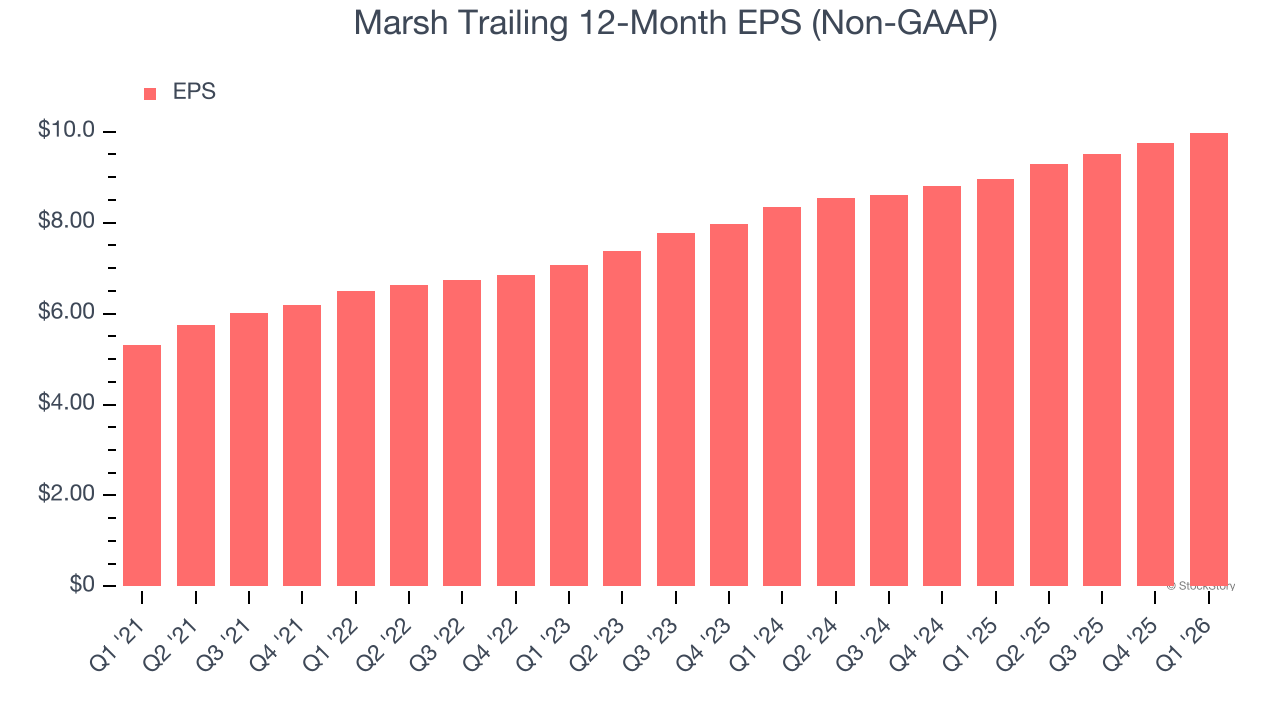
Marsh’s EPS grew at 13.4% compounded annual growth rate over the last five years, higher than its 9.3% annualized revenue growth. This tells us the company became more profitable on a per-share basis as it expanded.
We can take a deeper look into Marsh’s earnings to better understand the drivers of its performance. As we mentioned earlier, Marsh’s adjusted operating margin declined this quarter but expanded by 1.6 percentage points over the last five years. Its share count also shrank by 5.4%, and these factors together are positive signs for shareholders because improving profitability and share buybacks turbocharge EPS growth relative to revenue growth. 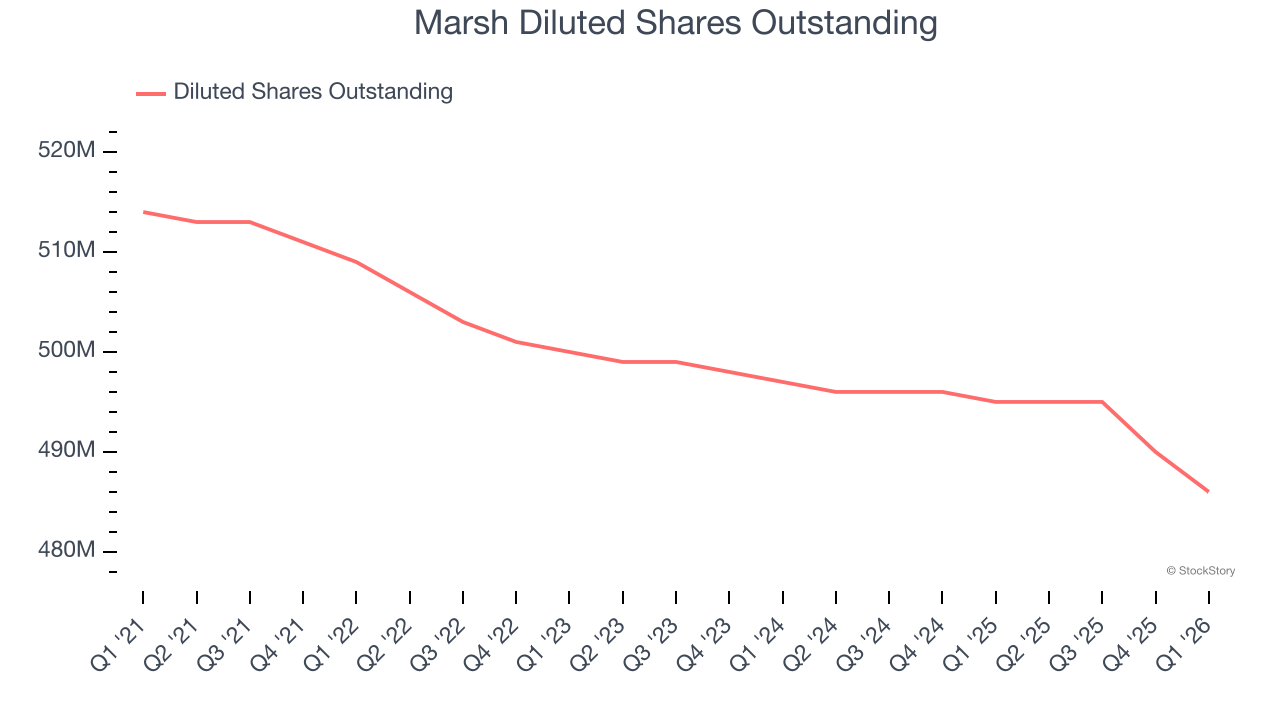
Like with revenue, we analyze EPS over a shorter period to see if we are missing a change in the business.
For Marsh, its two-year annual EPS growth of 9.4% was lower than its five-year trend. This wasn’t great, but at least the company was successful in other measures of financial health.
In Q1, Marsh reported adjusted EPS of $3.29, up from $3.06 in the same quarter last year. This print beat analysts’ estimates by 2.1%. Over the next 12 months, Wall Street expects Marsh’s full-year EPS of $9.98 to grow 6.5%.
Key Takeaways from Marsh’s Q1 Results
We enjoyed seeing Marsh beat analysts’ revenue and EPS expectations this quarter. We were also happy its organic revenue narrowly outperformed Wall Street’s estimates. Overall, this print had some key positives. The stock traded up 1.9% to $178.20 immediately following the results.
Indeed, Marsh had a rock-solid quarterly earnings result, but is this stock a good investment here? When making that decision, it’s important to consider its valuation, business qualities, as well as what has happened in the latest quarter. We cover that in our actionable full research report which you can read here (it’s free).