Golf entertainment and gear company Callaway Golf Company (NYSE: CALY) reported Q3 2026 results beating Wall Street’s revenue expectations, but revenue fell by 5.6% year on year to $436.9 million. On the other hand, next quarter’s revenue guidance of $334.5 million was less impressive, coming in 0.5% below analysts’ consensus estimates. Its non-GAAP profit of $0.12 per share was significantly above analysts’ consensus estimates.
For more on Callaway Golf Company, read our free full research report.
Callaway Golf Company (CALY) Q3 2026 highlights:
- Revenue $436.9 million vs S&P analysts’ consensus estimates of $428.3 million (5.6% year-on-year decline, 2% beat)
- Adjusted EPS $0.12 vs S&P analysts’ consensus estimates of $0.01 (significant beat)
- Adjusted EBITDA $35.9 million vs analysts’ consensus estimates of $17.19 million (8.2% margin, significant beat)
- Revenue guidance $334.5 million at the midpoint for Q4 2026, below analysts’ consensus estimates of $336.3 million
- EBITDA guidance $276 million at the midpoint for the full year, above analysts’ consensus estimates of $257.7 million
- Operating margin 10.2%, up from 1% in the same quarter last year
- Free cash flow margin 41.4%, up from 35% in the same quarter last year
- Market capitalization $2.96 billion
"We are pleased with our third quarter results, with revenue and Adjusted EBITDA exceeding expectations and continued strong progress on gross margins," commented Chip Brewer, President and Chief Executive Officer of Callaway Golf Company. "These results support an increase in our full-year outlook and demonstrate the benefits of our return to a focused, pure-play golf company. We also are continuing to return capital to shareholders while investing to support long-term growth, including our new 3D printing capabilities. With a strong balance sheet and a resilient golf consumer, we remain confident in our ability to strengthen our business and create long-term shareholder value."
Revenue growth
Reviewing a company’s long-term revenue performance reveals insights into its quality. Any business can post a good quarter or two, but many enduring ones grow for years. Callaway Golf Company’s demand was weak over the last five years as its revenue fell at a 5.5% annual rate. This was below our standards and is a sign of poor business quality.
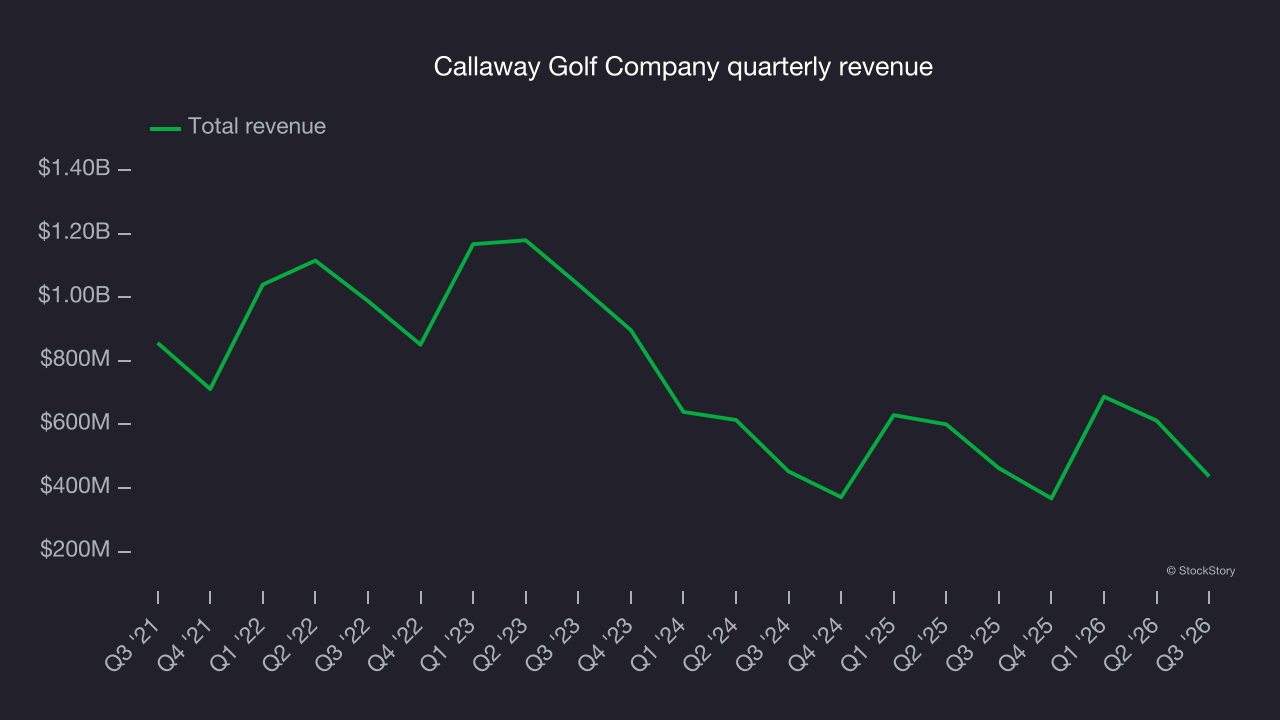
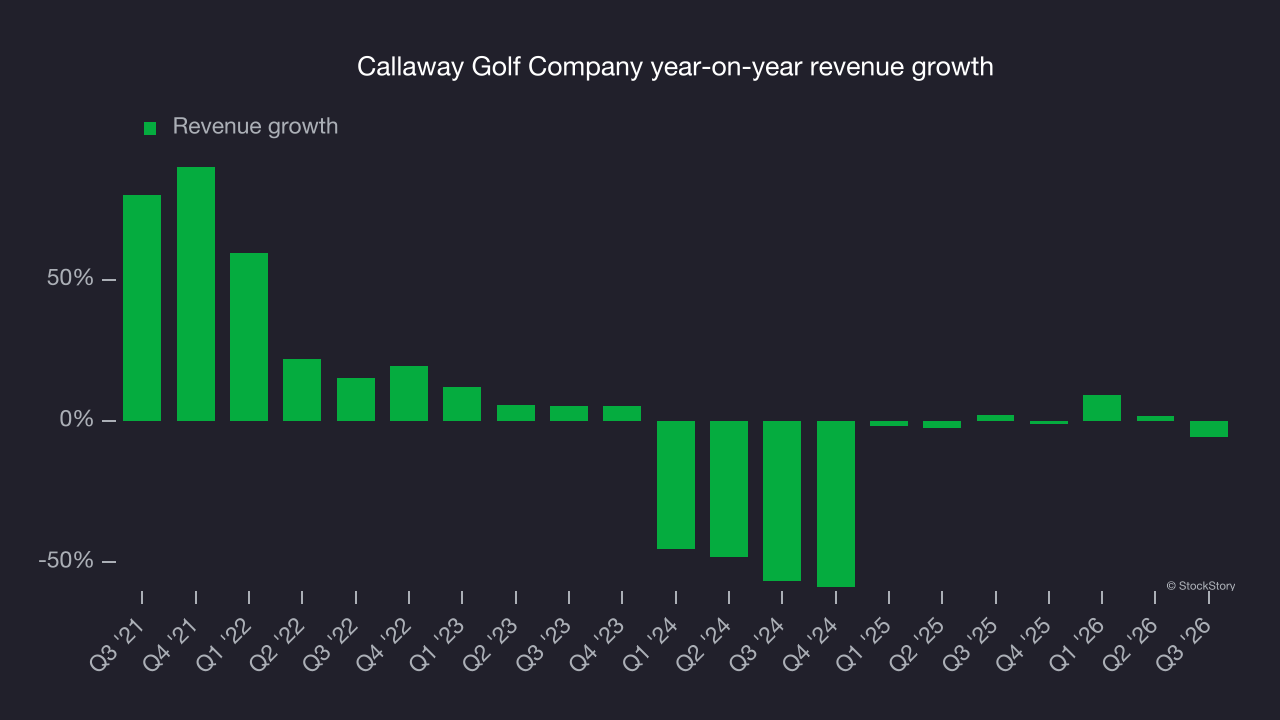
Long-term growth is the most important, but within consumer discretionary, product cycles are short and revenue can be hit-driven due to rapidly changing trends and consumer preferences. Callaway Golf Company’s recent performance shows its demand remained suppressed as its revenue has declined by 10.1% annually over the last two years. Covid hurt Callaway Golf Company’s business in 2020 and part of 2021, and it rebounded strongly thereafter.
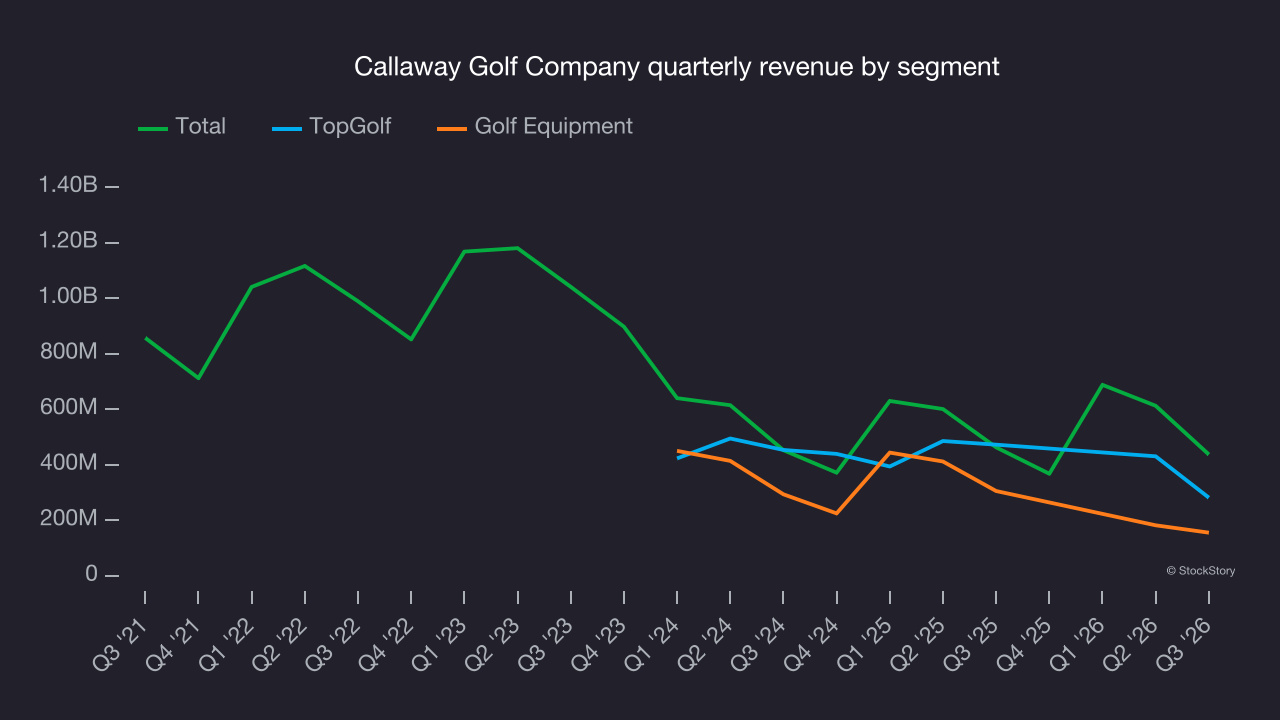
Callaway Golf Company also breaks out the revenue for its most important segments, TopGolf and Golf Equipment, which are 64.4% and 35.6% of revenue. Over the last two years, Callaway Golf Company’s TopGolf revenue (venue reservations, dining) averaged 11.2% year-on-year declines while its Golf Equipment revenue (Callaway) averaged 20.6% declines.
This quarter, Callaway Golf Company’s revenue fell by 5.6% year on year to $436.9 million but beat Wall Street’s consensus estimates by 2%. Management is guiding for a 9% year-on-year decline in revenue next quarter.
Looking further ahead, sell-side analysts expect revenue to remain flat over the next 12 months, according to S&P. Although this projection suggests its newer products and services will catalyze better top-line performance, it is still below average for the sector.
Operating margin
Callaway Golf Company’s operating margin has been trending up over the last 12 months and averaged 9.6% over the last two years. The company’s improved efficiency is a positive sign, but its suboptimal cost structure means profitability remains inadequate for a consumer discretionary business.
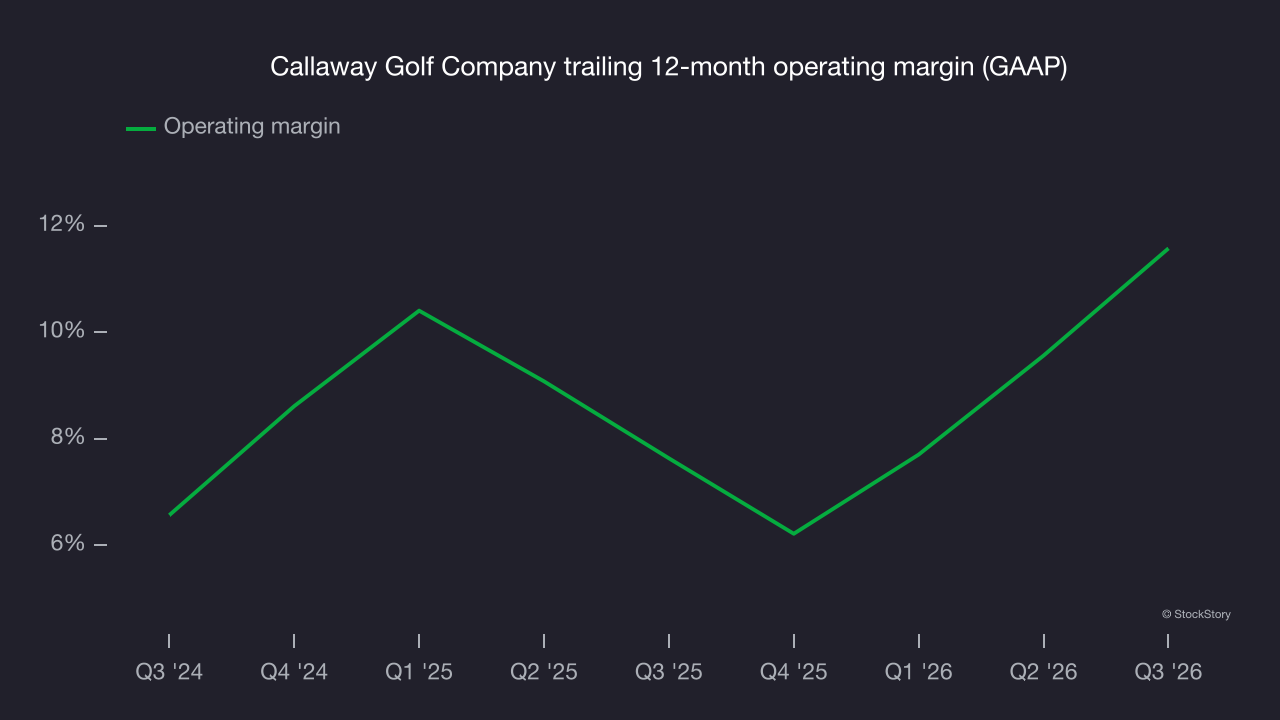
In Q3, Callaway Golf Company generated an operating margin of 10.2%, up 9.2 percentage points year on year. This increase was a positive development, especially since its revenue fell, showing it became more efficient by reducing expenses.
Earnings per share
Long-term changes in earnings per share, or EPS, matter for the same reason as long-term revenue growth. Compared to revenue, however, EPS highlights whether a company’s growth is profitable.
Callaway Golf Company’s flat EPS over the last five years was weak but better than its 5.5% annualized revenue declines. This indicates management adapted its cost structure.
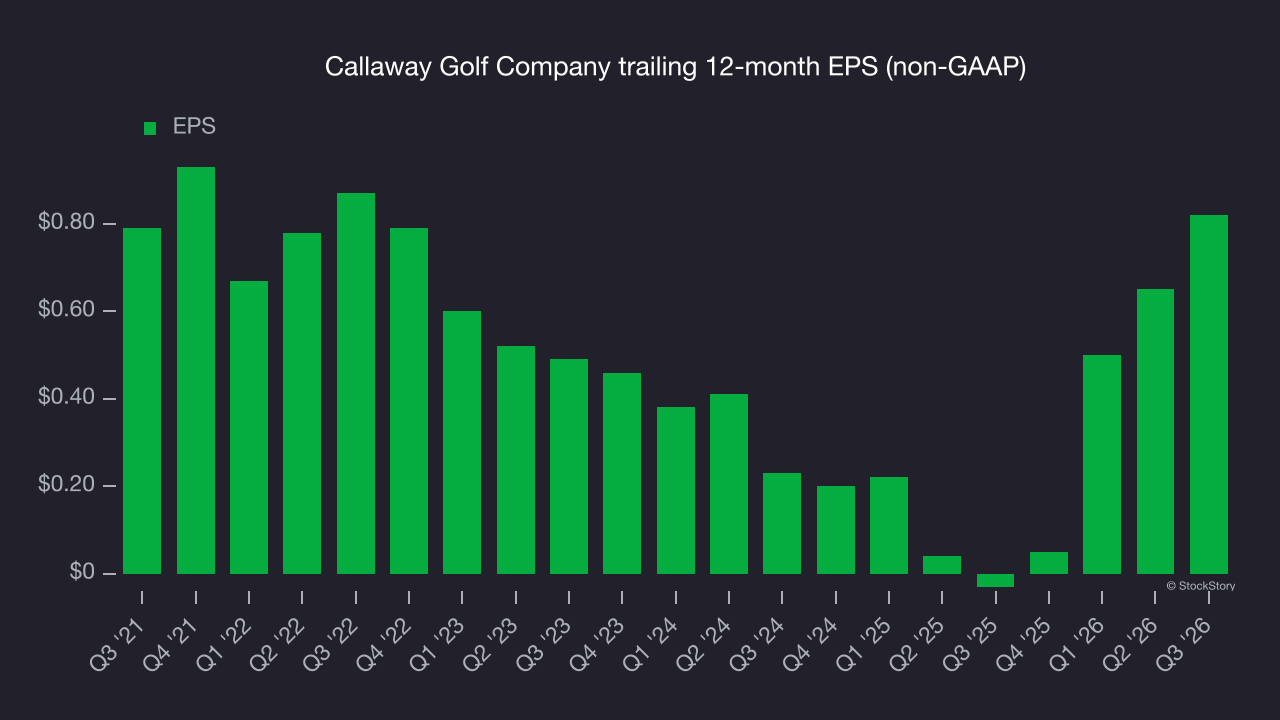
In Q3, Callaway Golf Company reported adjusted EPS of $0.12, up from negative $0.05 in the same quarter last year. This result easily cleared analysts’ consensus estimates, a positive outcome for shareholders. Over the next 12 months, Wall Street expects Callaway Golf Company’s full-year EPS to grow 11% from $0.82 to $0.91, according to S&P.
Key takeaways from Callaway Golf Company’s Q3 results
Callaway Golf Company delivered a decent Q3, with EPS above analysts’ consensus estimates and EBITDA beating Wall Street’s consensus by a wide margin. Its EBITDA guidance for for the fiscal year was ahead of expectations. Shares soared 10.1% to $17.54 immediately after the results.
Callaway Golf Company may have had a good quarter, but that alone doesn’t make the stock a buy. The latest quarter matters, but not nearly as much as longer-term fundamentals and valuation when deciding whether to invest. For more on those factors, read our full research report here (it’s free).