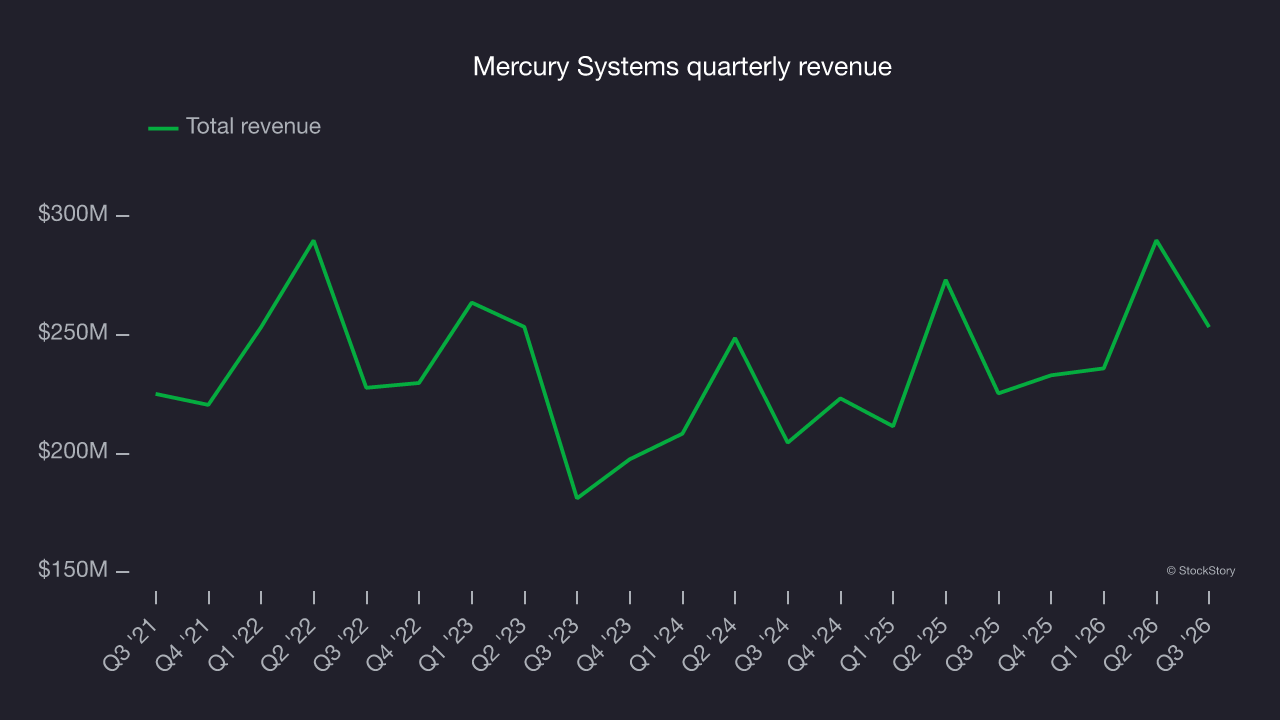
Aerospace and defense company Mercury Systems (NASDAQ: MRCY) beat Wall Street’s revenue expectations in calendar Q3 2026 (fiscal Q1 2027), with revenue up 12.4% year on year to $253.2 million. Its non-GAAP profit of $0.52 per share was 74.7% above analysts’ consensus estimates.
For more on Mercury Systems, read our free full research report.
Mercury Systems (MRCY) Q3 CY2026 highlights:
- Revenue $253.2 million vs S&P analyst consensus of $244.7 million (12.4% year-on-year growth, 3.4% beat)
- Adjusted EPS $0.52 vs S&P analyst consensus of $0.30 (74.7% beat)
- Adjusted EBITDA $56.4 million vs analysts’ consensus estimates of $38.87 million (22.3% margin, 45.1% beat)
- Operating margin 7.3%, up from -3.8% in the same quarter last year
- Free cash flow -$24.38 million compared to -$4.37 million in the same quarter last year
- Backlog $2.1 billion at quarter end, up 50% year on year
- Market capitalization $4.79 billion
“We delivered strong first quarter fiscal 2027 results, with record first quarter bookings, revenue, and adjusted EBITDA, and record backlog," said Bill Ballhaus, Mercury’s Chairman and CEO. “Our first quarter results reflect robust organic growth and margins that are in-line with our target profile. Based on this solid execution, we are raising our outlook for fiscal year 2027."
Revenue growth
Examining a company’s long-term performance can provide clues about its quality. Any business can have short-term success, but a top-tier one grows for years. Mercury Systems’s revenue grew at a sluggish 1.4% annualized rate over the last five years, falling short of our benchmarks.
Long-term growth is the most important, but within industrials, a half-decade historical view may miss new industry trends or demand cycles. Mercury Systems’s annualized revenue growth of 8.5% over the last two years is above its five-year trend, suggesting its demand recently accelerated. 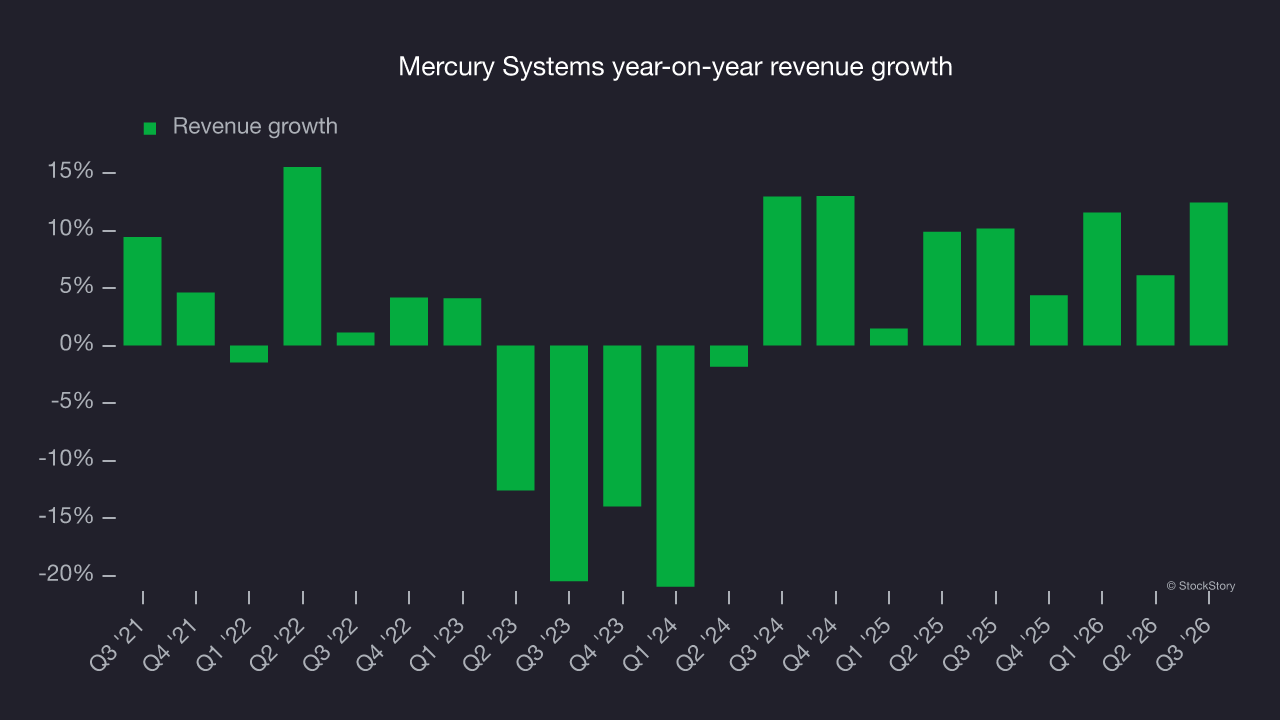
Analyzing the company’s backlog, or the value of its outstanding orders that have not yet been executed or delivered, offers more detail on its revenue dynamics. Mercury Systems’s backlog reached $2.1 billion in the latest quarter and averaged 20.3% year-on-year growth over the last two years. Backlog growth outpaced revenue growth, indicating the company accumulated more orders than it could fulfill and deferred revenue to the future. This could imply elevated demand for Mercury Systems’s products and services but raises concerns about capacity constraints. 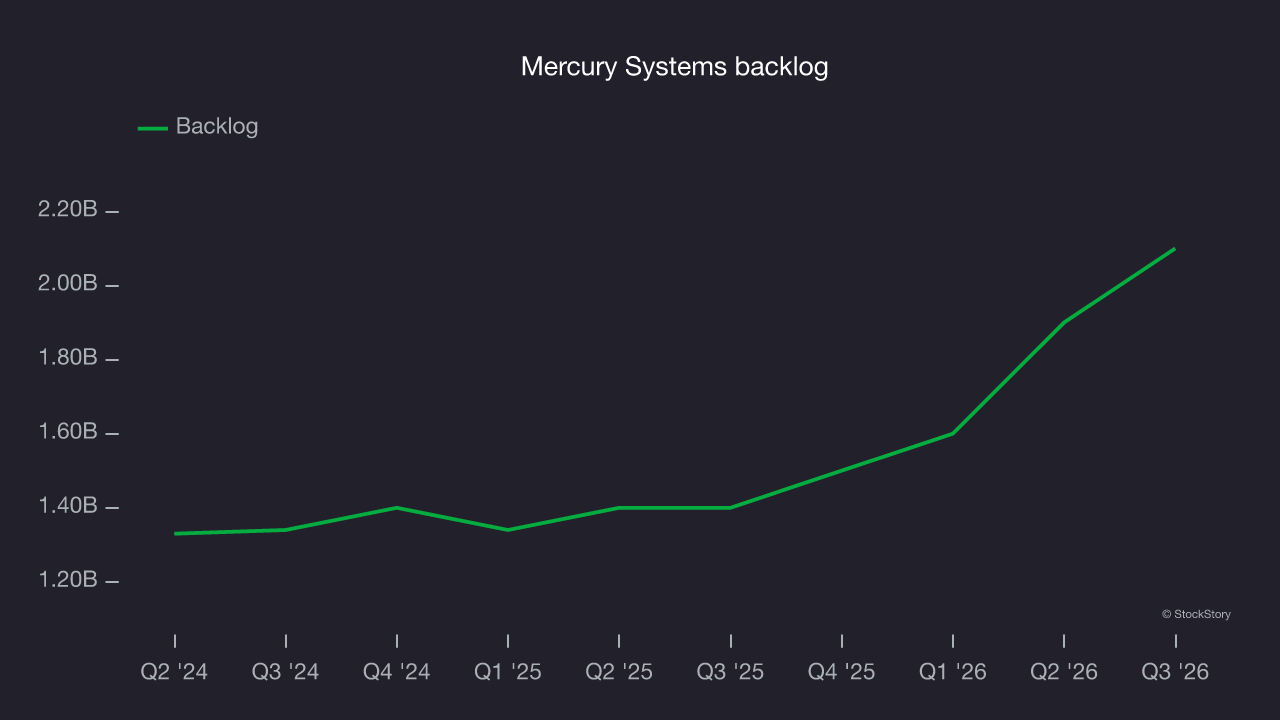
This quarter, Mercury Systems reported year-on-year revenue growth of 12.4%, and its $253.2 million of revenue exceeded Wall Street’s consensus estimates by 3.4%.
Looking ahead, sell-side analysts expect revenue to grow 9.8% over the next 12 months, according to S&P, similar to its two-year rate. This is a strong growth projection and implies its newer products and services will drive better revenue performance.
Operating margin
Mercury Systems’s operating margin was broadly unchanged over the last five years. Its costs have broadly tracked its revenue, leaving its long-term profitability largely unchanged. Its trailing 12-month operating margin was 2.7%.
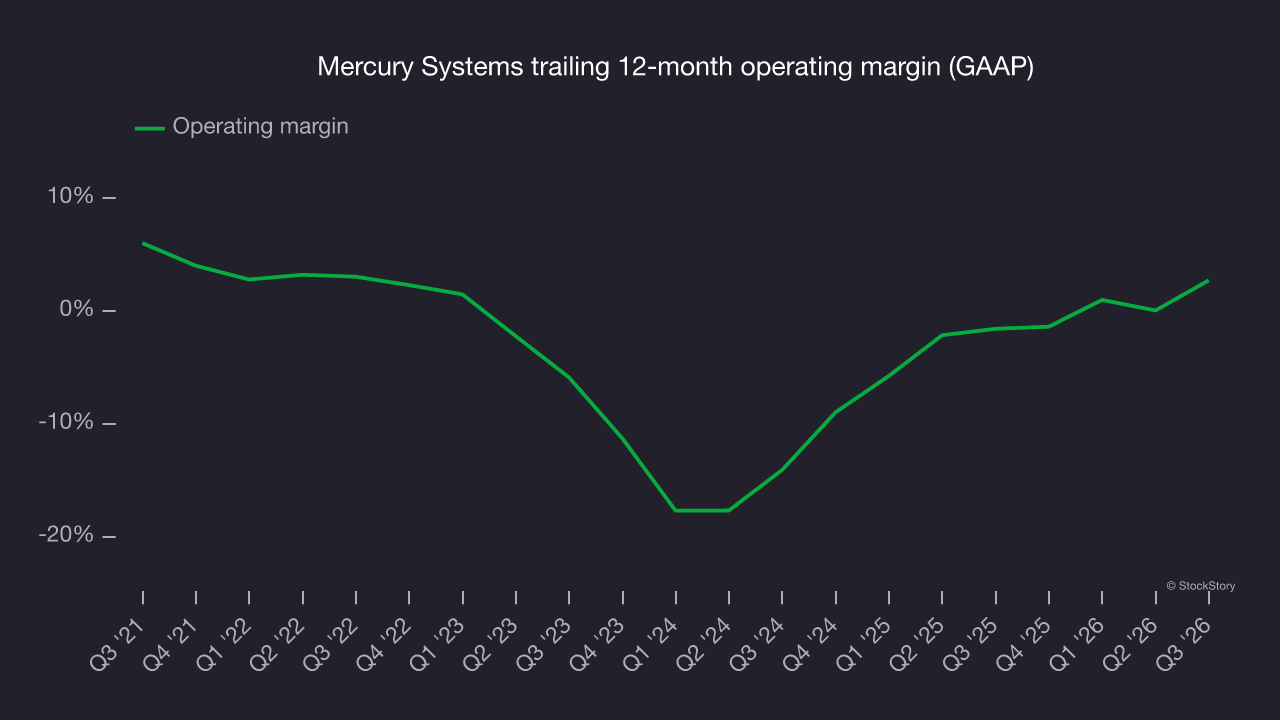
In Q3, Mercury Systems generated an operating profit margin of 7.3%, up 11.1 percentage points year on year. This improvement shows it operated more efficiently.
Earnings per share
Revenue trends explain a company’s historical growth, but the long-term change in earnings per share, or EPS, points to the profitability of that growth. For example, a company could inflate its revenue through excessive spending on advertising and promotions.
Mercury Systems’ EPS declined by 10.7% annually over the last five years while its revenue grew by 1.4%. However, its operating margin didn’t change during this time, indicating that non-fundamental factors such as interest and taxes affected its ultimate earnings.
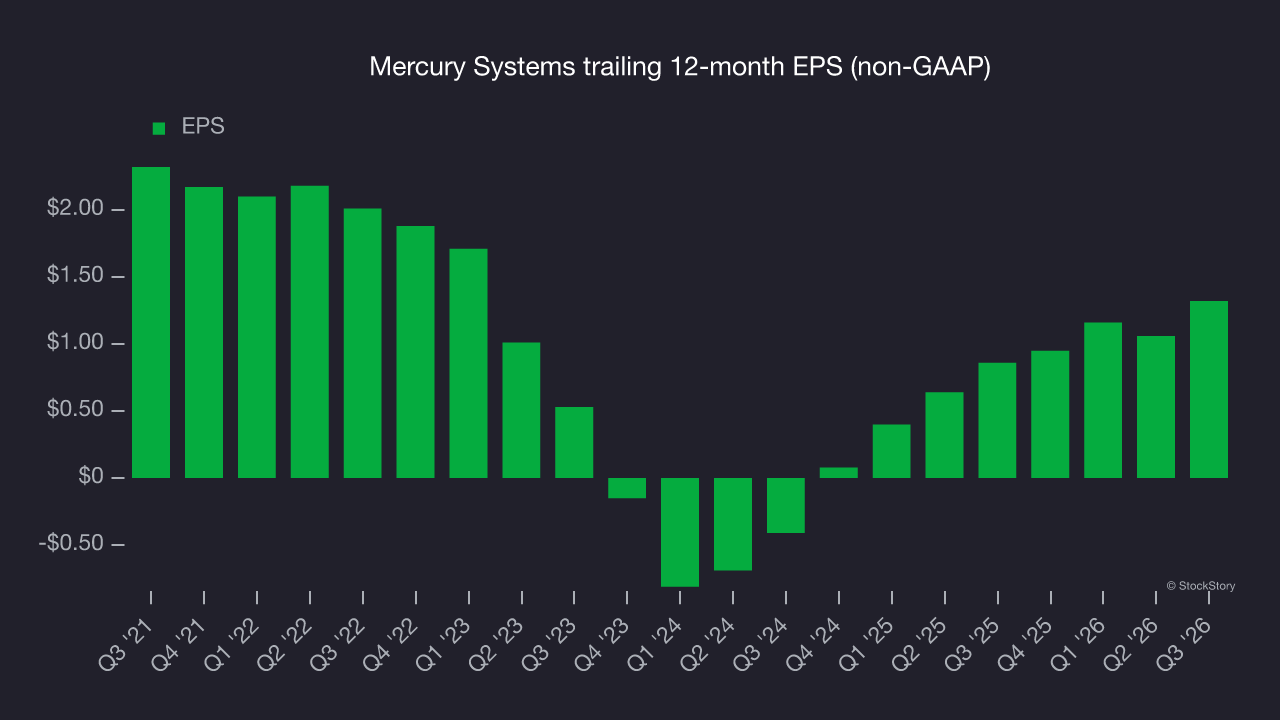
A closer look at Mercury Systems’ earnings helps explain the drivers of its performance. A five-year view shows Mercury Systems has diluted its shareholders, growing its share count by 11.3%. This has led to lower per share earnings. Taxes and interest expenses can also affect EPS but don’t tell us as much about a company’s fundamentals. 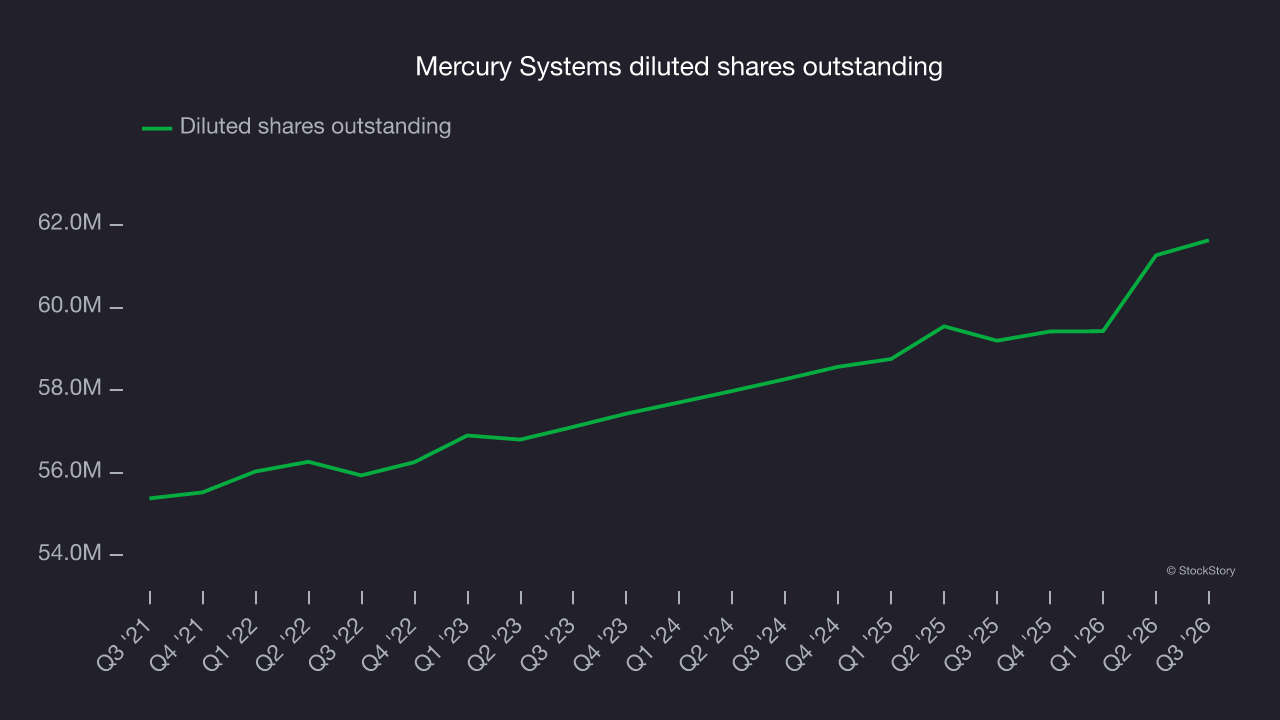
As with revenue, examining EPS over a more recent period can provide insight into an emerging theme or development for the business.
For Mercury Systems, its two-year annual EPS growth of 128% was higher than its five-year trend. This acceleration made it one of the faster-growing industrials companies in recent history.
In Q3, Mercury Systems reported adjusted EPS of $0.52, up from $0.26 in the same quarter last year. This result easily cleared analysts’ consensus estimates, a positive for shareholders. Over the next 12 months, Wall Street expects Mercury Systems’ full-year EPS to grow 38% from $1.32 to $1.82, according to S&P.
Key takeaways from Mercury Systems’s Q3 results
Mercury Systems delivered some clear positives this quarter: EBITDA came in well ahead of Wall Street’s consensus estimates, and EPS also beat analysts’ consensus estimates. Shares remained flat at $84.10 immediately after the results.
Mercury Systems had a solid quarter, but one earnings result doesn’t necessarily make the stock a buy. That decision should take into account valuation, business quality and the latest earnings. For more on those factors, read the full research report here (it’s free).