
Since March 2020, homes have appreciated by $88,000, on average
Home prices across the United States continued to climb in August, although at a significantly slower rate than in prior months, rising at an annualized 12.0 percent from the prior month. This marks the second consecutive month of slowing month-over-month appreciation, according to homegenius Home Price Index (HPI) data released today by homegenius Real Estate LLC, a Radian Group Inc. company (NYSE: RDN). The company believes the homegenius HPI is the most comprehensive and timely measure of U.S. housing market prices and conditions.
This press release features multimedia. View the full release here: https://www.businesswire.com/news/home/20220930005083/en/
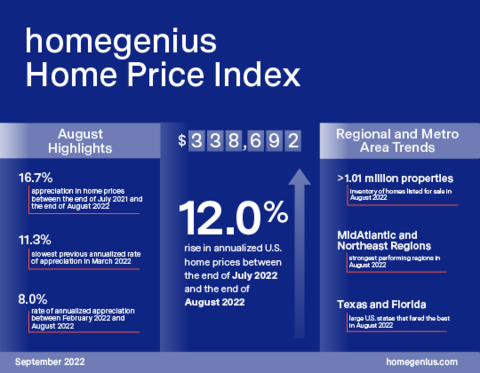
homegenius Home Price Index (HPI), September 2022 (Graphic: Business Wire)
After setting an all-time high for monthly appreciation at 18.8 percent in June 2022 (annualized), appreciation rates have tempered significantly, slowing more than 35 percent from that peak. Appreciation rates often ebb in winter months of slower housing activity, but typically rise during the more active, summer buying season. The homegenius HPI is calculated based on the estimated values of more than 70 million unique addresses each month, covering all single-family property types and geographies.
“Over the last two months, the impact of major increases in mortgage rates and inflation have finally been realized in the slowing rate of home price appreciation. It is once again clear that home prices are not impervious to the broader economic conditions around the country,” noted Steve Gaenzler, SVP of Products, Data and Analytics for homegenius Real Estate. “However, the rate of appreciation is still well above the historical norm, at more than 12 percent month-over-month. While it is likely that appreciation rates will continue to drop, homeowners’ equity remains at all-time highs and inventory remains tight.”
Home prices have risen at an annualized rate of 8.0 percent over the last six months (February 2022 to August 2022), and 15.9 percent over the last three months.
NATIONAL DATA AND TRENDS
- Median estimated home price in the U.S. rose to $338,692
- Home price appreciation remains well above historic averages
Nationally, the median estimated price for single-family and condominium homes rose to $338,692. Since the onset of the U.S. pandemic thirty months ago, homes across the U.S. have appreciated, on average, by more than $88,000, significantly reducing leverage and increasing wealth through home equity. Home prices have appreciated by 16.7 percent over the last 12 months and 8.0 percent over the last six months.
Recent data show that the record rates of appreciation during the pandemic appear to be waning quickly. Over the last month, price appreciation slowed to 12.0 percent. While that is significantly slower than the prior month’s 16.5 percent appreciation, August home price appreciation actually matches the average monthly appreciation rate since the start of the pandemic, 30 months ago.
This month’s annualized rate of appreciation does, however, represent the slowest appreciation rate since March 2022 (11.3 percent). The outsized and unsustainable appreciation rates recorded nationally during the pandemic should continue to revert towards normal, longer-term appreciation rates, although continued shortage of inventory and some regional outliers, should prolong higher than average national appreciation rates.
REGIONAL DATA AND TRENDS
- All Regions appreciated more slowly in August
- Greatest slowdown found in West and South
In August, all six of our regional indices recorded slower home price appreciation rates relative to the prior month. The MidAtlantic and Northeast markets were the strongest performers last month, while the West and South showed the strongest slowdown in appreciation.
There were slightly more than 1.01 million properties listed for sale in August, which was the second-lowest level of inventory for any August over the last decade, and 40 percent lower than the average level of August listings over the last 15 years (1.4mm). To date, the homegenius HPI is not seeing increases in inventory large enough to independently create downward pressure on home prices.
Roughly 290,000 homes were purchased in August, in comparison to 278,000 in July. While August is often the highest sales month, this year the pace of combined sales for July and August was much lower than is typical for the busy summer home-buying season. The last time a summer month (June, July, or August) reported less than 278,000 sales was in 2014. This year, the average sales per month in the summer months was 293,000. This makes 2022 an outlier in how quickly it has slowed in comparison to both historical levels and 2021, which set an all-time record for monthly buying activity.
METROPOLITAN AREA DATA AND TRENDS
- Appreciation rates slower in all major cities over last two months
- San Francisco records slowest appreciation rate of largest cities
All 20 largest metro areas in the U.S. recorded slower annual price appreciation in August than in July. The largest decline was in San Francisco, which dropped to just 1.3 percent appreciation (annualized) in August. Los Angeles had the second-slowest appreciation rate of large, metropolitan cities, with a 5.7 percent increase month-over-month.
In contrast, cities in Texas and Florida fared the best of large metropolitan areas. Florida cities on both coasts recorded appreciation rates above 15 percent (Tampa 16.3%, Miami 16.5%) relative to the prior month. On average, the top 20 largest metros increased by 9.8 percent in July. Over the last year, the average large metro increase was 12.6 percent.
ABOUT THE HOMEGENIUS HPI
homegenius Real Estate LLC, a subsidiary of Radian Group Inc., provides national and regional indices for download at homegenius.com/hpi, along with information on how to access the full library of indices.
Additional content on the housing market can also be found on the homegenius and Radian News and Insights pages.
homegenius offers the HPI data set along with a client access portal for content visualization and data extraction. The engine behind the homegenius HPI has created more than 100,000 unique data series, which are updated on a monthly basis.
The homegenius HPI Portal is a self-service data and visualization platform that contains a library of thousands of high-value indices based on both geographic dimensions as well as by market, or property attributes. The platform provides monthly updated access to nine different geographic dimensions, from the national level down to zip codes. In addition, the homegenius HPI provides unique insights into market changes, conditions and strength across multiple property attributes, including bedroom count and livable square footage. To help enhance customers’ understanding of granular real estate markets, the library is expanded regularly to include more insightful indices.
homegenius Inc. and its family of companies combine an array of title, real estate and technology products and services into a full-service ecosystem. homegenius offers innovative experiences from search to close, enabling mortgage lenders, mortgage and real estate investors, consumers, GSEs, and real estate brokers and agents to benefit from integrated and personalized solutions leveraging advanced technology and the latest advancements in data science, machine learning and artificial intelligence. Real estate services, provided by homegenius Real Estate LLC, dba homegenius Real Estate, a wholly owned subsidiary of homegenius Inc. 7730 South Union Park Avenue, Suite 400, Midvale, UT 84047. Tel: 1-877-500-1415. homegenius Real Estate LLC and its wholly owned subsidiary are licensed in every state and the District of Columbia. For additional information on the homegenius family of companies, please visit homegenius.com.
View source version on businesswire.com: https://www.businesswire.com/news/home/20220930005083/en/
Contacts
For Investors
John Damian – Phone: 215.231.1383
Email: john.damian@radian.com
For the Media
Rashi Iyer – Phone: 215.231.1167
Email: rashi.iyer@radian.com