With the Iran war set to enter week four on Saturday, reports that the U.S. is considering taking over Kharg Island, Iran’s primary oil-export hub, are sending S&P futures lower and oil prices higher.
I see plenty of news stories about the American consumer’s worries about gas prices; if it makes you feel better, here in Nova Scotia, where I live, a liter of gas (about 3.79 liters to a gallon) is CAD$1.744. Converted to U.S. dollars, that’s $4.83 a gallon, 24% higher than the U.S. average of $3.88. It can always be worse, but I digress.
I’ve been touting small-cap stocks since late 2023.
“Judging by yesterday’s UOA for the iShares Russell 2000 ETF (IWM), I don’t think there’s any question that the bullish bet for 2024 is small-cap stocks. However, although IWM is up more than 15% year-to-date, that pales compared to the 24% return for the S&P 500,” I wrote on Dec. 22, 2023.
IWM’s total return in 2024 was a respectable 11.39% according to Morningstar data. In 2025, it improved to 12.66%. However, gains made in January -- it was up over 10% year-to-date when it hit its all-time high on Jan. 22 -- have since disappeared amid troubles in the Middle East.
I remain positive about small-cap stocks. I’m not the only one. Ariel Investments founder John W. Rogers believes good times are ahead for smaller stocks.
“Rogers, who is also the chairman, co-CEO and chief investment officer at Ariel, continues to be a contrarian as well. He said he’s still bullish on smaller stocks, arguing that there could be ‘many many many mergers in many industries’ and that could be a catalyst for small-caps,” Barron’s reported the long-time investment manager’s comments on March 19.
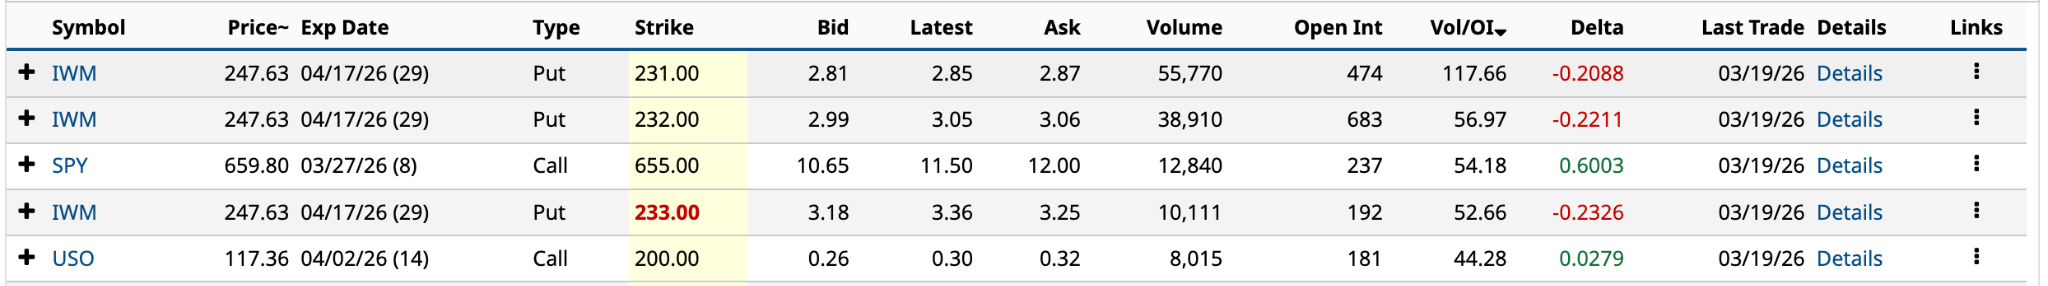
This leads me to yesterday’s unusual options activity.
Among ETFs, IWM had three of the five highest Vol/OI (volume-to-open-interest) ratios yesterday, all of them puts; all OTM (out-of-the-money). Clearly, many long-time IWM holders were looking to protect the downside in these uncertain times. Perfectly understandable.
 However, if you’re bullish long-term on small-cap stocks and you don’t mind above-average risk, I’ve got a Covered Strangle strategy with a twist.
Have an excellent weekend watching March Madness basketball.
What Is a Covered Strangle?
If you’ve traded options for any amount of time, you’re probably familiar with the covered strangle, also known as a Covered Combination, because it combines a Cash-Secured Put with a Covered Call. Broken down, you’re long 100 shares of IWM stock, short one IWM put, and short one IWM call.
As I said in the introduction, this is not something for risk-averse investors, especially in these turbulent times. Here’s why.
Investors typically use the covered strangle when they are bullish about a stock or ETF but believe it is fairly valued and likely to be dead money in the near term, say 30-60 days, perhaps more, thereby generating premium income in the interim by selling both a call and a put.
The downside risk is that volatility rises between now and the expiration date, forcing you to buy the stock at a strike price above the current share price, resulting in an unrealized loss. The upside risk is that something big happens -- in a good way -- such as the war ending, and IWM’s share price rockets higher, forcing you to sell your 100 shares to the call buyer, capping your gains.
Income generation aside, the strategy is most attractive to investors who’ve owned the stock for a reasonable amount of time, have built up gains, and don’t mind taking profits, but who also wouldn’t be opposed to buying more IWM at a lower share price.
Two Different Scenarios
Let’s consider IWM under two different scenarios.
In the first, you bought 100 shares of IWM at the September 2022 low of $163.28, another 100 shares at the October 2023 low of $161.67, and another 100 shares at the April 2025 low of $171.73. That’s 300 shares at an average price of $165.56.
Now, no one’s this good at market timing, so it’s important to note that this scenario is completely hypothetical.
The second scenario involves buying 300 IWM shares at yesterday’s closing price of $247.63. Again, purely hypothetical.
Using the three unusually active puts from yesterday, I would go with selling three April 17 $231 puts for $843 [3 * $2.81 bid price * 100] in premium income based on the bid price shown. That’s a return of 1.11% [$2.81 bid price / $247.63 share price - $2.81 bid price], or 13.84% annualized [1.1% return * 365 / 29].
Now we have to choose an OTM call, typically one with the same April 17 expiration date. Which one depends on the two scenarios: In the first, we can go with a strike price closer to being ATM (at-the-money) because you’ve got 50% cumulative gains baked in. In the second, you’ll want a strike price further OTM to avoid selling your recently purchased shares and generating future capital appreciation.
The $231 put was about 6.7% OTM. Based on yesterday’s trading, I’d go with the $264 call strike. It’s OTM by about the same amount on the upside. Selling three April 17 $264 calls, you would generate $522 in premium income [3 * $1.74 bid price * 100] based on the bid price shown. That’s a return of 0.71% [$1.74 bid price / $247.63 share price - $1.74 bid price], or 8.94% annualized [0.71% return * 365 / 29].
 The overall return would be 1.87% [($2.81 bid price for put + $1.74 bid price call) / $247.63 share price - ($2.81 bid price for put + $1.74 bid price call)] or 23.53% annualized [1.87% return * 365 / 29].
Assuming the share price at expiration is below $264 or above $231, a 23.53% return is very healthy.
In the second scenario, like the first, you would use the $231 strike for the cash-secured put, but you’d select a call with a strike price higher than $264. You don’t want your shares sold if you can help it. I’d go with the April 17 $272 call, which is 10.11% OTM.
 The share price above is from early Friday morning trading. As of yet, there’s no volume. The $0.39 bid price yields a return below the 0.2% showing. It’s actually 0.16% [$0.39 bid price / ($247.03 share price - $0.39 bid price)], 4.91% annualized [0.39% return * 365 / 29].
However, in this scenario, the actual annualized return is 2.1%, because it includes a 60-cent drop in the share price from yesterday. The potential return of 10.3% includes the $0.39 in premium, plus the $24.97 per share gain [$272 strike price - $247.03 share price] on the appreciation through April 17, which is assigned to the call buyer.
In either case, the expected move is $13.91 (5.66%) to the upside or downside, so the profit probability for the covered strangle is reasonably high. However, I must stress that the downside is unlimited -- the share price could theoretically fall to $0 -- but the likelihood, given that IWM is an index ETF, is close to nil.
The Twist Revealed
When it comes to small-cap index-based ETFs, I’ve always favored the iShares Core Small-Cap ETF (IJR) over IJM because it tracks the S&P SmallCap 600 Index, as opposed to the Russell 2000.
The quality of companies in the S&P SmallCap 600 is much better than the Russell 2000; approximately 40% of the names in the latter index don’t make money. To be included in the former, you must have made money in the most recent quarter and cumulative profits over the previous four quarters.
In these volatile times, it pays to own quality, especially in smaller companies.
The problem, as it relates to IJR, is that it can’t hold a candle to IWM’s options volume. The former’s 30-day average volume is 216; the latter's is 2.24 million.
So, even contemplating a covered strangle with IJR is off the table. But since I believe in small caps and IJR as a proxy, here’s a possible twist.
You buy 200 shares of IJR -- IJR’s share price is about half IWM’s -- while also doing a covered strangle for IWM as discussed previously. That generates income while ensuring you continue to own small-cap stocks, regardless of what happens to the covered strangle.
Alternatively, and this involves higher risk, you buy 100, 200, or however many shares of IJR, and then do uncovered puts and calls on IJM for income.
The risk being that you theoretically have unlimited loss potential on both, not just the puts. However, if you keep the DTEs (days to expiration) to 30-45 days, the losses won’t be too high.
On the date of publication, Will Ashworth did not have (either directly or indirectly) positions in any of the securities mentioned in this article. All information and data in this article is solely for informational purposes. For more information please view the Barchart Disclosure Policy here.
More news from Barchart
- Palo Alto Networks Stock Is Still Deeply Undervalued Based on its FCF - How to Play PANW
- IWM’s Surge in Unusual Options Activity Signals Opportunity — Here’s a Covered Strangle With a Twist
- Follow the Footprints: 3 Stocks with Unusual Options Activity That You Can’t Ignore
- SoFi Stock Is on Fire Sale, But Is It Too Cheap to Buy Here?