
In a bid to maintain a competitive edge, The Walt Disney Company (DIS) plans to spend $60 billion on parks and cruises. The significant commitment, however, has elicited concern amongst Wall Street analysts.
"Expanding parks and cruises tends to be a multi year undertaking as a result of which, revenue and margin acceleration lags the investment cycle," Barclays analysts said. Moreover, Bank of America cut its price target for Disney from $135 to $110.
In addition, DIS’ subscriber losses continued in the most recent quarter, with the company reporting 146.1 million Disney+ subscribers, a 7.4% decline. The entertainment conglomerate also confirmed a net loss of $460 million for this period.
Given the streaming woes alongside widespread skepticism amongst analysts, it can be suggested that DIS may not necessarily present a secure investment choice. Concrete evidence supporting this bearish stance can be found through an examination of several key performance indicators for the company.
Analyzing Walt Disney's Financial Health: An Overview of Key Metrics from 2020 to 2023
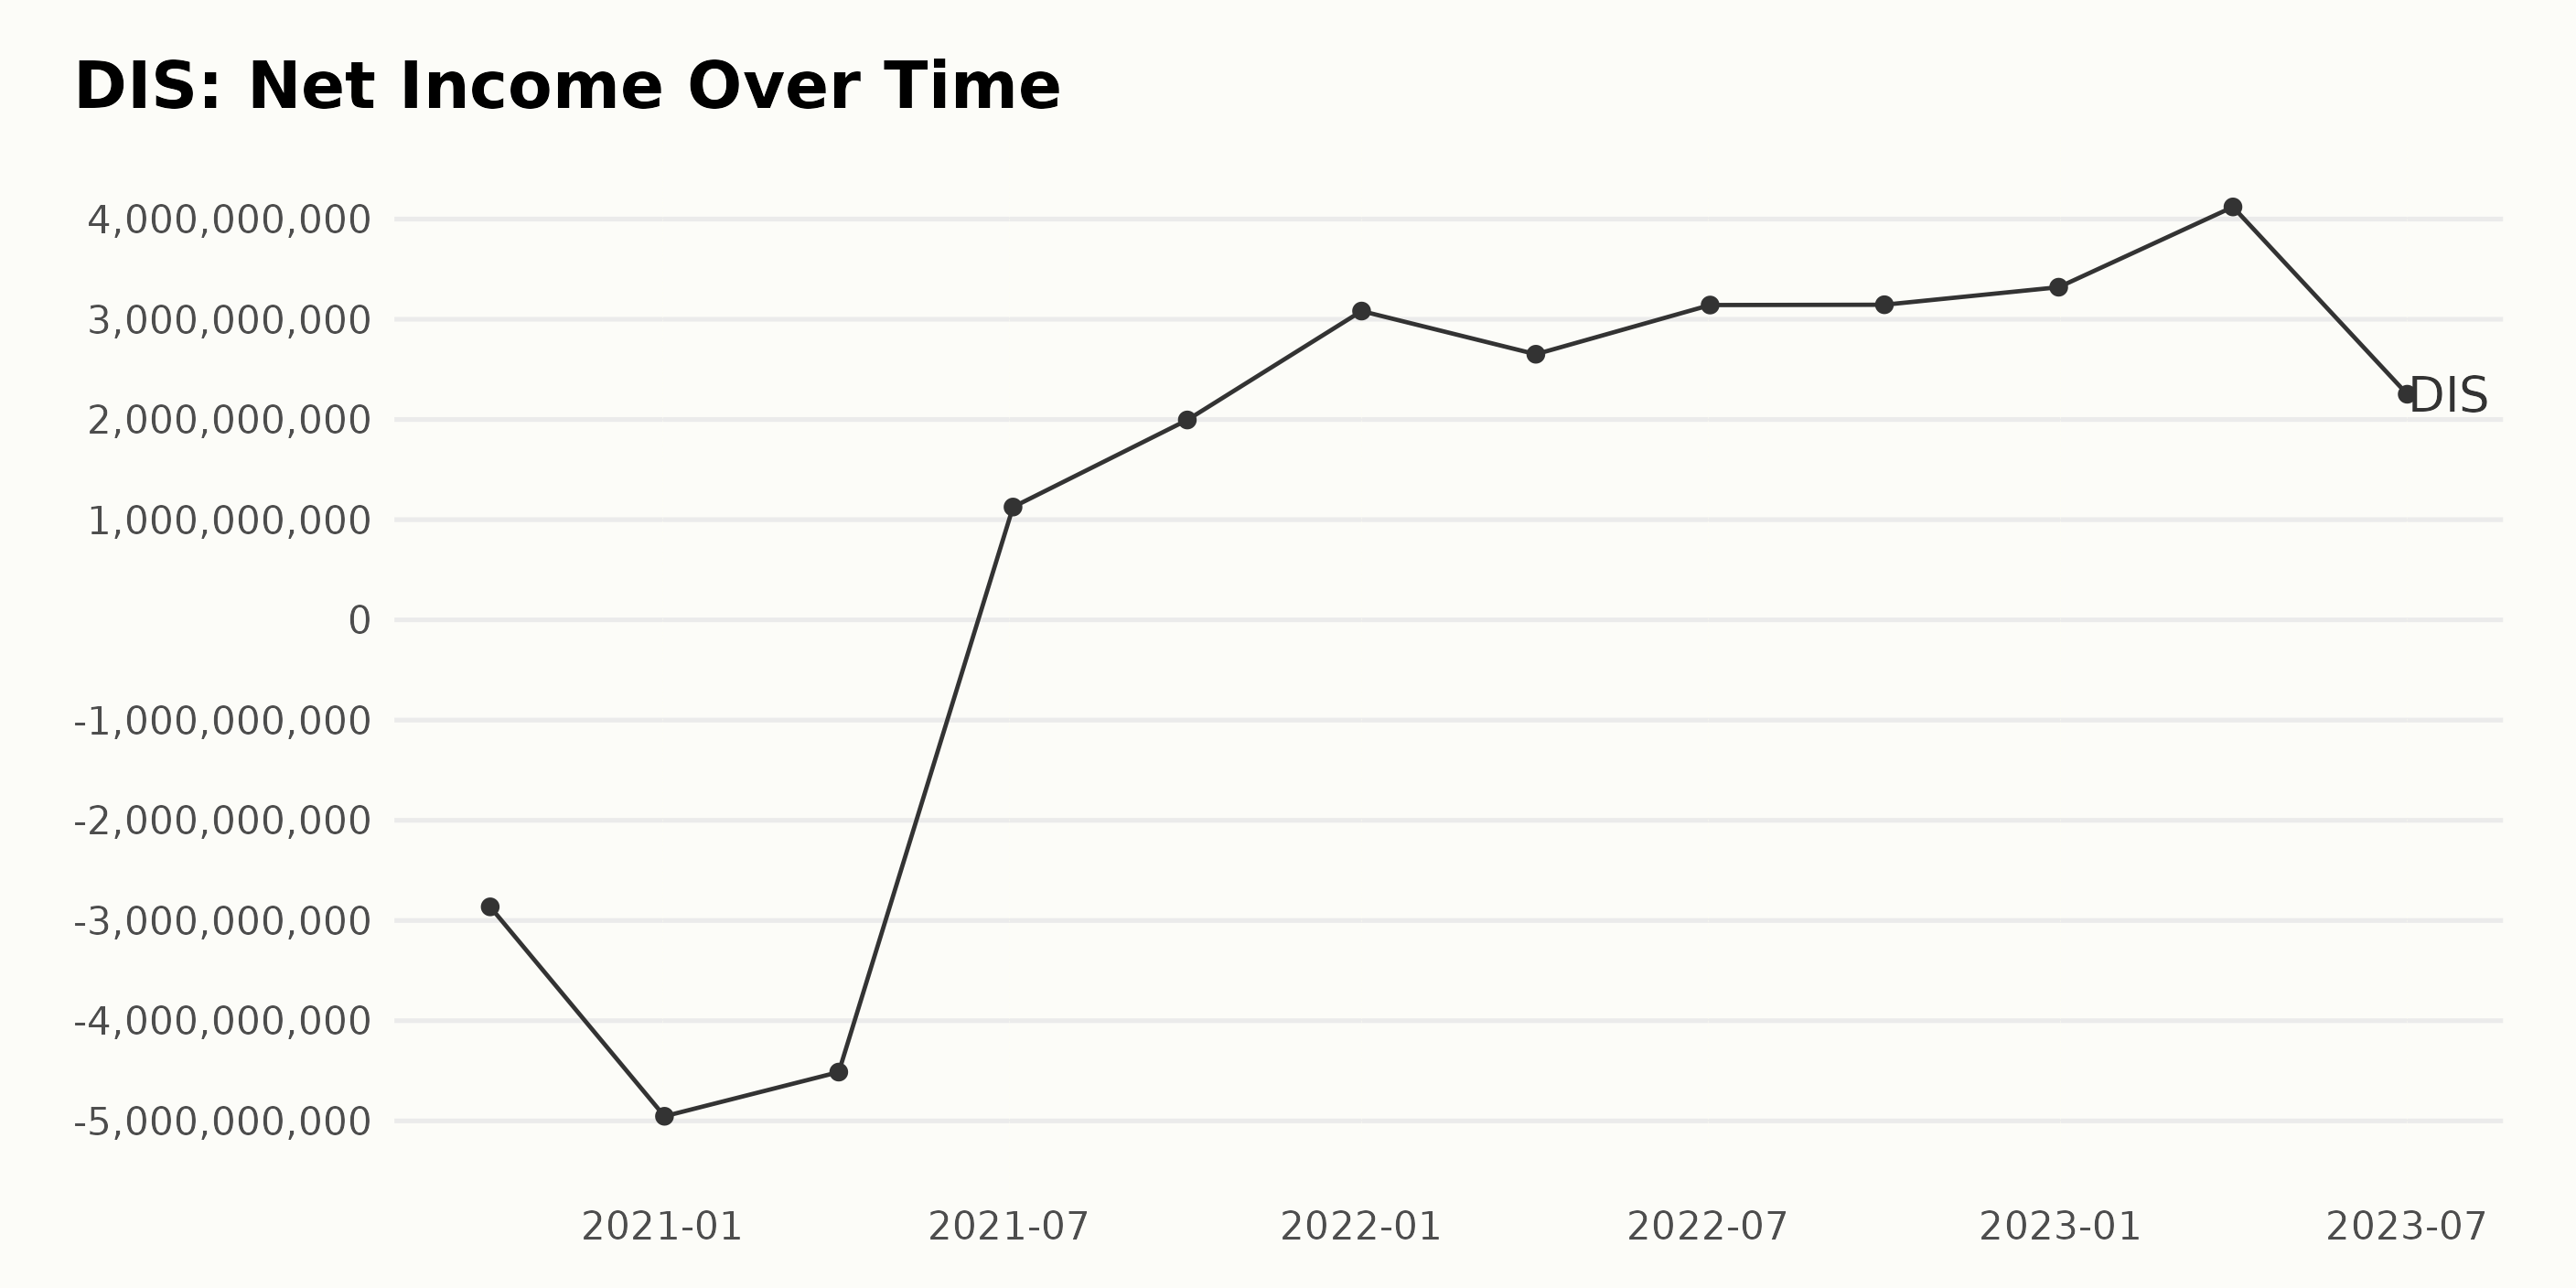
The trailing-12-month net income of DIS has presented an overall positive growth rate during the considered time frame from October 3, 2020, to July 1, 2023.
- Beginning in October 2020, DIS saw a negative net income of -$2.86 billion, further declining to -$4.95 billion by January 2, 2021.
- This trend continued until April 2021, seeing a slight improvement to -$4.51 billion.
- An upwards pivot occurred from April 2021, with a jump in net income value up to $1.12 billion by July 2021.
- From January 2022 onwards, there was a consistent rise in net income, hitting $3.08 billion and marking a significant recovery.
- The next quarter, in April 2022, showed a minor drop to $2.65 billion, but this improved again by July 2022 to $3.14 billion.
- By the end of 2022, net income had further increased, ending the year off at $3.32 billion.
- The greatest value of the series was achieved on April 1, 2023, reaching an impressive $4.12 billion, but then a noticeable decline occurred by July 2023, decreasing the net income to $2.25 billion.
Calculating the growth rate from the first value to the last in our series, we observe a strong increase from the initial negative net income of -$2.86 billion to a final positive net income of $2.25 billion by July 2023. This indicates that despite some fluctuations, the company's financial health has significantly improved over this nearly three-year timeframe. The emphasis on more recent data shows continued profitability in recent quarters, though with some variability.
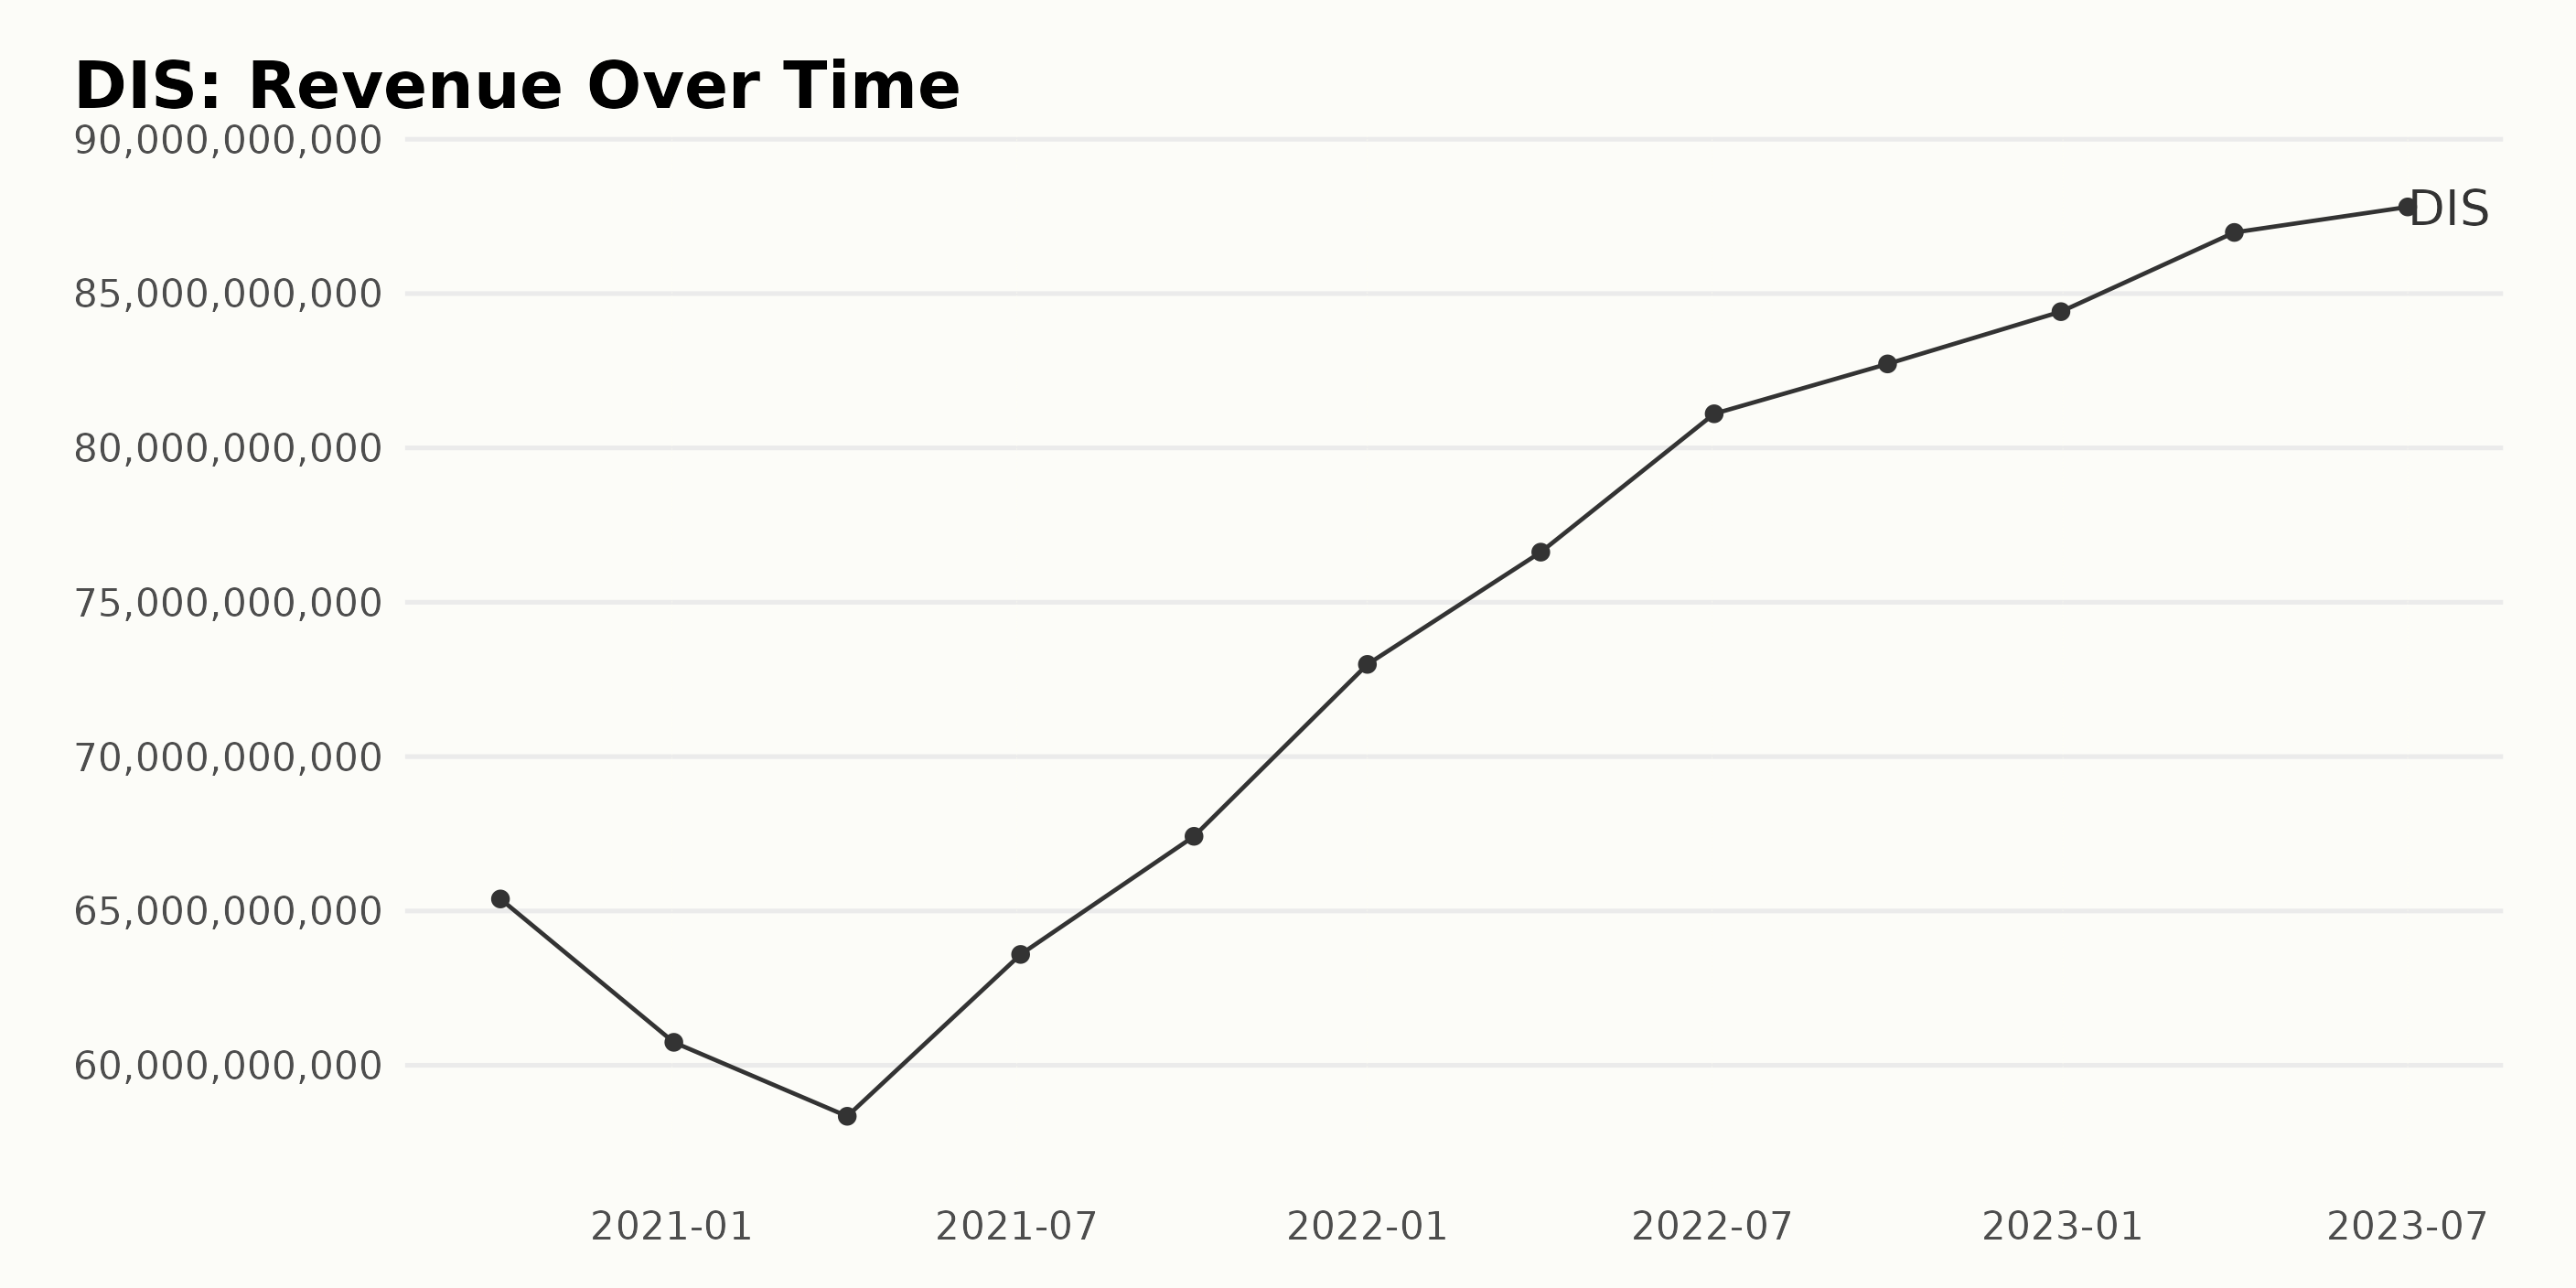
The trailing-12-month revenue of DIS demonstrated a growing trend from October 2020 to July 2023, albeit with some notable fluctuations.
- October 2020 - The company reported revenue of $65.39 billion.
- January 2021 - A marginal revenue drop was recorded to $60.74 billion.
- April 2021 - The revenue saw another decline, dropping to $58.35 billion.
- July 2021 - An increase in revenue was seen with $63.59 billion.
- October 2021 - revenue jumped up again to $67.42 billion.
- January 2022 - The growing trend continued, with revenue reaching $72.99 billion.
- April 2022 - DIS reported an improved revenue of $76.62 billion.
- July 2022 - There was a significant revenue jump to $81.11 billion.
- October 2022 - Another increase took the revenue to $82.72 billion.
- December 2022 - DIS ended the year on a high note, with revenue at $84.42 billion.
- April 2023 - Continued growth took the revenue to $86.98 billion.
- July 2023 - The revenue saw a slight increase to $87.81 billion.
The most recent data, as of July 2023, suggests a gradual slowing in revenue growth, with only a minor increase from April's figure. Speaking to the overall trend, however, there is a substantial growth rate when comparing the last value ($87.81 billion) with the first ($65.39 billion).
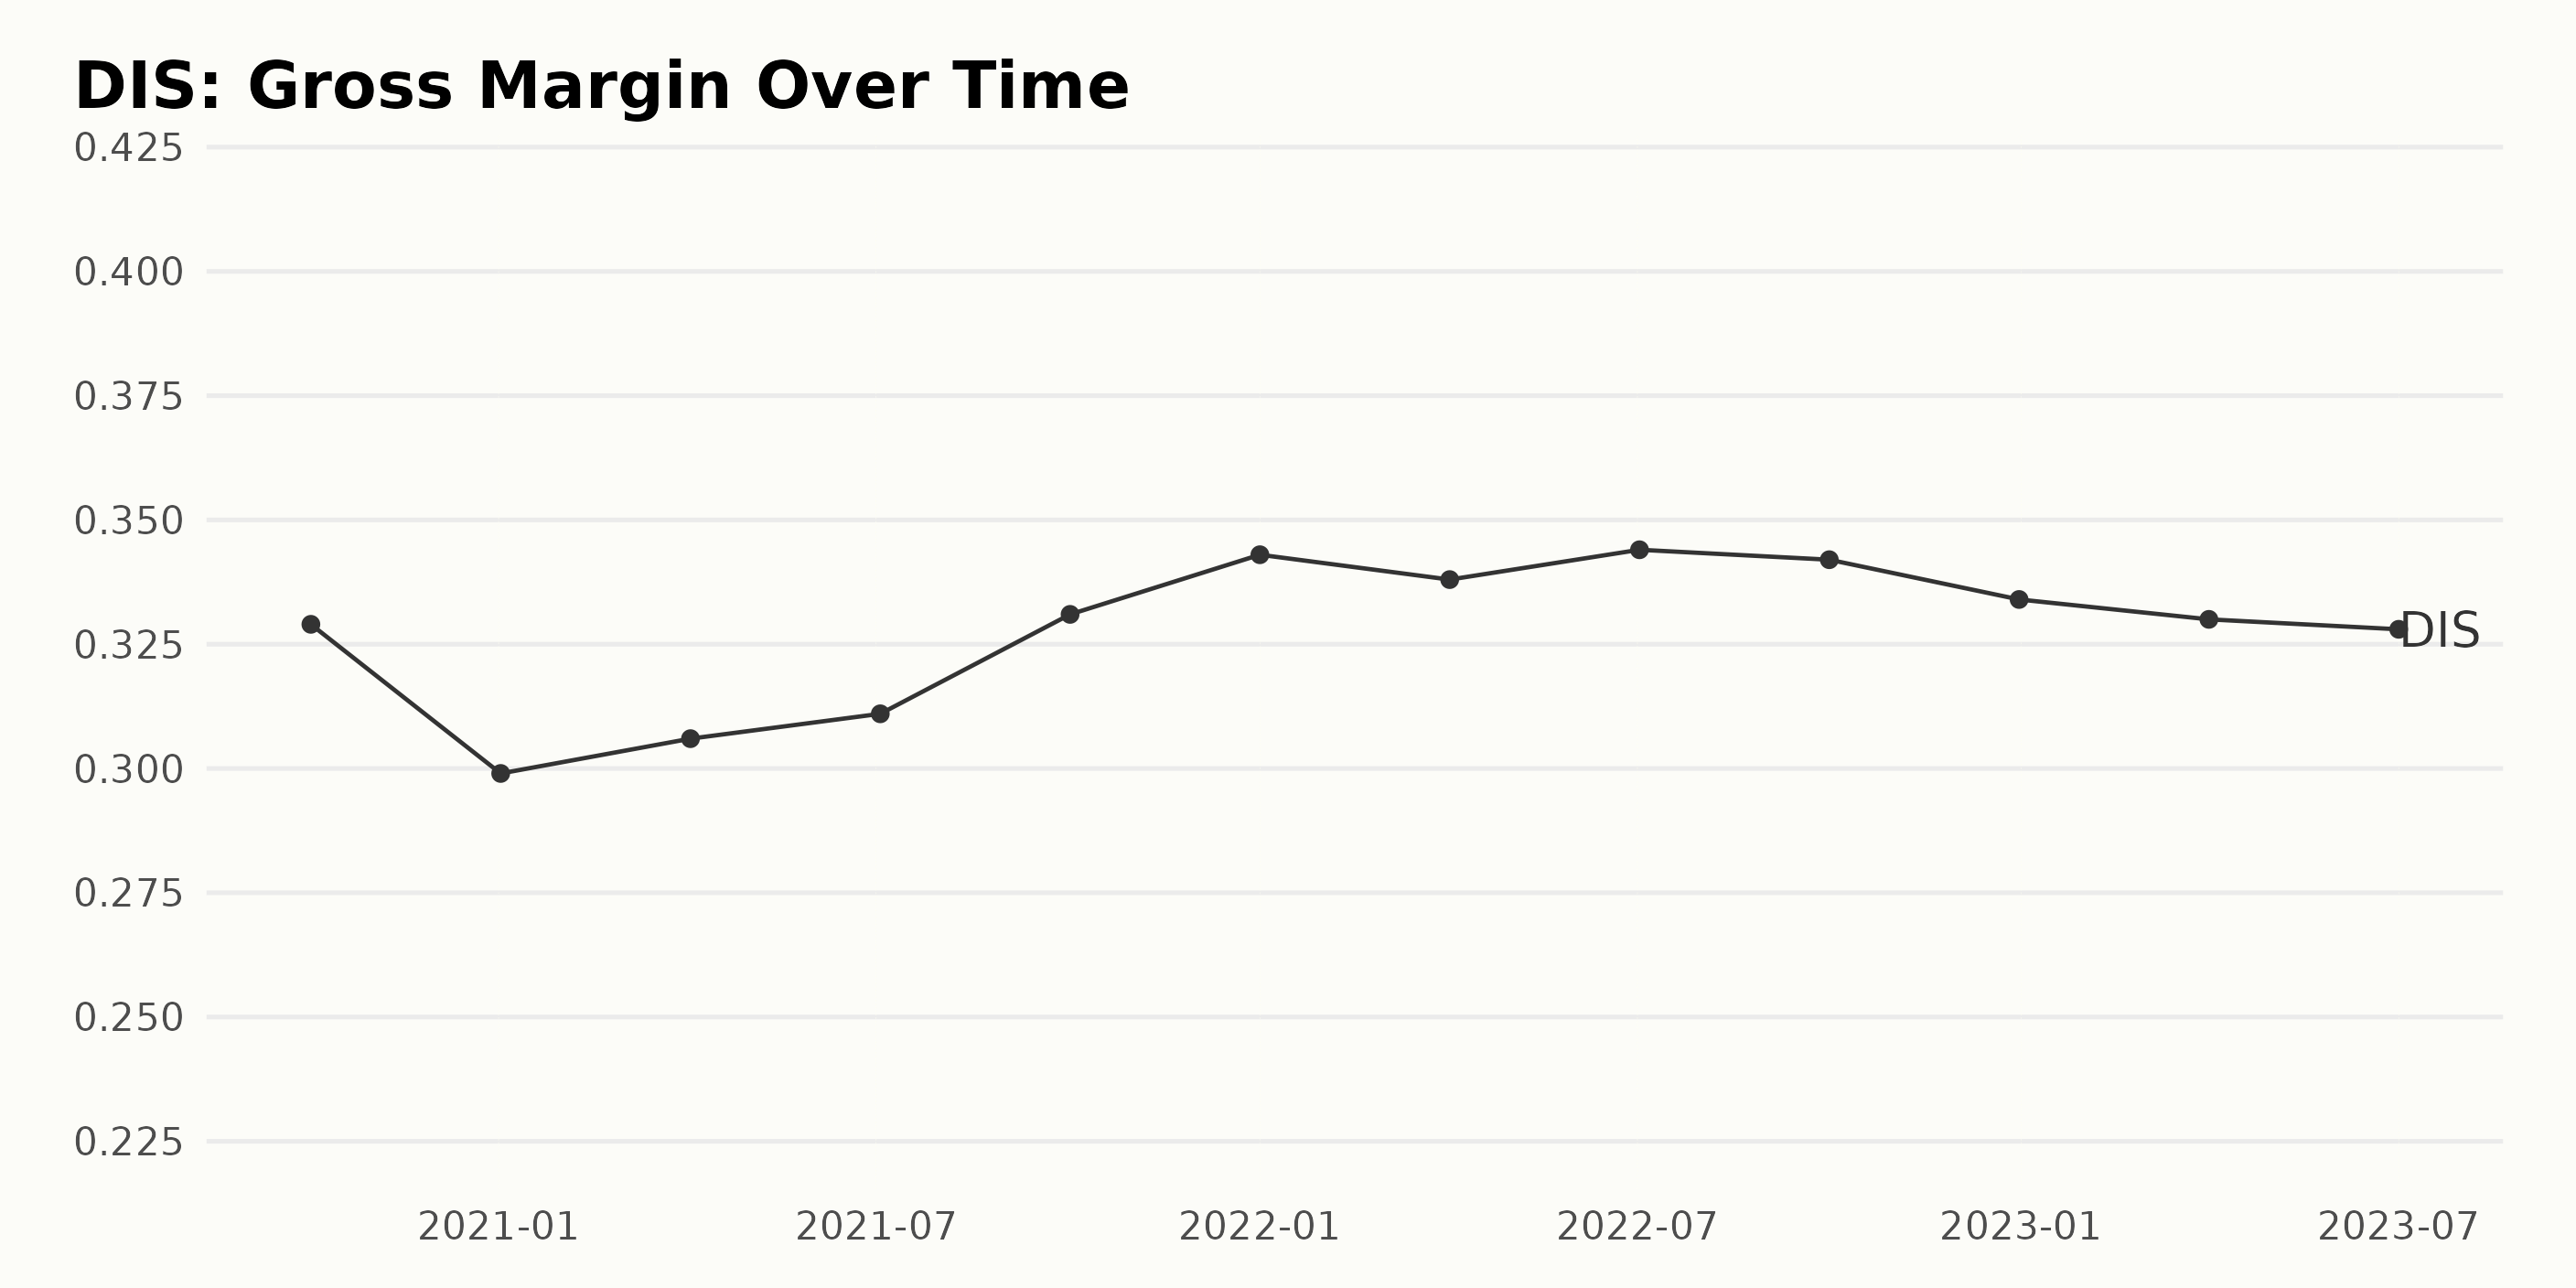
The Gross Margin of DIS has seen moderate fluctuations over the observed period. Following is a summary of the trends and fluctuations captured over various time intervals:
- On October 3, 2020, DIS reported a Gross Margin of 32.9%.
- There had been a significant drop to 29.9% by January 2, 2021, which indicates a decrease over this period.
- Subsequently, noteworthy upturns were noticeable in the Gross Margin, with an increase to 30.6% by April 3, 2021, and further to 31.1% by July 3, 2021.
- By October 2, 2021, it had risen sharply to reach 33.1%.
- A climb was seen until January 1, 2022, where it peaked at 34.3% - the highest in the observed period.
- After experiencing a slight dip to 33.8% by April 2, 2022, it again increased to 34.4% by July 2, 2022.
- However, we observed a minor decrease in the later part of 2022, dropping to 34.2% by October 1, 2022, and further to 33.4% by December 31, 2022.
- Moving into 2023, the Gross Margin decreased slightly to 33.0% on April 1 and further to 32.8% on July 1.
The recent data has indicated a decreasing trend in Walt Disney's Gross Margin after achieving its highest value at the start of 2022. The overall growth measured from the first value (32.9% on October 3, 2020) to the last value (32.8% on July 1, 2023) is marginally negative, indicating relatively stable but slightly declining Gross Margins across this time period.
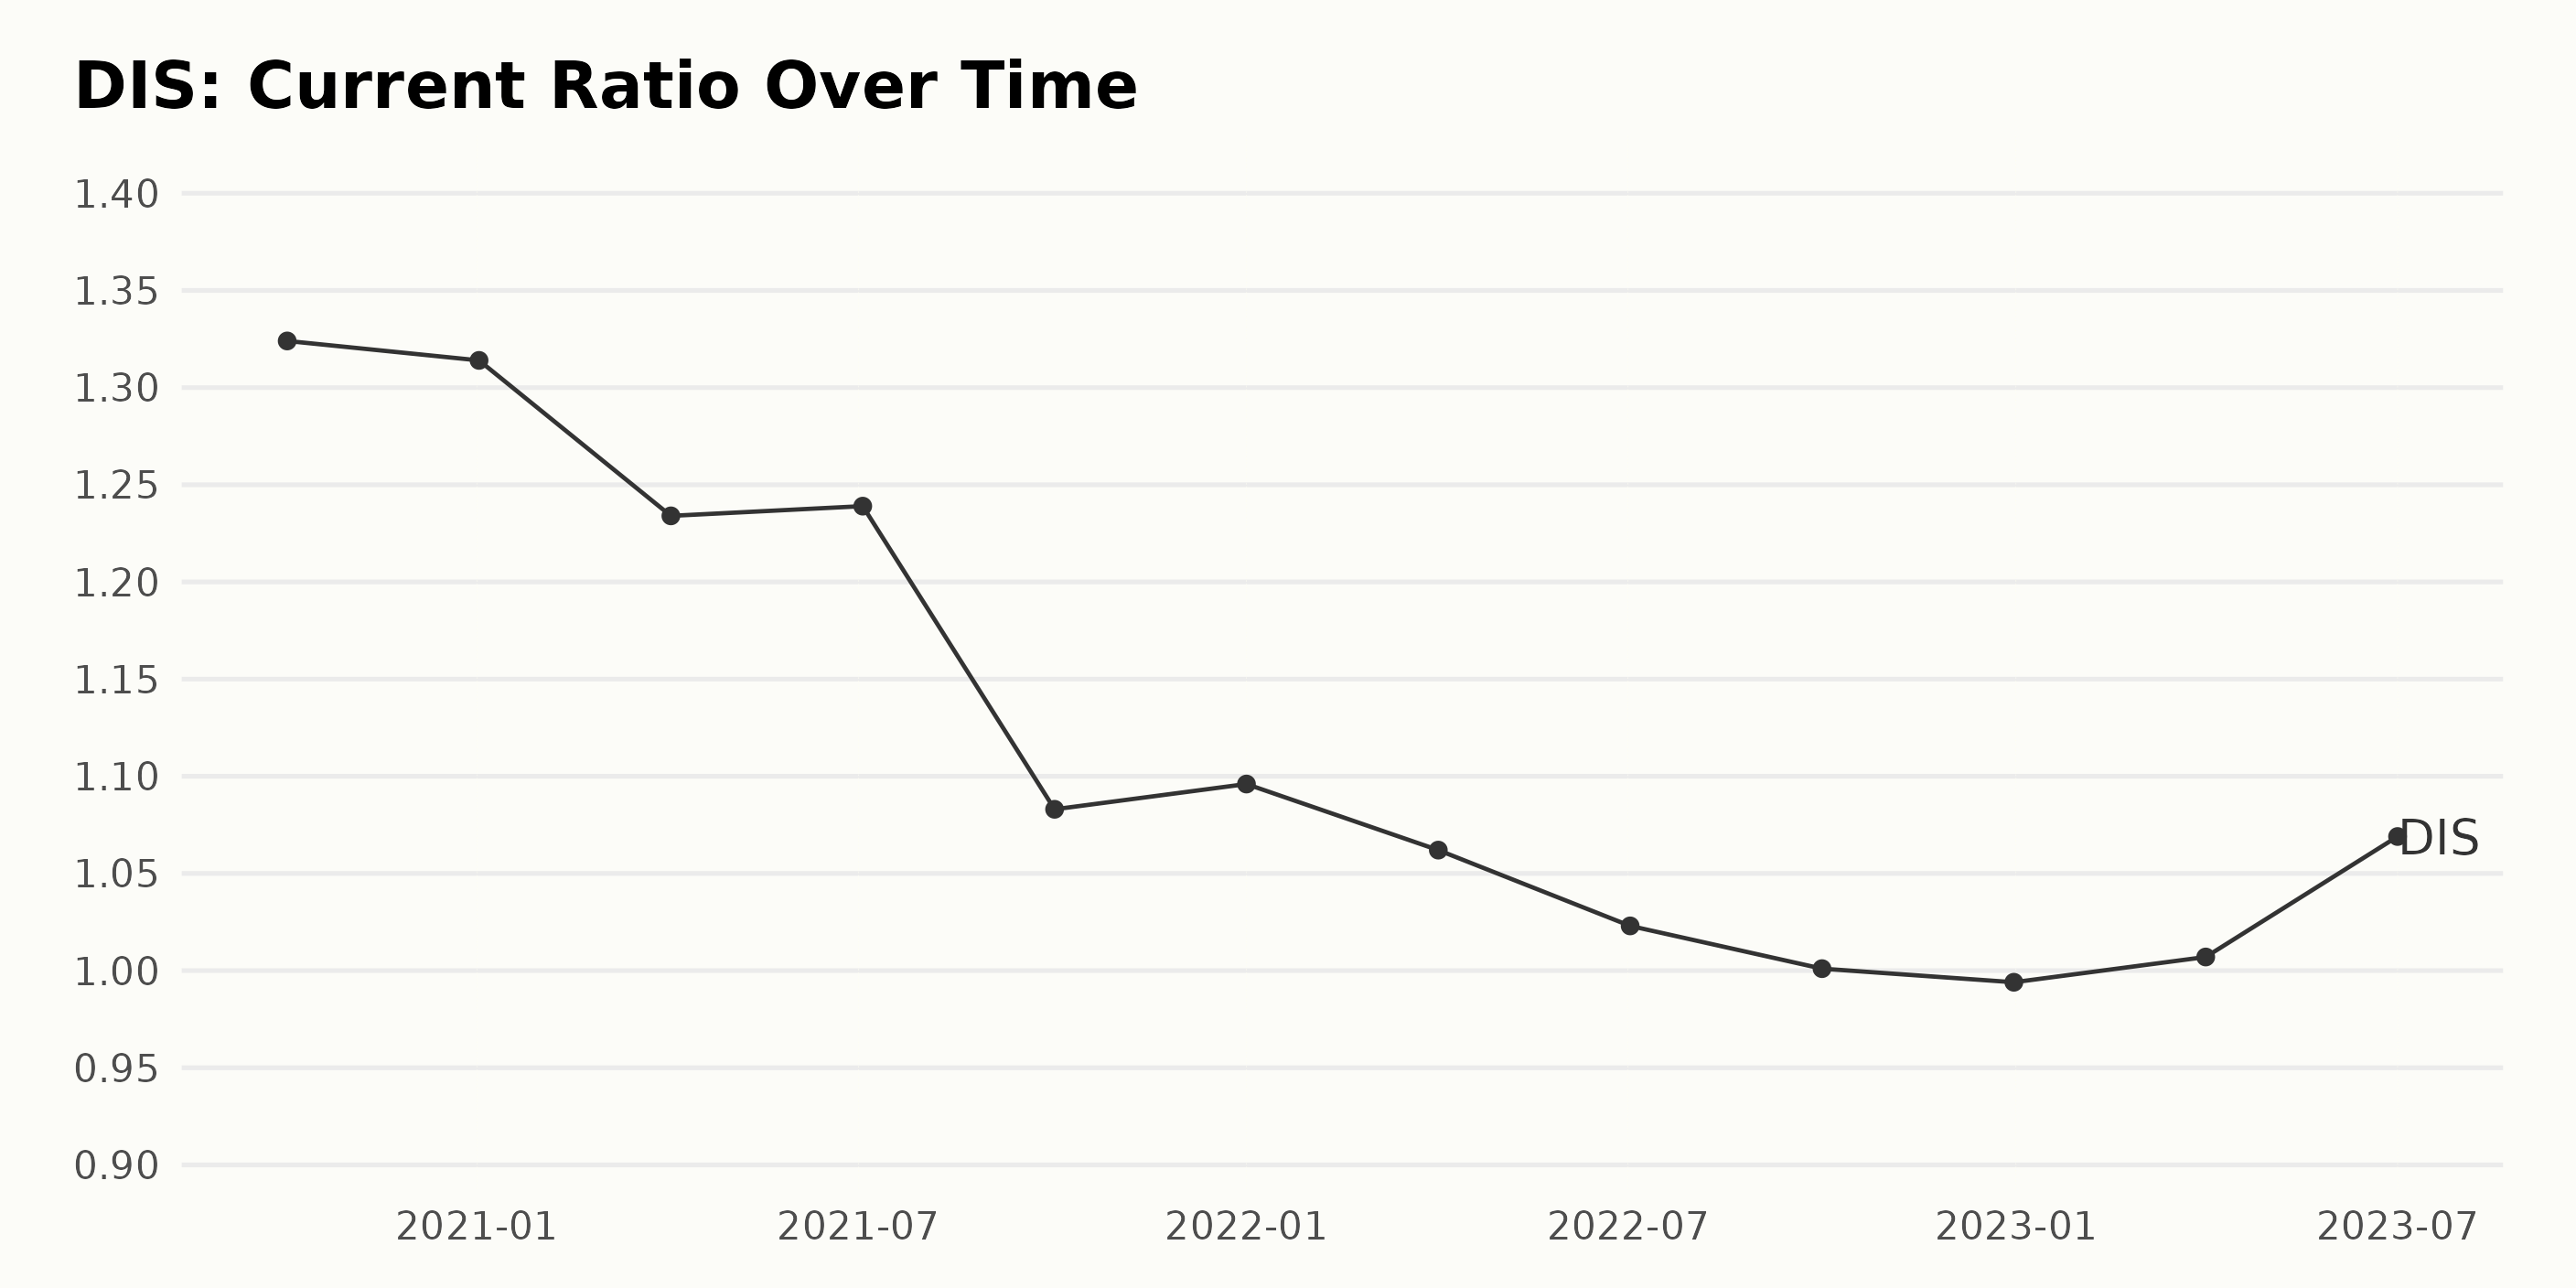
The Current Ratio trend for DIS has generally seen a gradual decline since October 2020 until late 2022, with occasional minor fluctuations.
- Starting at 1.32 in October 2020, the ratio decreases over the following year with values of 1.31 in January 2021, 1.23 in April 2021, and 1.24 in July 2021.
- In October 2021, there was a noticeable drop to 1.08. The downward trajectory continues into 2022 with values of 1.10 in January, 1.06 in April, and 1.02 in July.
- By October 2022, the Current Ratio nearly reaches equilibrium at 1.00, followed by a slight dip below 1 to 0.99 in December 2022.
- However, there is a reversal in this trend from early 2023. The Current Ratio begins to increase once more, recording 1.01 in April 2023 and marking a significant recovery to 1.07 by July 2023.
Measuring the growth rate from the first value in October 2020 (1.32) to the last in July 2023 (1.07) it indicates a decrease of approximately 19%. This highlights a notable downward trend across the almost three-year period, despite the recent upturn towards the end of the given data. More recent data points suggest potential signs of improvement for The Walt Disney Company's liquidity position.
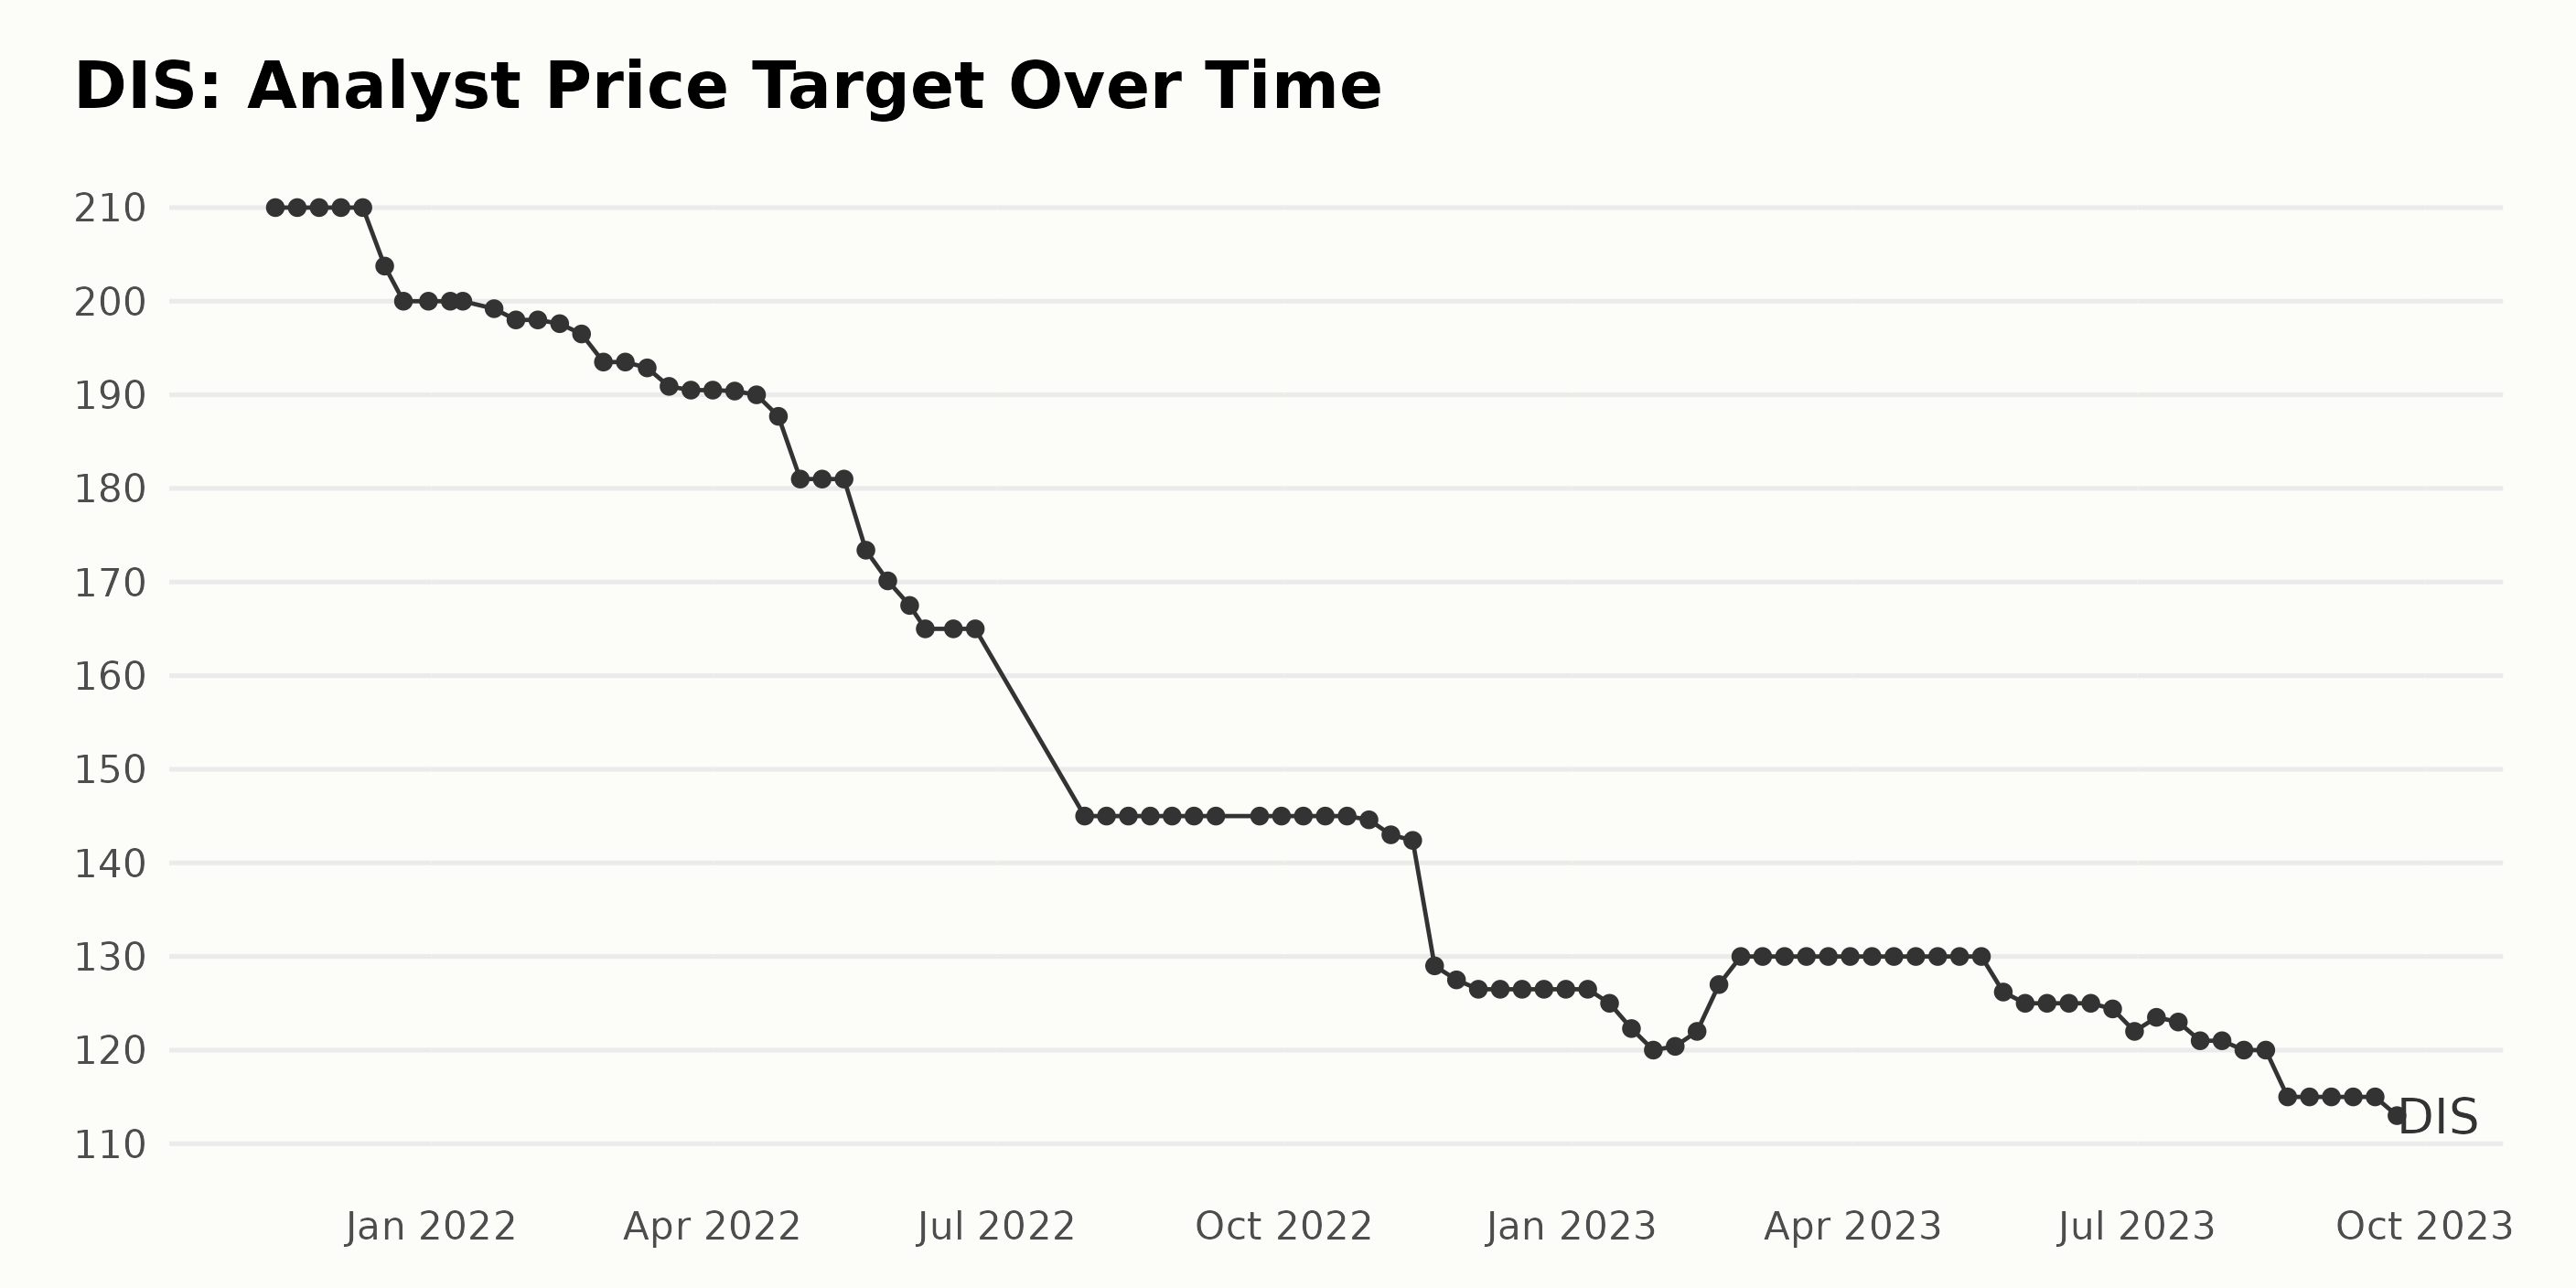
Based on the given series of data for DIS’ Analyst Price Target, the following conclusions can be drawn:
- In the initial phase, the Analyst Price Target shows a consistent value of $210 from November 12, 2021, to December 10, 2021.
- From December 17, 2021, onwards, a downward trend begins, with the price target reducing consistently week-on-week, reaching a value of $165 by June 24, 2022. The largest decrease is observed in July 2022, where the price falls sharply to $145.
- The price target remains steady at $145 until October 28, 2022, whereupon it experiences another dip, reaching $126.5 by December 23, 2022.
- A brief upward trend is seen starting February 3, 2023, with the price peaking at $130 and remaining at this level up until May 19, 2023.
- Thereon, the price starts to decline again, reaching as low as $115 by August 18, 2023, the lowest in the given data set.
- The final data point available records the Analyst Price Target at $113 as of September 22, 2023.
Overall, comparing the Analyst Price Target from the start of our data series (November 12, 2021 - $210) and the end (September 22, 2023 - $113), there's a decrease of approximately $97. This suggests a negative growth rate of around 46% over the depicted time period. The declining trend through most of the data indicates a moderately bearish sentiment from analysts regarding DIS during this timespan.
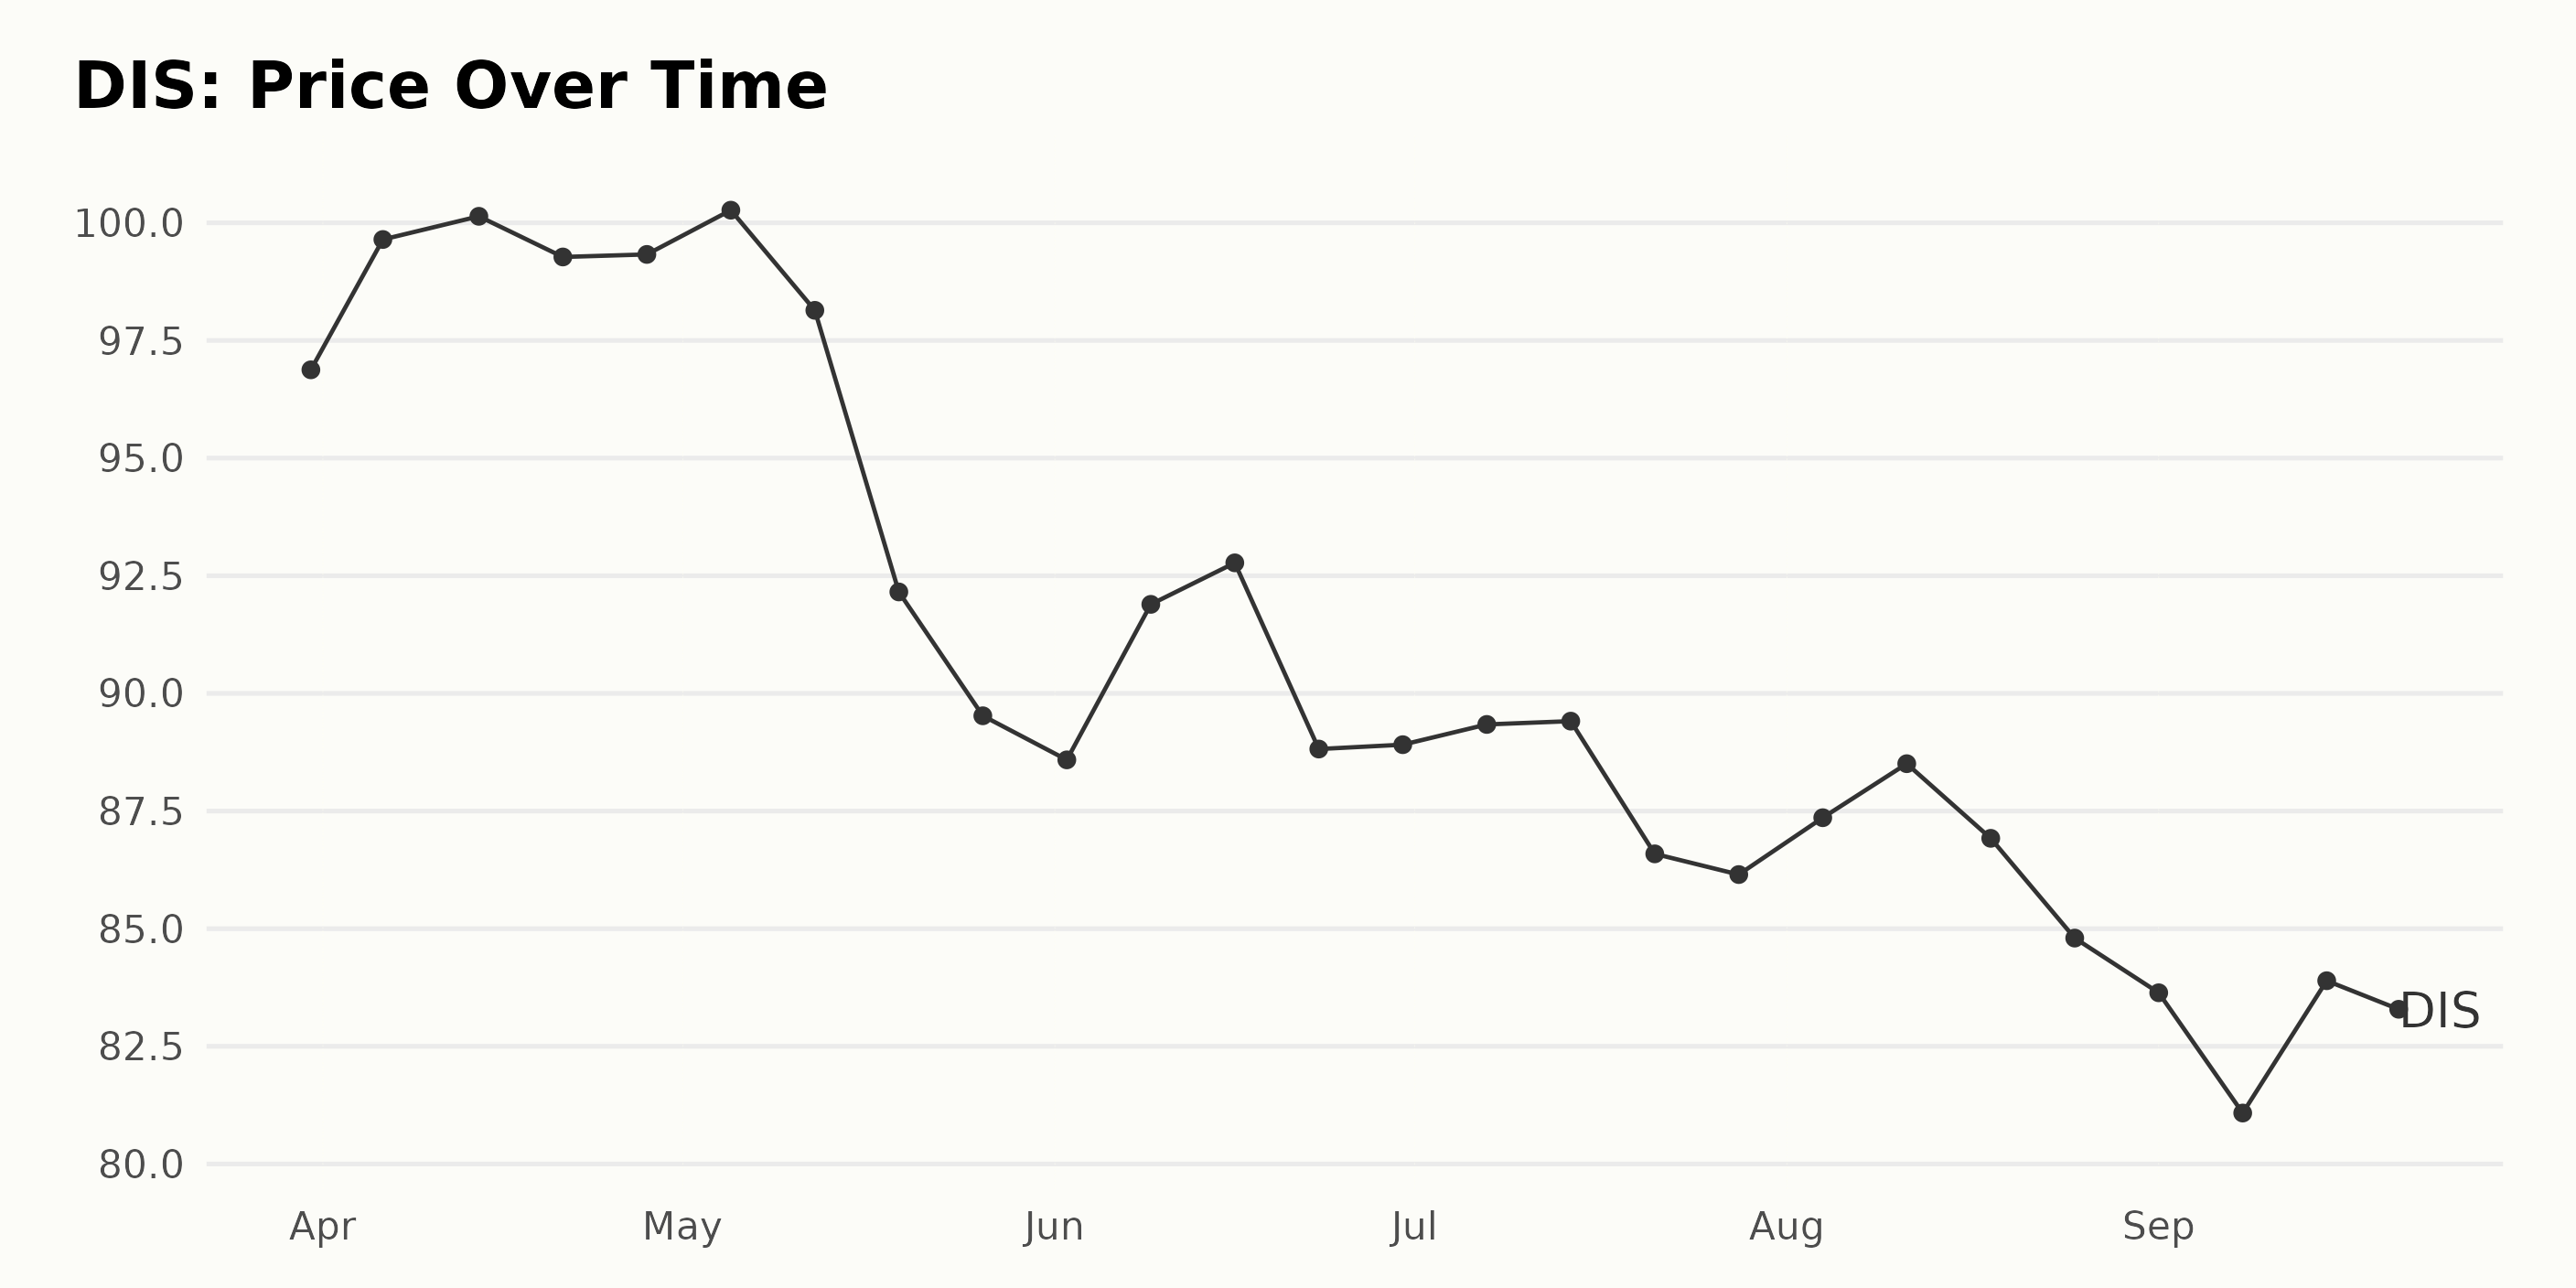
Analyzing Walt Disney Company's Share Price Fluctuations from March to September 2023
The summary of the share price trends for DIS from March to September 2023 is as follows:
- March 31, 2023: $96.88.
- April 6, 2023: $99.65. We see a growth in the price.
- There is a slight increase until April 14, 2023, to $100.14, after which the price slowly decreases through late-April to May with minor variations, hitting $99.33 on April 28, 2023.
- In May 2023, the price fluctuates, initially increasing to $100.27 by May 5, then decreasing to $92.16 by May 19, and reaching it’s lowest at $89.52 on May 26, 2023.
- June shows another wave of fluctuation, with the price first decreasing to $88.59 by June 2, 2023, then increasing to $92.77 by June 16, 2023, but dropping again to $88.91 by the end of the month.
- Through July, the price remains fairly stable around $89 range but ends the month at a lower $86.15 on July 28, 2023.
- By August 4, 2023, the price sees a small increase to $87.36 and continues to rise to $88.51 by August 11. However, towards the end of August, the price once more decreases to $84.8.
- September 1, 2023, sees a share price of $83.64, further dropping to its lowest point of $81.08 on September 8. It shows a slight recovery to $83.29 by September 21, 2023.
Overall, the initial data from March to April 2023 shows a growth in the price of the shares of DIS. The price begins a fluctuating pattern of ups and downs from May onwards, with notable decrease towards the end of the period. This indicates a decelerating trend in the share price starting from May 2023. Here is a chart of DIS's price over the past 180 days.
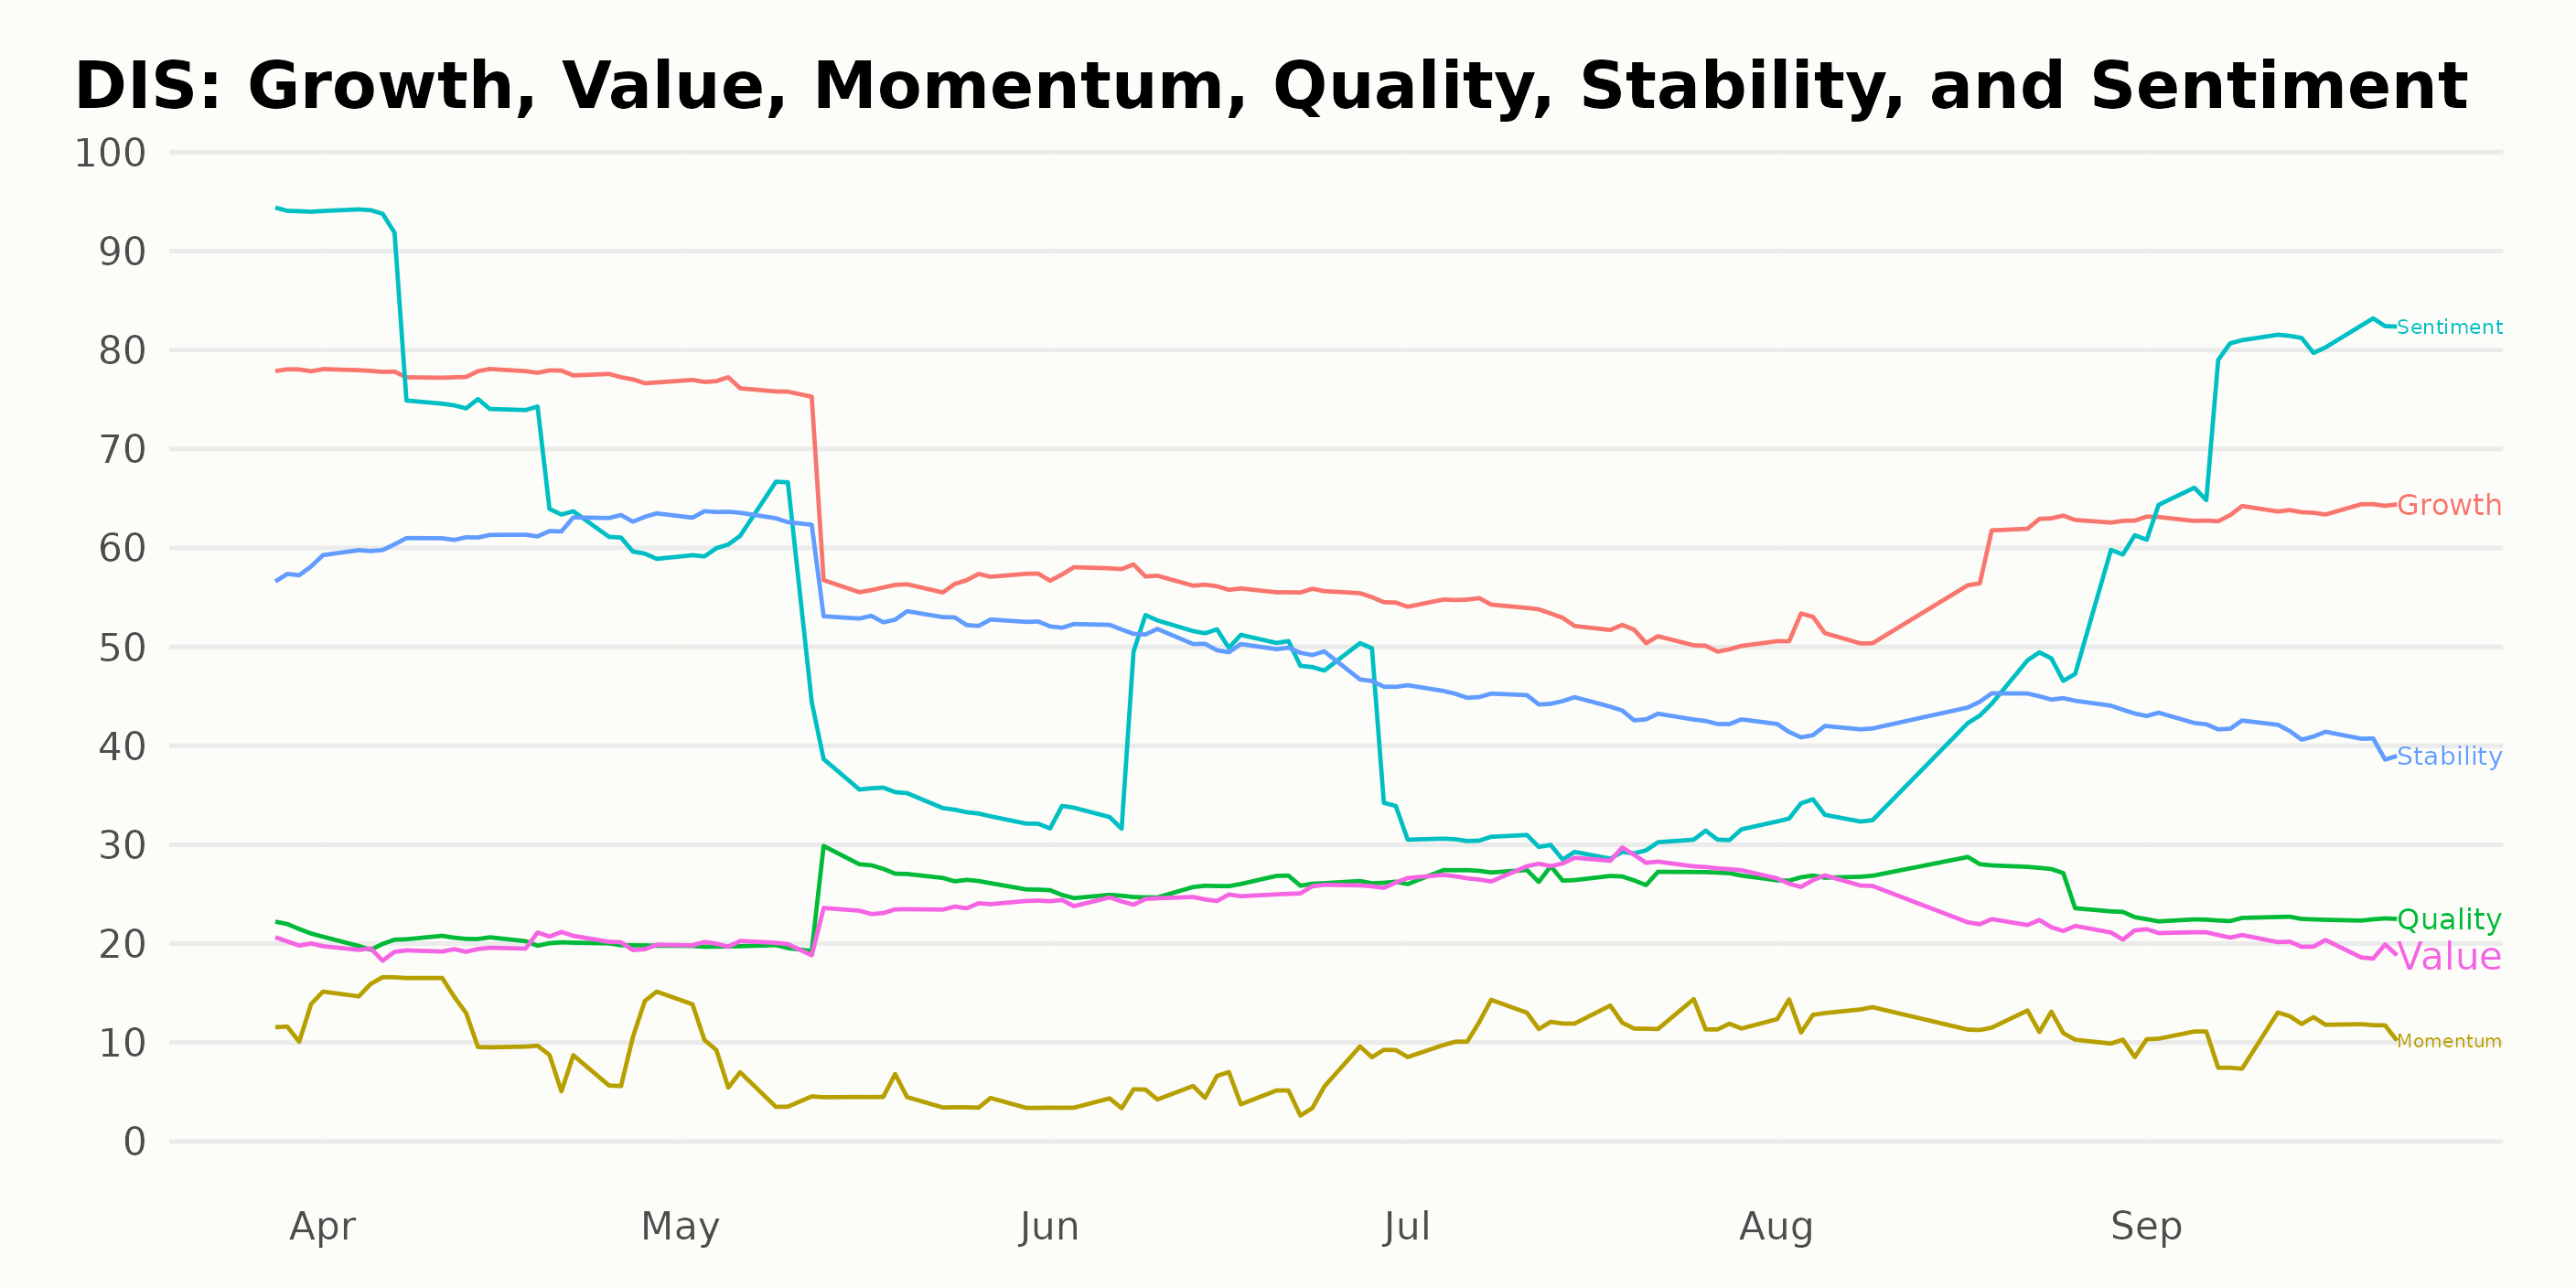
Analyzing Walt Disney's Growth, Sentiment, and Stability Ratings in 2023
DIS has an overall D rating, translating to a Sell in our POWR Ratings system. It is ranked #8 out of the ten stocks in the Entertainment - Media Producers category.
The three most noteworthy dimensions of the POWR Ratings for DIS are Growth, Sentiment, and Stability. Here is an analysis of these three dimensions: -
Growth: The Growth rating mainly fluctuated from March to September 2023, starting at a high point of 78 in March 2023 and dipping to a low point of 52 by July 2023. However, it saw a gradual increase towards September 2023, reaching a level of 64.
Sentiment: The Sentiment score experienced quite a dramatic drop from its highest point of 94 in March 2023 to its lowest point of 30 in July 2023. Despite this significant decline, an upturn occurred in September 2023, with the sentiment score reaching 77.
Stability: The Stability dimension score steadily declined over the observed period, from a peak of 57 in March 2023 to 42 in September 2023. This suggests that there has been some increased uncertainty, based on this metric, about the company's performance.
In summary, these three dimensions indicate a mix of positive and negative trends for The Walt Disney Company during the period from March to September 2023. It's important to continue monitoring these trends to obtain a comprehensive understanding of the company's position and developments.
Stocks to Consider Instead of The Walt Disney Company (DIS)
Other stocks in the sector that may be worth considering are Endeavor Group Holdings, Inc. (EDR), TEGNA Inc (TGNA), and News Corporation (NWSA) -- they have better POWR Ratings.
What To Do Next?
Discover 10 widely held stocks that our proprietary model shows have tremendous downside potential. Please make sure none of these “death trap” stocks are lurking in your portfolio:
DIS shares were trading at $82.12 per share on Friday afternoon, down $0.61 (-0.74%). Year-to-date, DIS has declined -5.48%, versus a 14.60% rise in the benchmark S&P 500 index during the same period.
About the Author: Subhasree Kar

Subhasree’s keen interest in financial instruments led her to pursue a career as an investment analyst. After earning a Master’s degree in Economics, she gained knowledge of equity research and portfolio management at Finlatics.
The post Walt Disney Co. (DIS): What Does the Rest of September Look Like for This Entertainment Stock? appeared first on StockNews.com