
fuboTV Inc. (FUBO) is a live TV streaming platform operator that offers live sports, news, and entertainment content globally. The company’s shares have gained 71.9% over the past three months, buoyed by its first-quarter results and raised guidance.
However, the company’s profitability is still in the red. Its trailing-12-month net income margin of negative 46.24% is significantly lower than the 2.81% industry average. Moreover, FUBO does not expect positive cash flow before 2025 based on its current operating plan.
Given this backdrop, let’s look at the trends of FUBO’s key financial metrics to understand why it could be wise to avoid the stock now.
Analyzing FUBO's Financial Trends: Net Income Declines Amid Revenue and Gross Margin Fluctuations
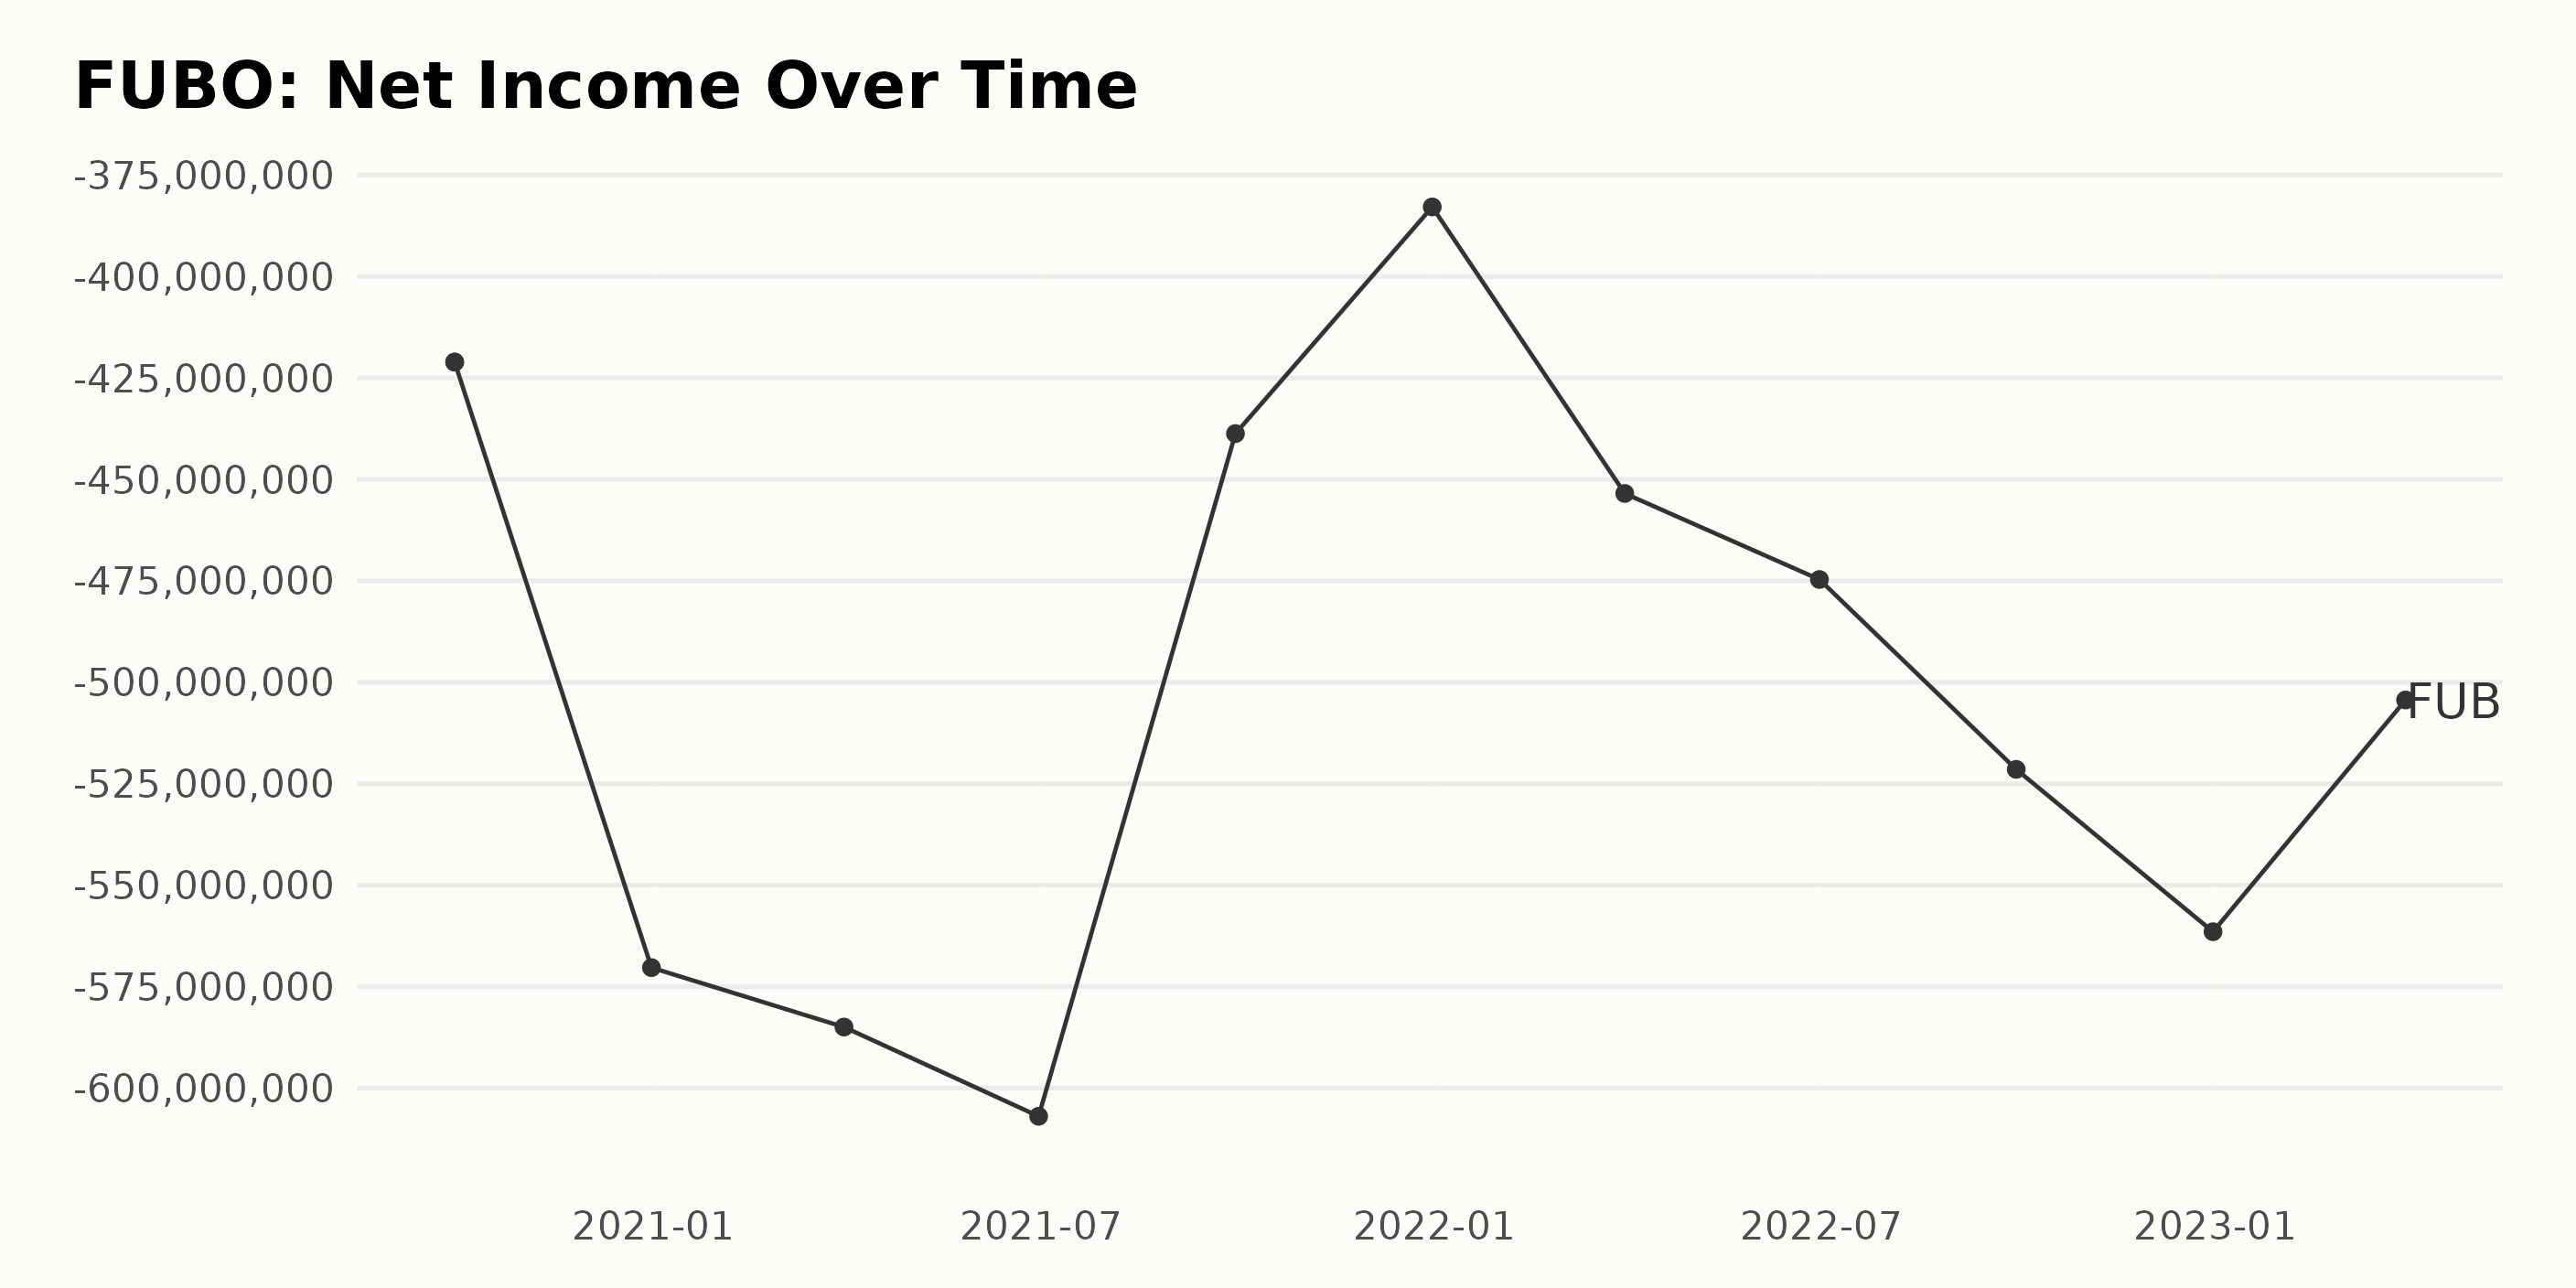
Analyzing the trailing-12-month net income of FUBO, the data reflects a general descending trend from September 2020 to March 2023. Here's the summarized data in a readable format:
- Net Income on September 30, 2020: -$421.08 million
- Net Income on December 31, 2020: -$570.33 million
- Net Income on March 31, 2021: -$584.97 million
- Net Income on June 30, 2021: -$606.97 million
- Net Income on September 30, 2021: -$438.70 million
- Net Income on December 31, 2021: -$382.84 million
- Net Income on March 31, 2022: -$453.45 million
- Net Income on June 30, 2022: -$474.66 million
- Net Income on September 30, 2022: -$521.46 million
- Net Income on December 31, 2022: -$561.48 million
- Net Income on March 31, 2023: -$504.37 million
The net income figures of FUBO initially experienced a sharp decline from -$421.08 million in September 2020 to -$606.97 million in June 2021. The latter part of 2021 saw a brief respite and even depicted an encouraging picture as net income rose to -$382.84 million in December 2021.
However, this trend was short-lived, and since early 2022, FUBO's net income has taken a downward plunge again, dropping to -$561.48 million by the end of 2022, although there was a slight improvement to -$504.37 million in March 2023.
The most recent data for FUBO's net income at the end of Q1 of 2023 stood at -$504.37 million. Thus, despite minor fluctuations, FUBO's overall financial performance indicated a loss during this period.
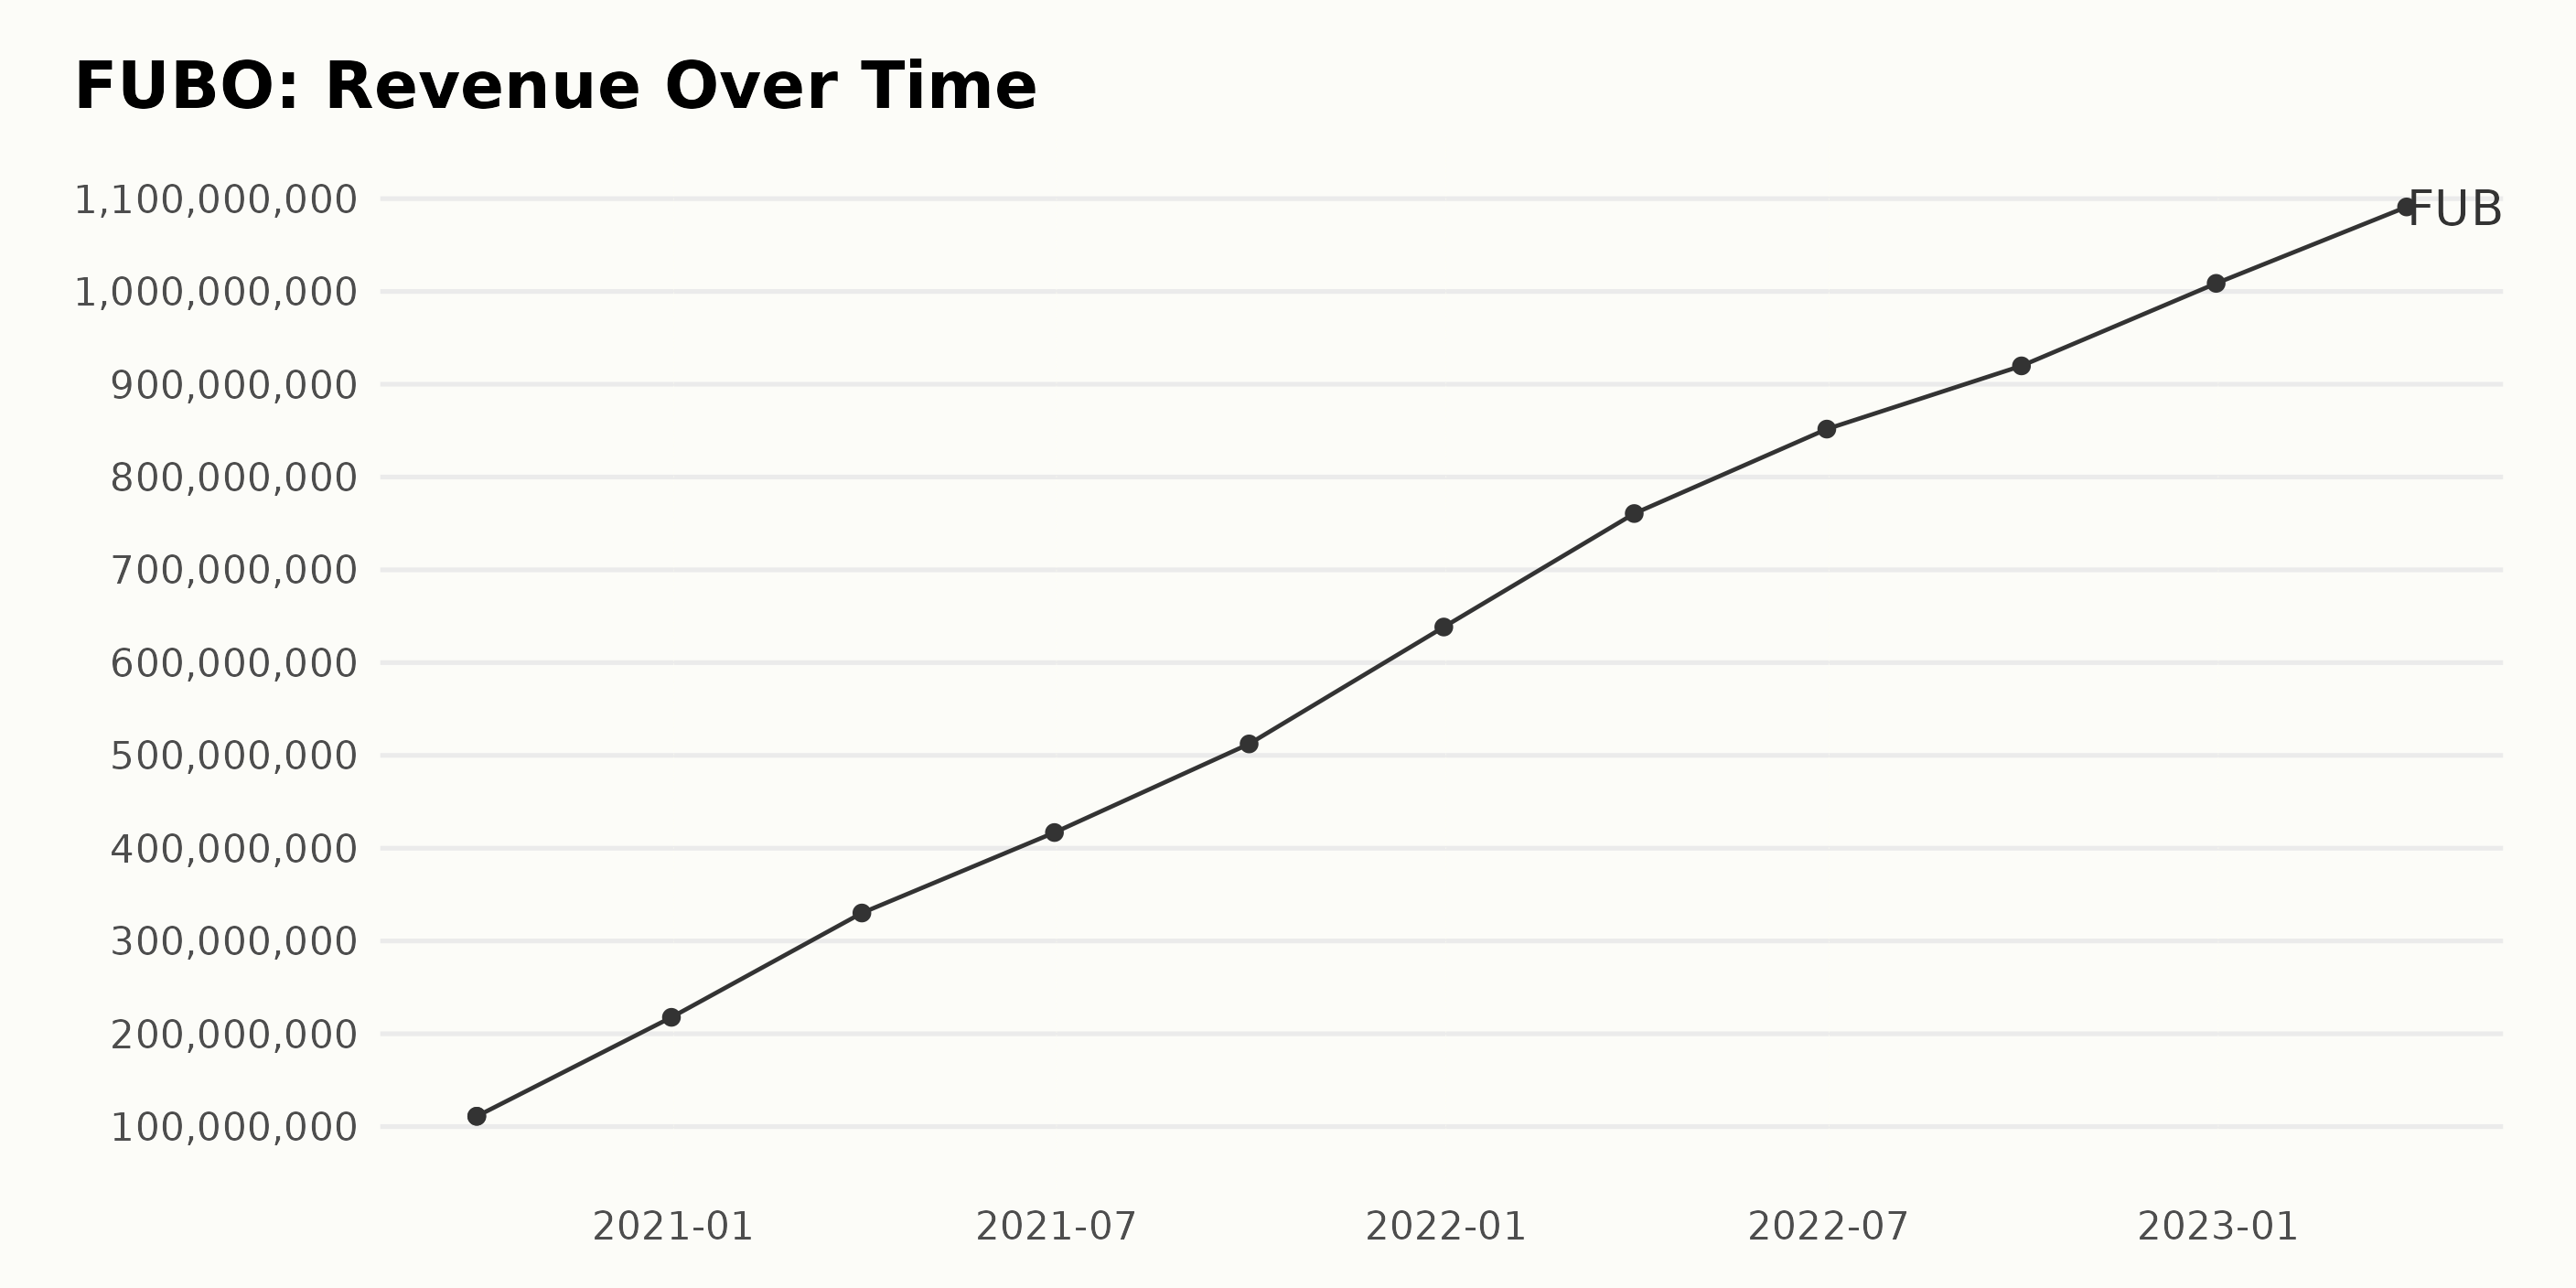
The trailing-12-month revenue of FUBO shows a consistent upward trend, showing significant growth across the time series. Here are some key points summarizing FUBO's Revenue performance:
- On September 30, 2020, FUBO's revenue was $111.11 million.
- From September 2020 to December 2022, the figures indicate a relatively exponential increase, with few fluctuations but consistent growth. Revenue jumped from $111.11 million in September 2020 to $1.01 billion by December 2022.
- A substantial increase appeared within the first quarter of 2021 as revenue moved from $217.75 million in December 2020 to $330.17 million by March 2021.
- The subsequent bi-quarterly growth remained consistent as we see the progression: $416.88 million (June 2021), $512.37 million (September 2021), and $638.35 million (December 2021).
- In 2022, revenue continued to grow steadily, with the figures at the end of each quarter being $760.65 million, $851.66 million, $919.38 million, and finally, $1.01 billion, respectively.
- The first quarter of 2023 records another increase, with FUBO's revenue reaching $1.09 billion.
Overall, this data suggests that the total revenue growth rate from September 2020 to March 2023 for FUBO is approximately 881.53%. This strong upward trend signals a robust financial performance for FUBO. However, the latest data seem to indicate a gradual slowing in the rate of Revenue increase.
The growth rate from December 2022 to March 2023 has dipped, suggesting that while FUBO's revenue is still increasing, the company might be beginning to reach a saturation point in its current markets or product offerings.
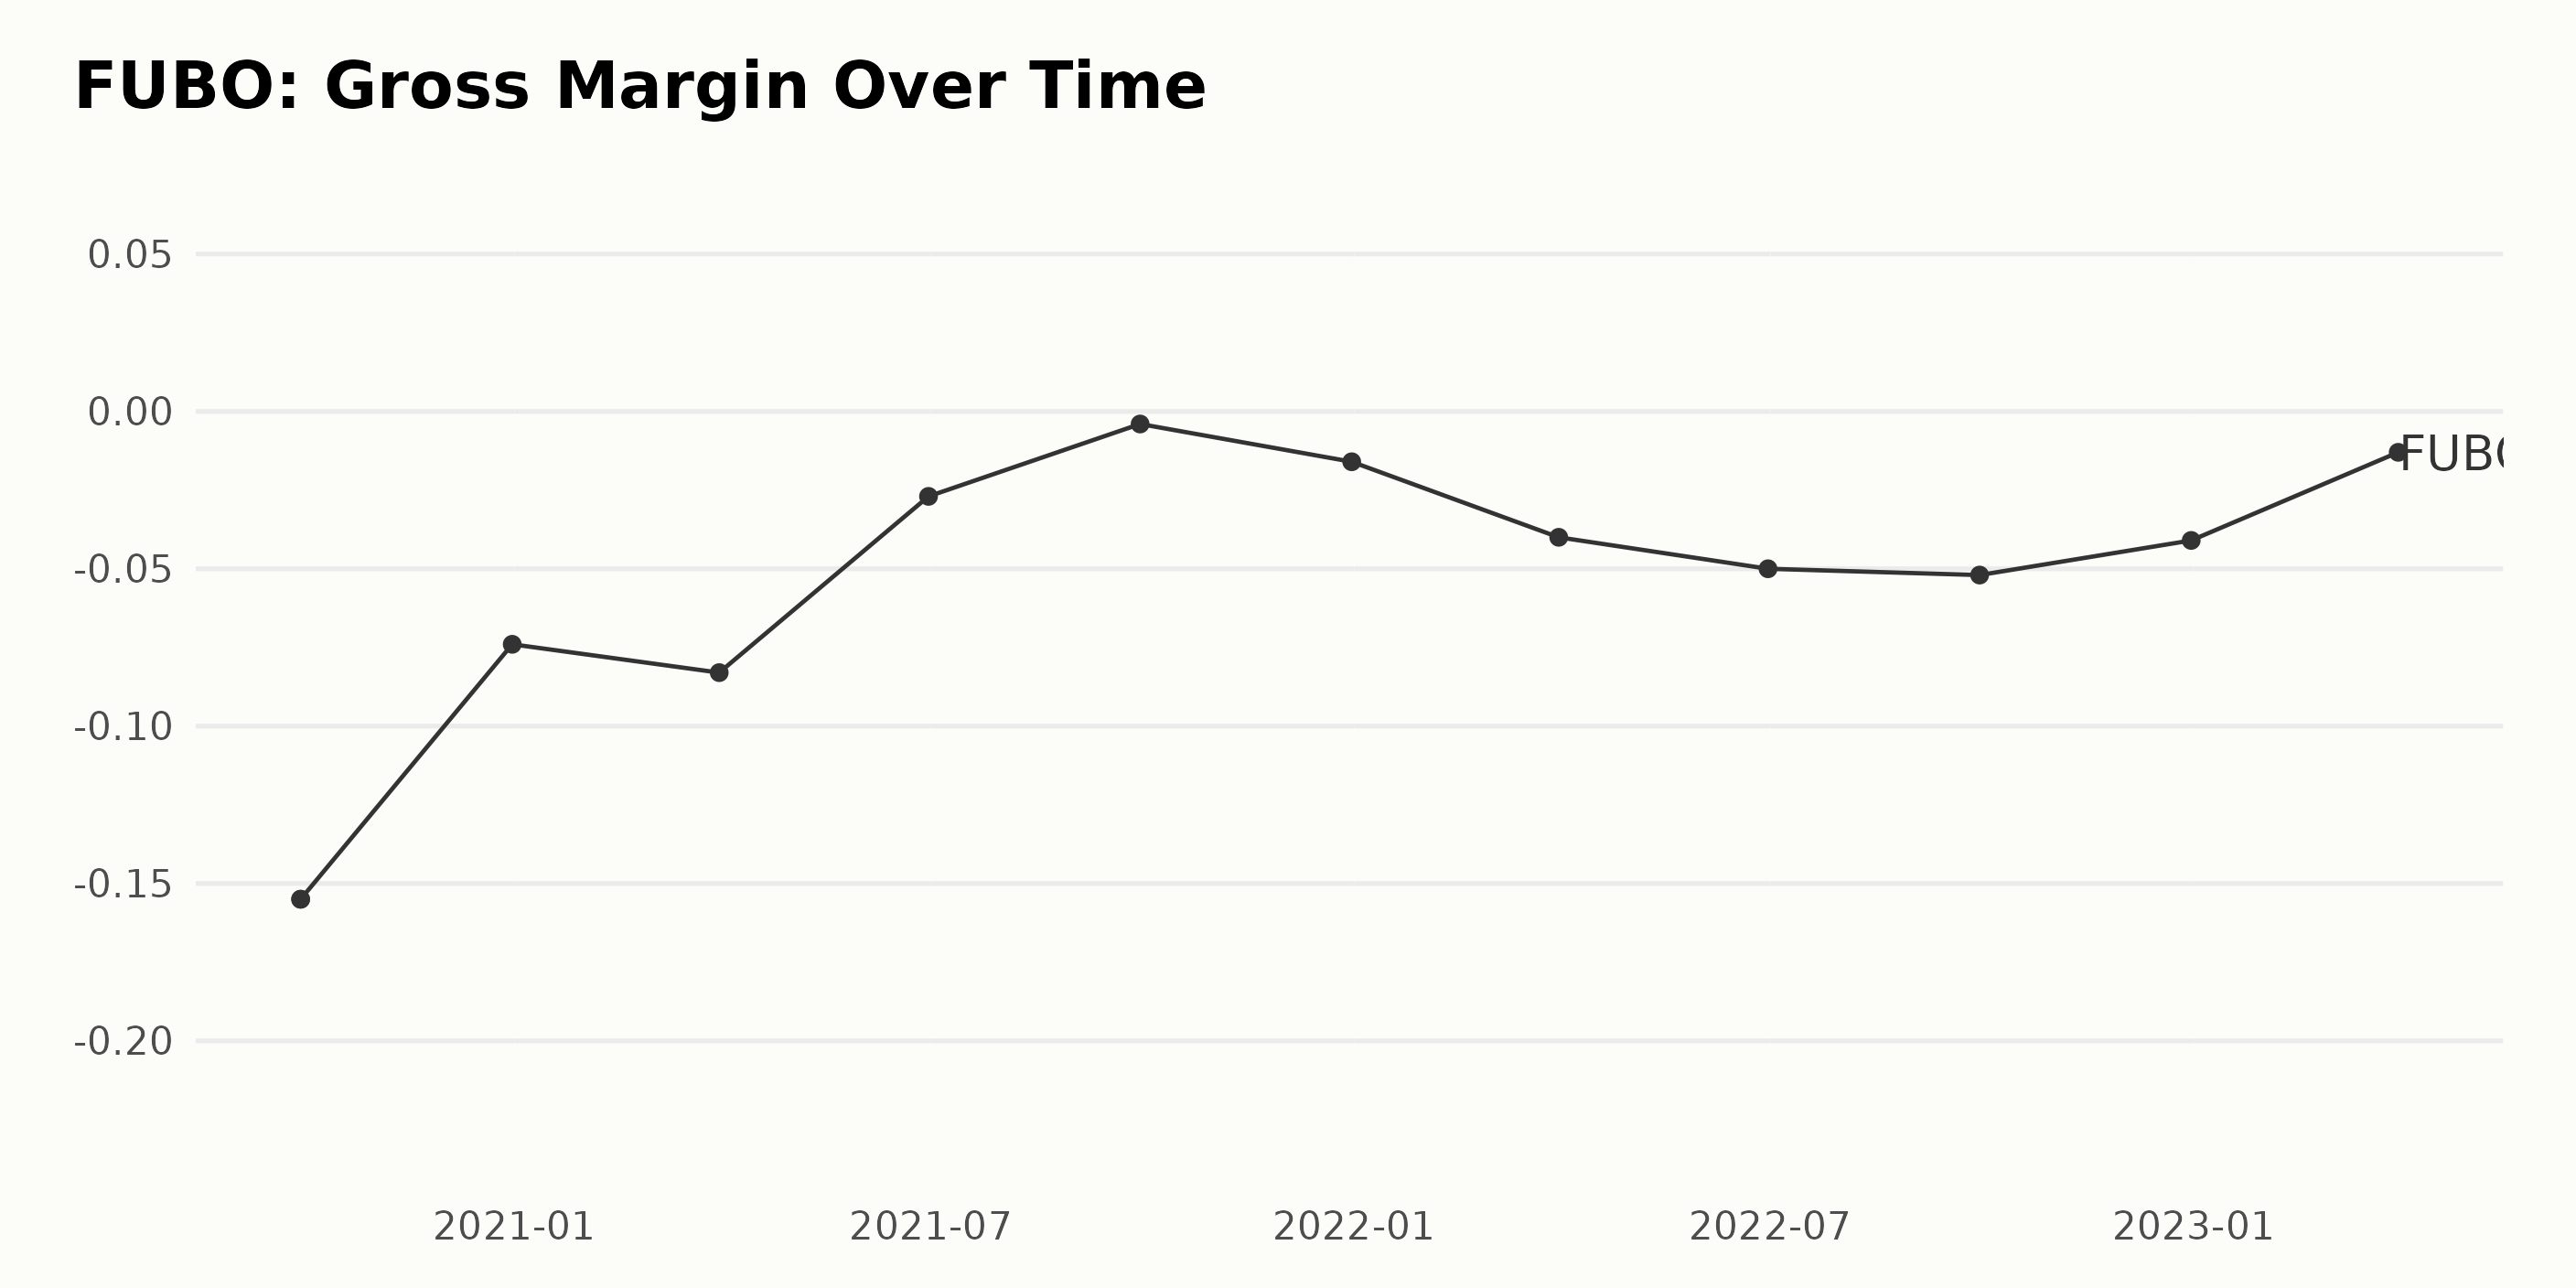
The gross margin of FUBO has experienced significant fluctuations over the observed timeline. Here is a summary of the trend:
- The company started with a gross margin of -15.5% in September 2020. From there, it saw several dips and peaks until March 2023.
- By December 2020, FUBO's gross margin had improved significantly to -7.4%. However, we witnessed a slight increase in the negative margin to -8.3% in March 2021.
- There was substantial progress in the second and third quarters of 2021 as the values increased to -2.7% and -0.4%, respectively.
- Unfortunately, this upward streak didn't hold as the gross margin encountered a sharp drop, hitting -1.6% by the end of 2021. The downturn continued into the year 2022, with the gross margin falling to -4.0% in March, -5.0% in June, and -5.2% in September.
- By the close of 2022, the gross margin had slightly improved to -4.1%, but it was still underperforming compared to the previous year's similar quarter.
- Finally, by March 2023, we noted an improvement as the gross margin for FUBO increased to -1.3%, which may signal a possible recovery or positive outlook.
Generally, FUBO's gross margin trends depict a company that faced substantial challenges at the start, managed to pull a short-lived recovery in mid-2021 but later struggled with maintaining stability. The calculated growth rate from the initial point in September 2020 to the last data point in March 2023 is approximately 14.2%.
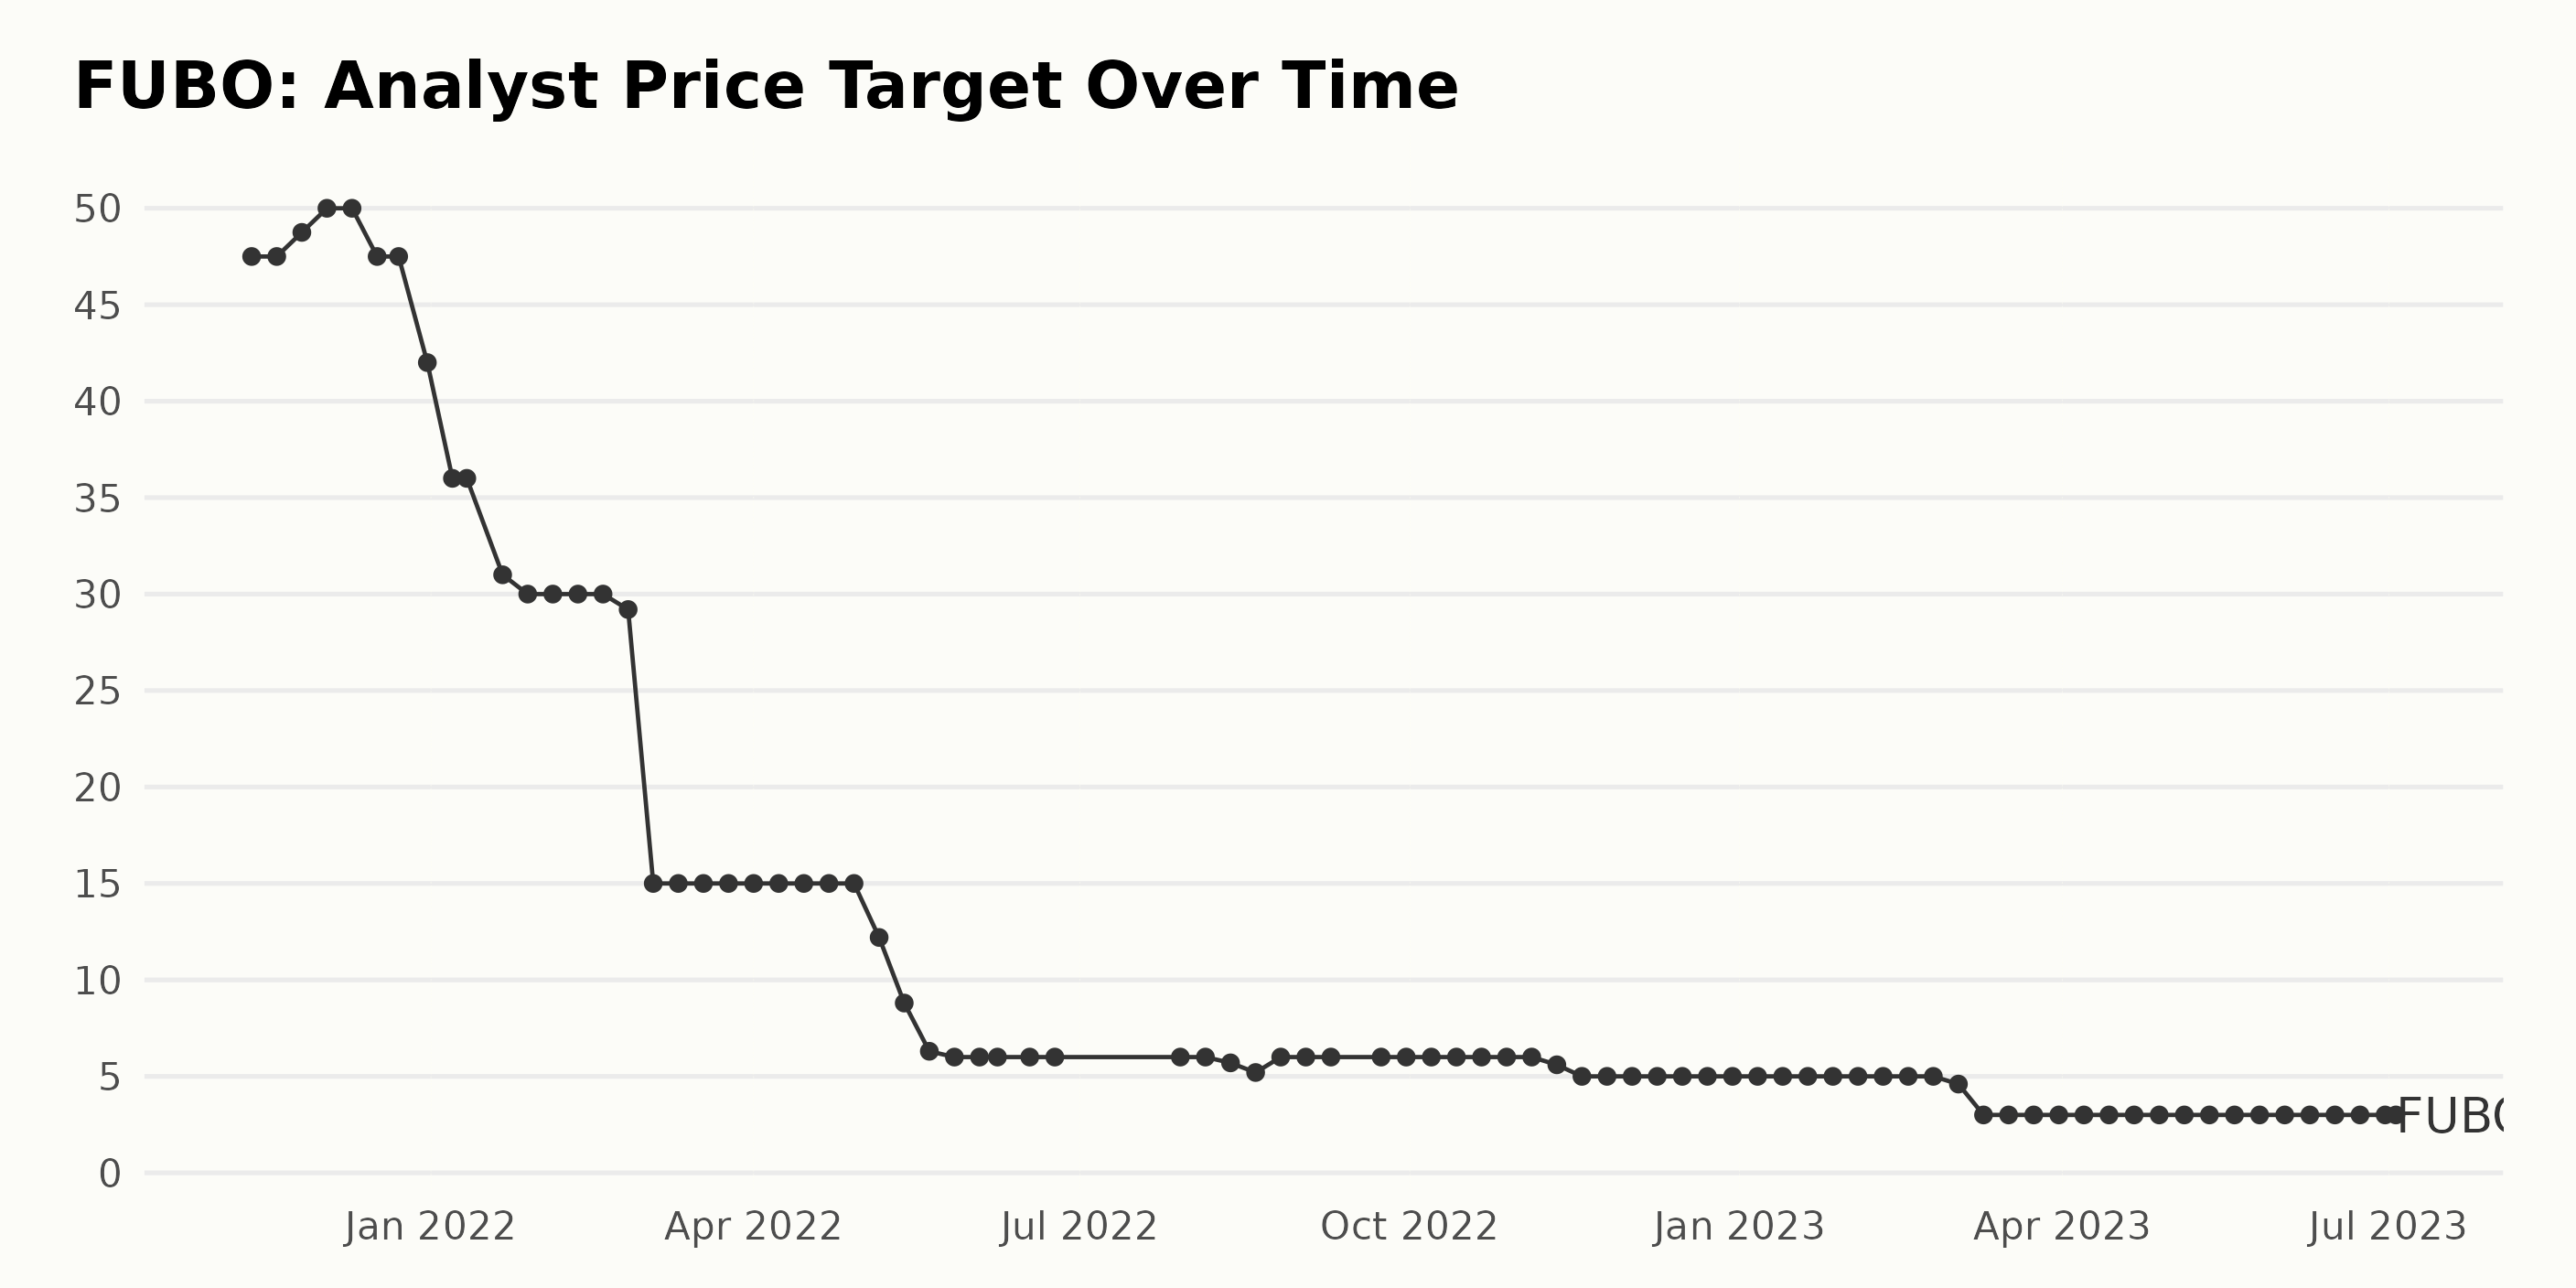
The analyst price target for FUBO has witnessed a noticeable decreasing trend from November 2021 to July 2023. The data fluctuates in a downward slope over the period:
- In November 2021, the analyst price target started at $47.5.
- There was a short upward trend until December 2021, with the price peaking at $50.
- However, this did not last long as it dropped to $15 by March 2022, about a 68% decrease.
- This price was maintained fairly stable until May, when another significant drop occurred, bringing the value down to just $6.3, nearly a 58% decrease from its previous standing of $15.
- The value hovered around $6 until August 2022 and then fluctuated between $6 and $5 until the end of the year.
- In 2023, there's another substantial drop in the price target, which steadily decreased from $5 in February to $3 by March and has remained consistently at $3 till July.
Overall, the significant downward trend indicates that the prospects for FUBO, according to these analysts, have been becoming increasingly pessimistic. The decrease in value from the first ($47.5) to the last ($3) presents a staggering approximated overall decrease of 93.6% over the period in focus.
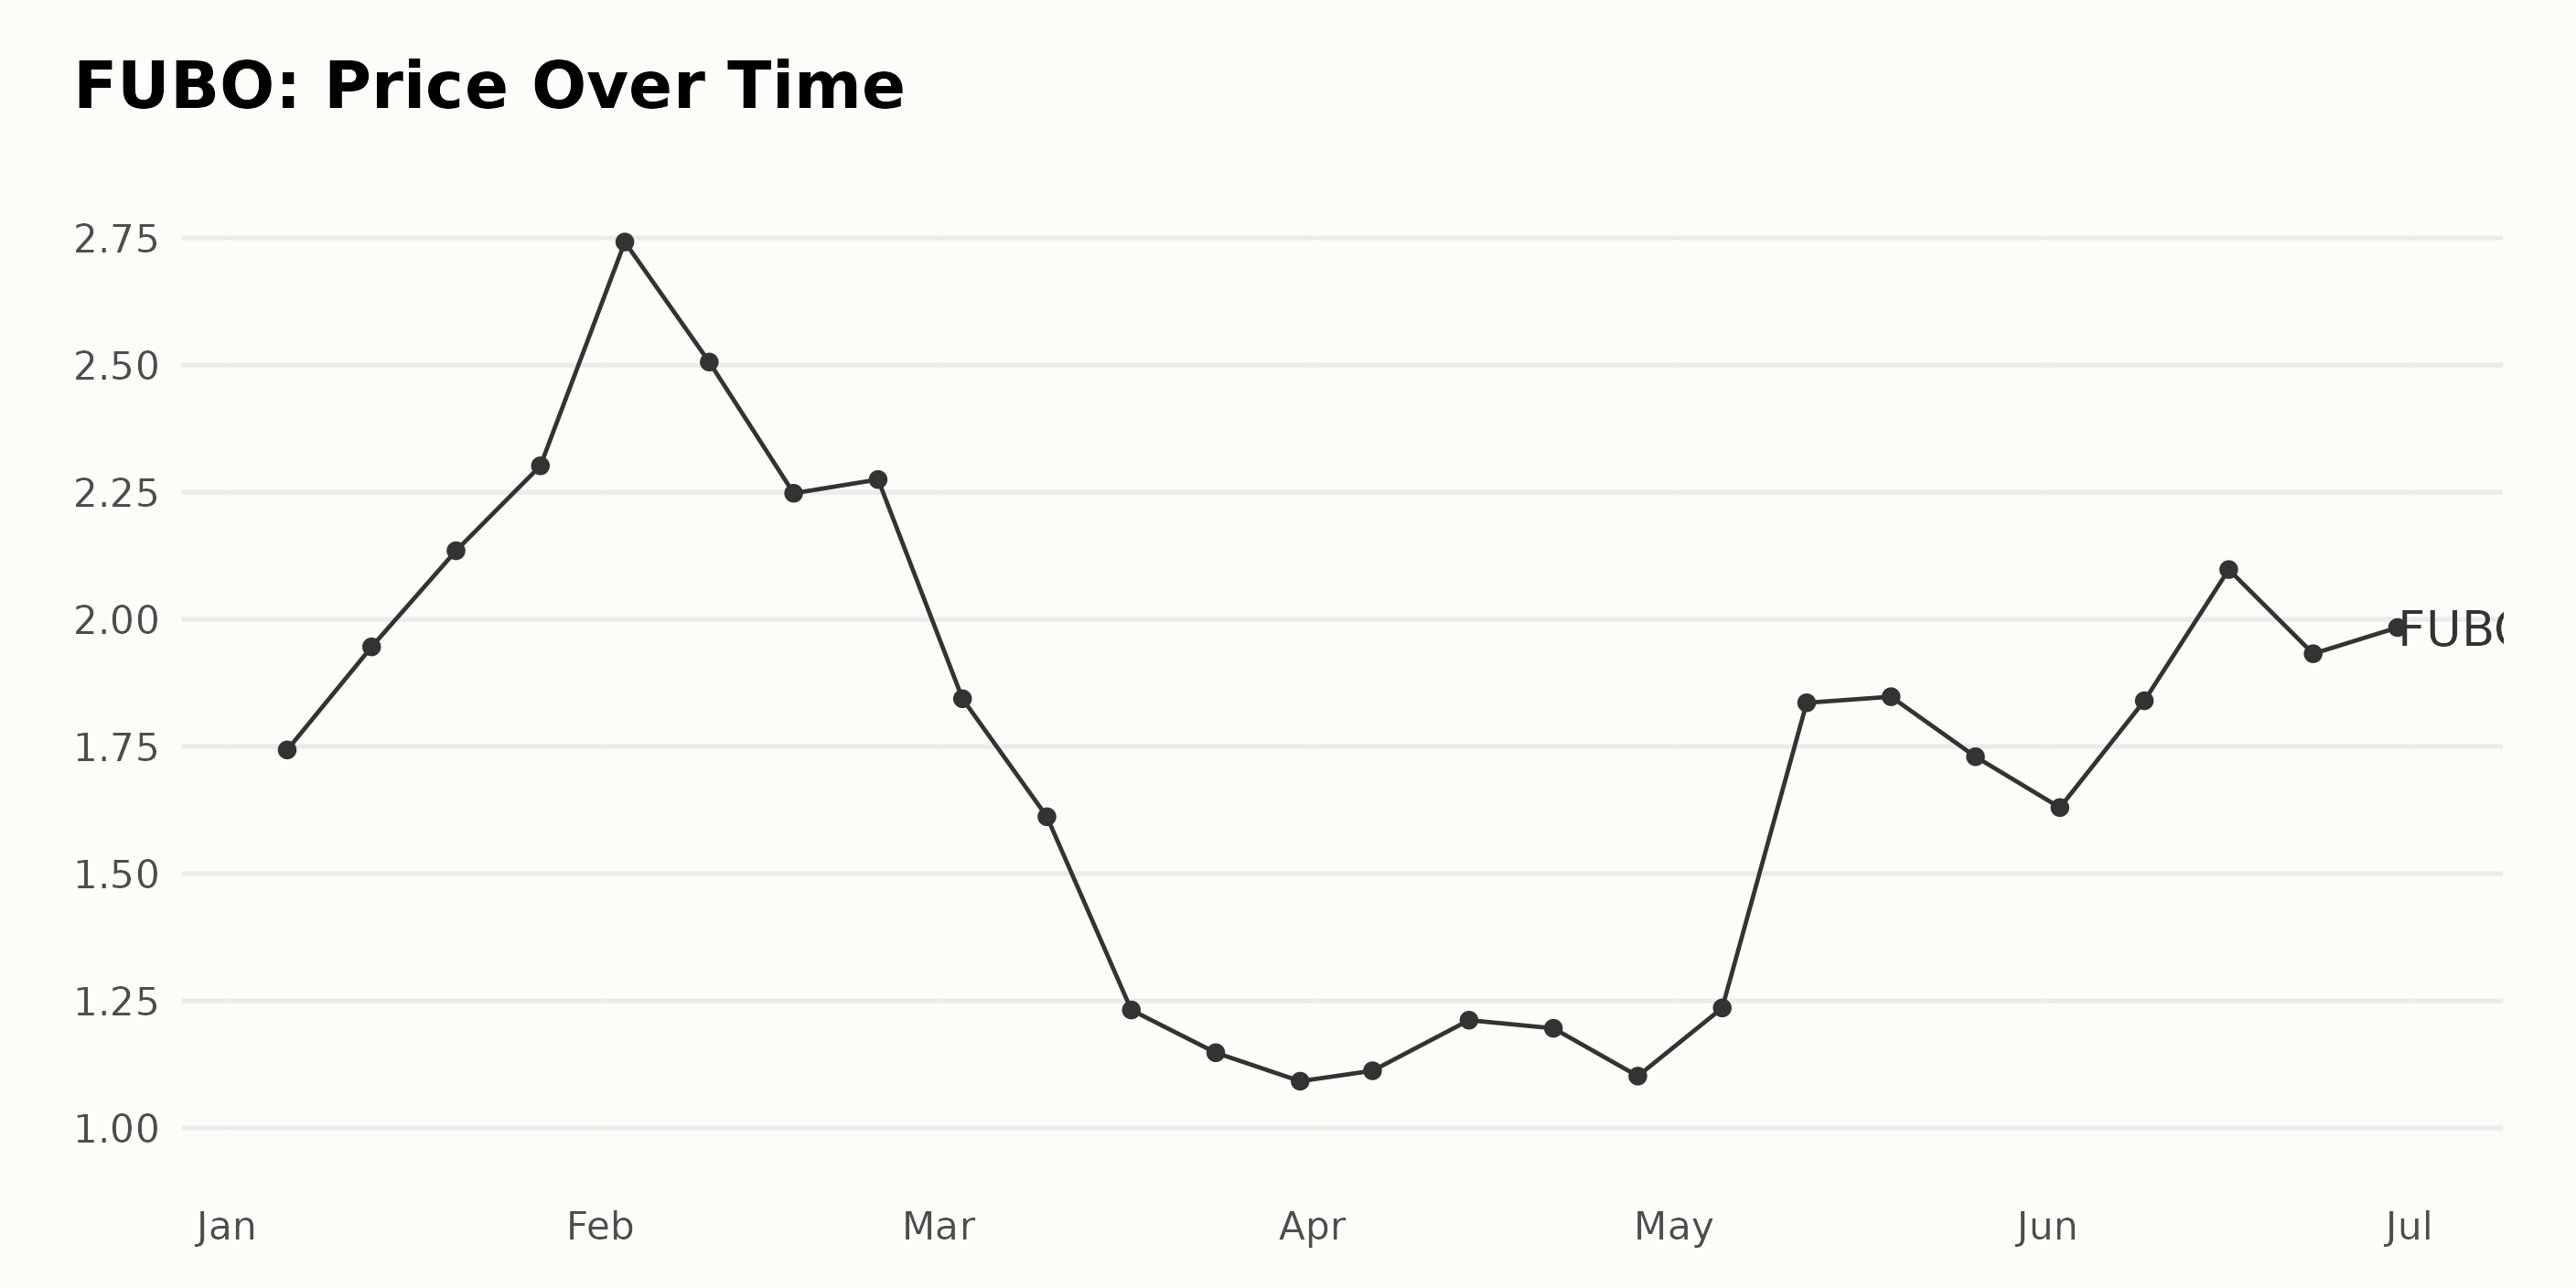
Analyzing FUBO's Volatile Share Price Trends: A Six-Month Snapshot (January-June 2023)
The overall trend during this time frame seems quite volatile, with FUBO shares experiencing both periods of growth and decline. As such, while there are clear instances of growth, such as in mid-January to early February and mid-May to mid-June, the growth appears to be relatively short-lived, quickly followed by periods of price dropping. Here is a chart of FUBO's price over the past 180 days.
Analyzing Key POWR Ratings for FUBO: Growth, Value, and Momentum Trends
Based on the provided data, we can discuss the POWR Ratings grade for FUBO. The stock is a part of the D-rated Entertainment - Sports & Theme Parks industry, which is a relatively small collection of only 14 stocks. Key information includes:
- Starting the year in January 2023, FUBO consistently received an F (Strong Sell) grade until mid-February, when it first achieved a D (Sell) grade.
- Despite being in a group of 14 stocks, FUBO was often ranked last within its category during this early period.
- After February 18, 2023, its POWR grade fluctuated between an F (Strong Sell) and a D (Sell).
- The rank gradually improved from #14 to #12 between late February and mid-April 2023.
- Despite the initial improvement, the rank dropped again to #13 later in April 2023 before rising to position #10 by May 20, 2023.
- From the week of May 20, 2023, to the week of June 3, 2023, FUBO had its best category rank at #10, accompanied by an overall D (Sell) grade.
- However, starting from the week of June 10, 2023, the rank started increasing, ending up at position #12 at the beginning of July 2023.
- As of July 3, the stock has an overall D (Sell) rating and is ranked #12 in the industry.
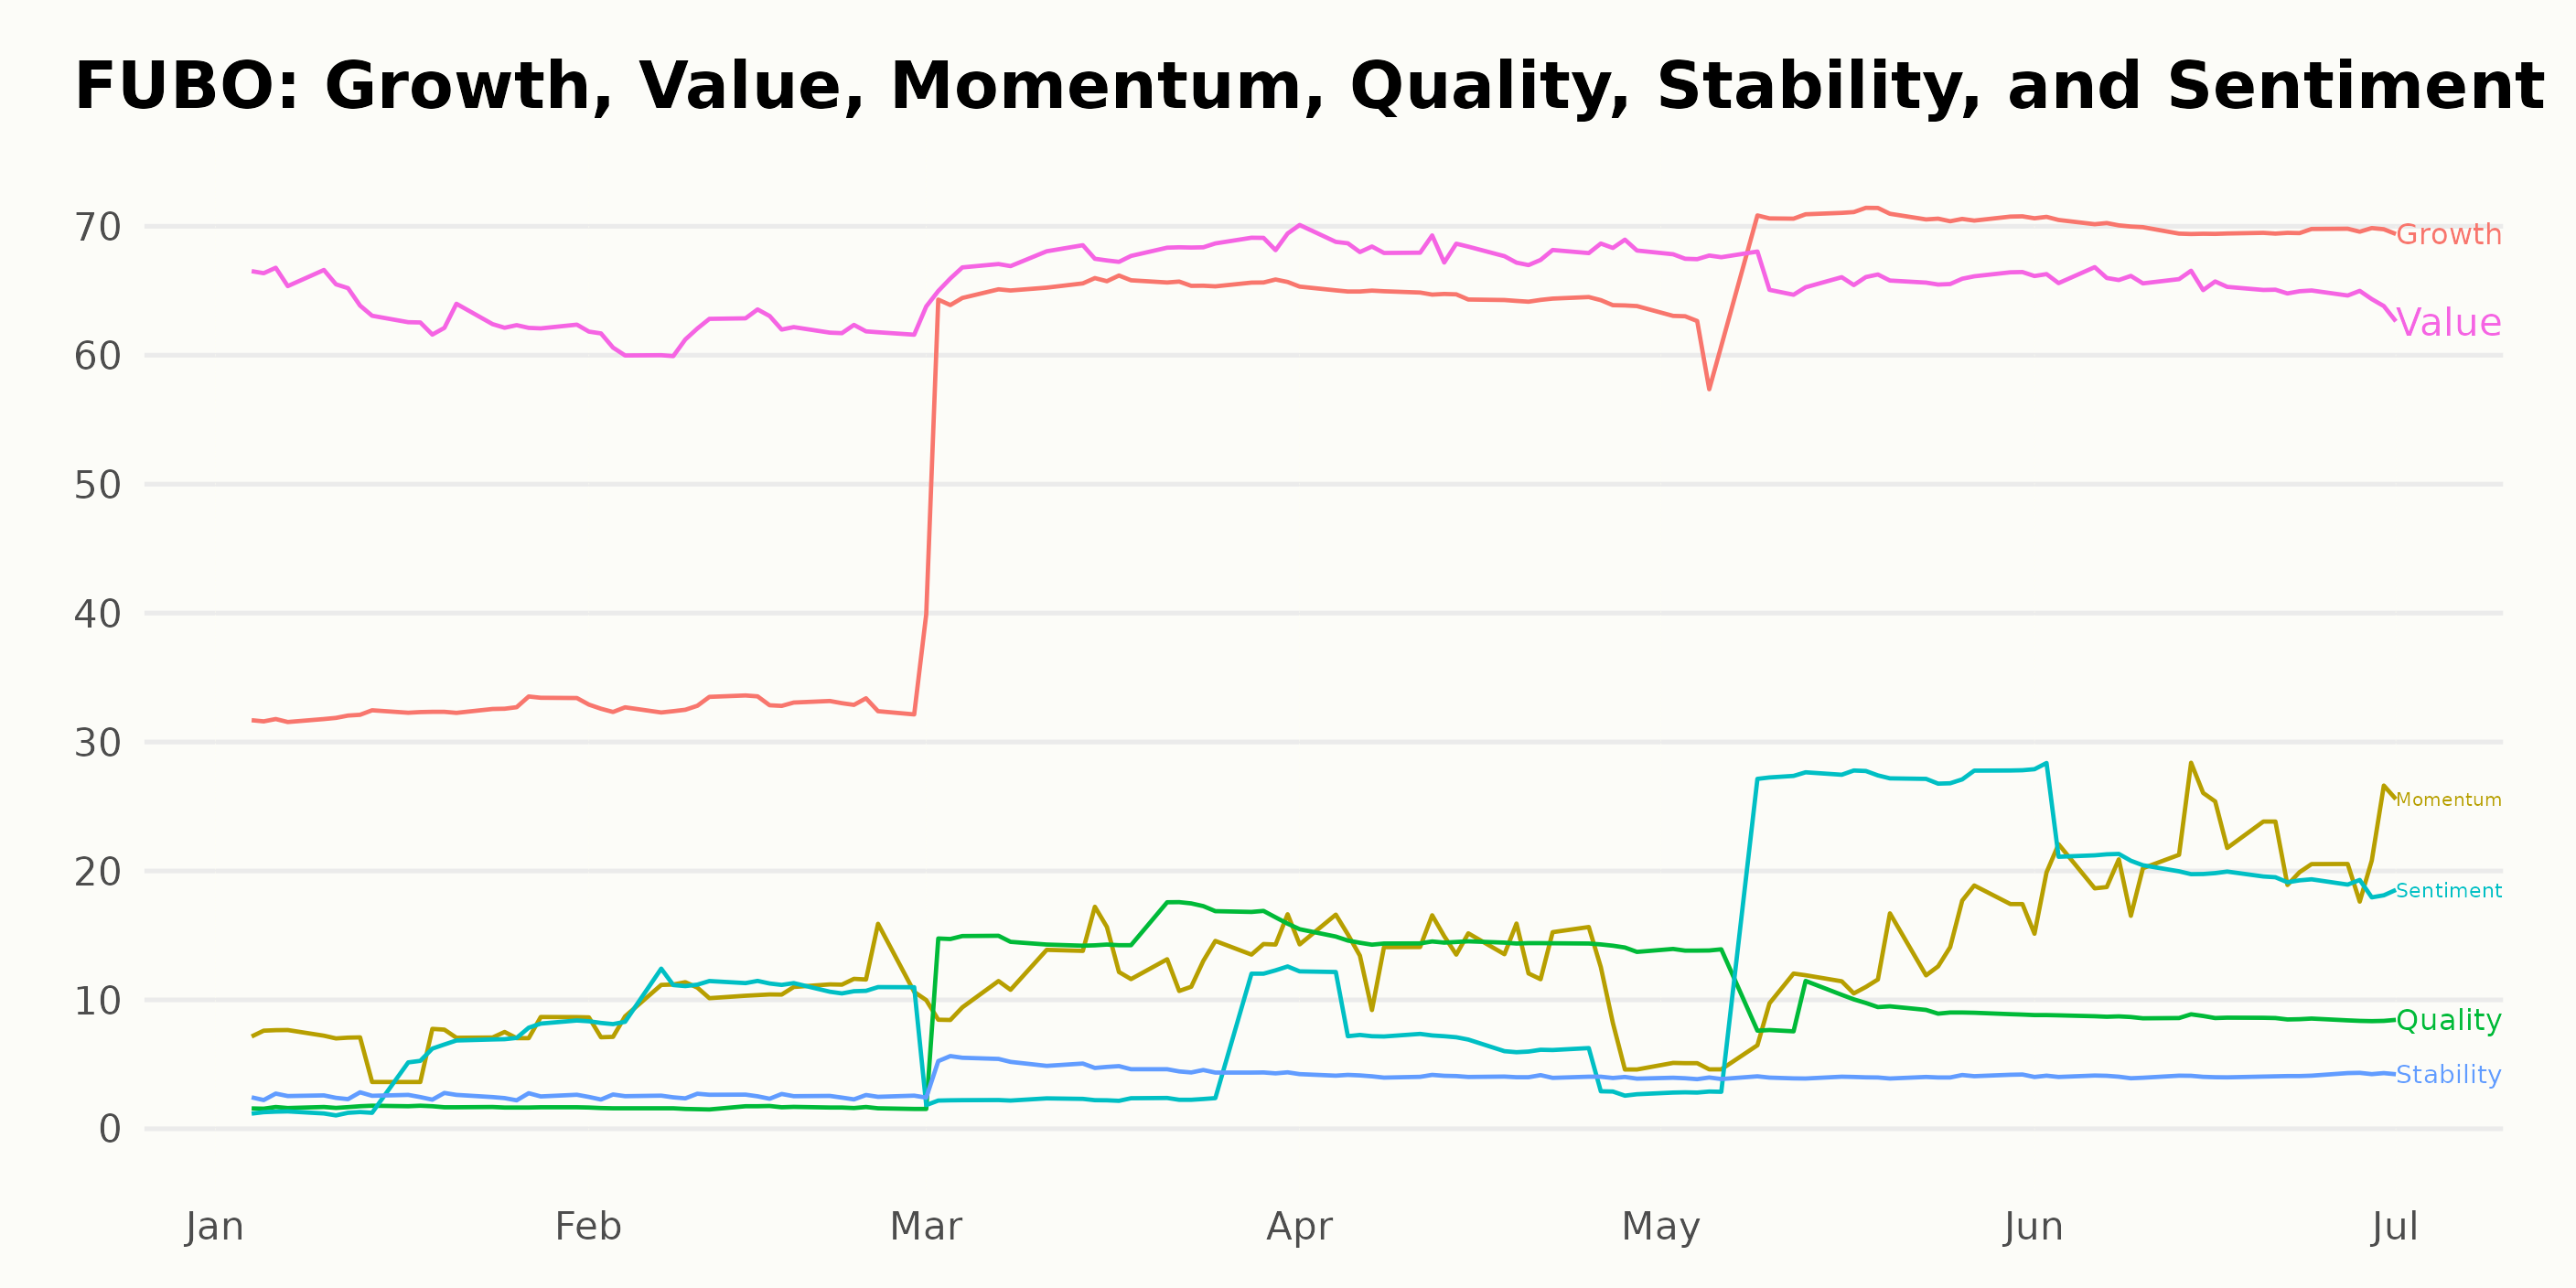
Based on the provided data, the three most noteworthy POWR Ratings dimensions for FUBO are Growth, Value, and Momentum. These dimensions offer the highest ratings and present clear trends.
Growth:
- Starting with a rating value of 32 in January 2023, FUBO's Growth dimension climbed steadily to peak at 70 in June 2023, after which it slightly dropped to 69 in July 2023.
Value:
- Value began as the highest-ranking dimension, scoring 64 in January 2023. It gradually escalated to 68 in March and April 2023 before declining slightly to 63 by July 2023.
Momentum:
- Momentum started from a modest 7 in January 2023 and experienced an upward trend throughout the period. This dimension increased incrementally each month, soaring to a score of 26 in July 2023.
This trend-based analysis suggests that FUBO's Growth and Momentum are continuously improving, indicating increased business expansion and dynamic progress. Despite minor fluctuations, the overall high scores in the Value category imply that FUBO is a worthy investment based on intrinsic worth compared to market price.
How does fuboTV Inc. (FUBO) Stack Up Against its Peers?
Other stocks in the Entertainment - Sports & Theme Parks sector that may be worth considering are Endeavor Group Holdings, Inc. (EDR), Emerald Holding, Inc. (EEX), and Cedar Fair, L.P. (FUN) - they have better POWR Ratings.
What To Do Next?
Get your hands on this special report with 3 low priced companies with tremendous upside potential even in today’s volatile markets:
3 Stocks to DOUBLE This Year >
FUBO shares were trading at $2.23 per share on Monday afternoon, up $0.15 (+7.21%). Year-to-date, FUBO has gained 28.16%, versus a 16.94% rise in the benchmark S&P 500 index during the same period.
About the Author: Anushka Dutta

Anushka is an analyst whose interest in understanding the impact of broader economic changes on financial markets motivated her to pursue a career in investment research.
The post Do Investors Want to Buy fuboTV (FUBO)? appeared first on StockNews.com