
Diversified science and technology company Danaher (NYSE: DHR) reported Q2 CY2026 results exceeding the market’s revenue expectations, with sales up 5.5% year on year to $6.27 billion. Its non-GAAP profit of $1.94 per share was 4.9% above analysts’ consensus estimates.
Is now the time to buy Danaher? Find out by accessing our full research report, it’s free.
Danaher (DHR) Q2 CY2026 Highlights:
- Revenue: $6.27 billion vs analyst estimates of $6.1 billion (5.5% year-on-year growth, 2.7% beat)
- Adjusted EPS: $1.94 vs analyst estimates of $1.85 (4.9% beat)
- Management slightly raised its full-year Adjusted EPS guidance to $8.52 at the midpoint
- Operating Margin: 18%, up from 12.8% in the same quarter last year
- Free Cash Flow Margin: 20.2%, up from 18.4% in the same quarter last year
- Organic Revenue rose 3% year on year (beat)
- Market Capitalization: $142.3 billion
Company Overview
Born from a real estate investment trust that transformed into a manufacturing powerhouse, Danaher (NYSE: DHR) is a global science and technology company that provides specialized equipment, software, and services for biotechnology, life sciences, and diagnostics.
Revenue Growth
Examining a company’s long-term performance can provide clues about its quality. Any business can experience short-term success, but top-performing ones enjoy sustained growth for years. Unfortunately, Danaher struggled to consistently increase demand as its $25.11 billion of sales for the trailing 12 months was close to its revenue five years ago. This was below our standards and suggests it’s a lower quality business.
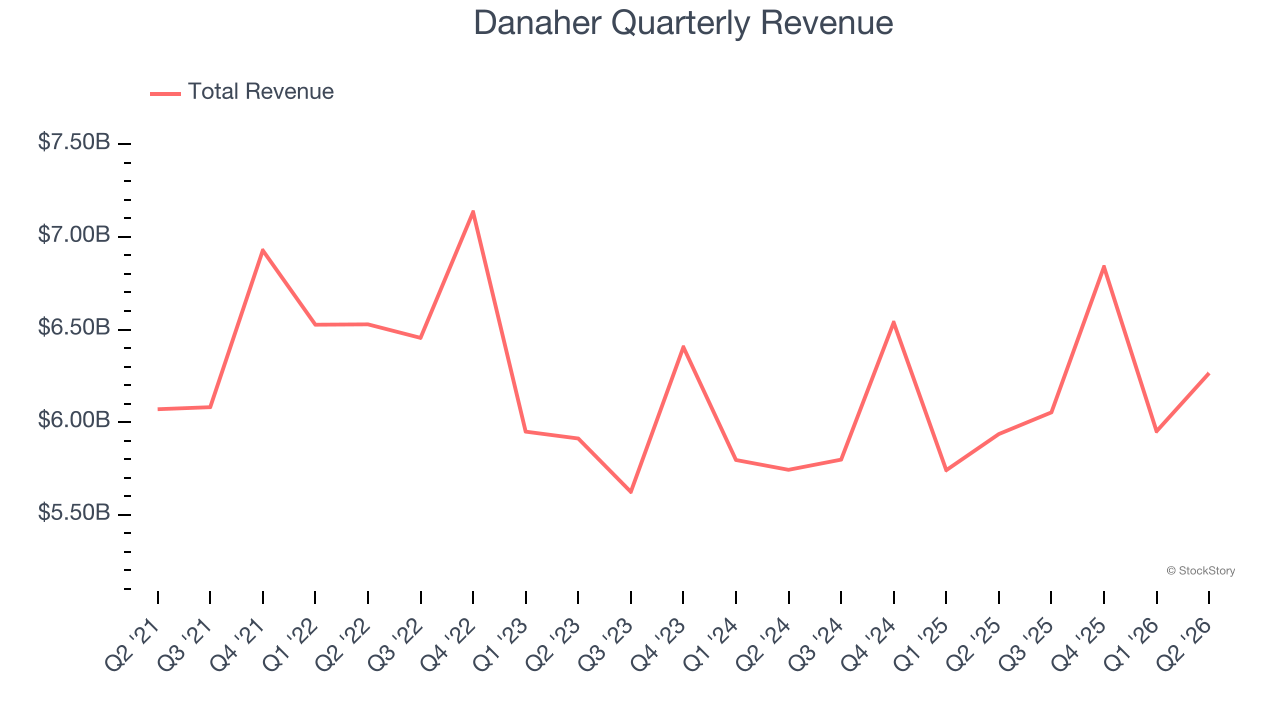
Long-term growth is the most important, but within healthcare, a half-decade historical view may miss new innovations or demand cycles. Danaher’s annualized revenue growth of 3.2% over the last two years is above its five-year trend, which is encouraging. 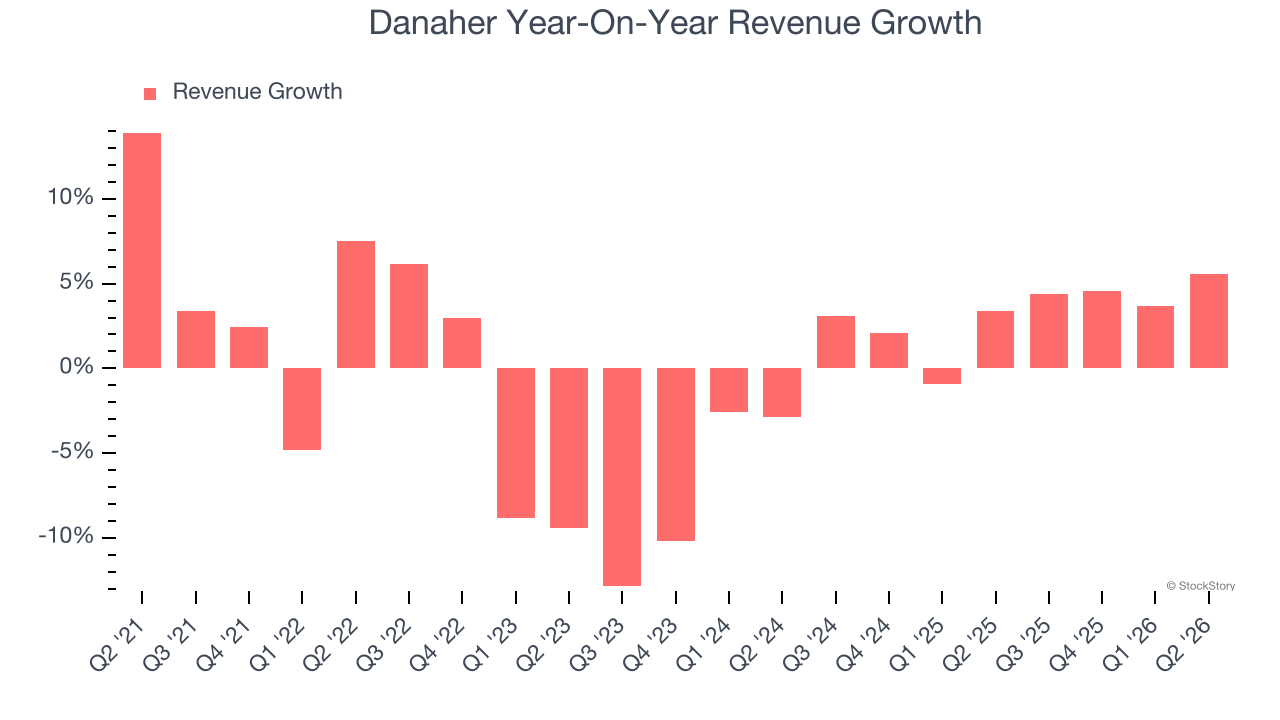
We can dig further into the company’s sales dynamics by analyzing its organic revenue, which strips out one-time events like acquisitions and currency fluctuations that don’t accurately reflect its fundamentals. Over the last two years, Danaher’s organic revenue averaged 1.9% year-on-year growth. Because this number aligns with its two-year revenue growth, we can see the company’s core operations (not acquisitions and divestitures) drove most of its results. 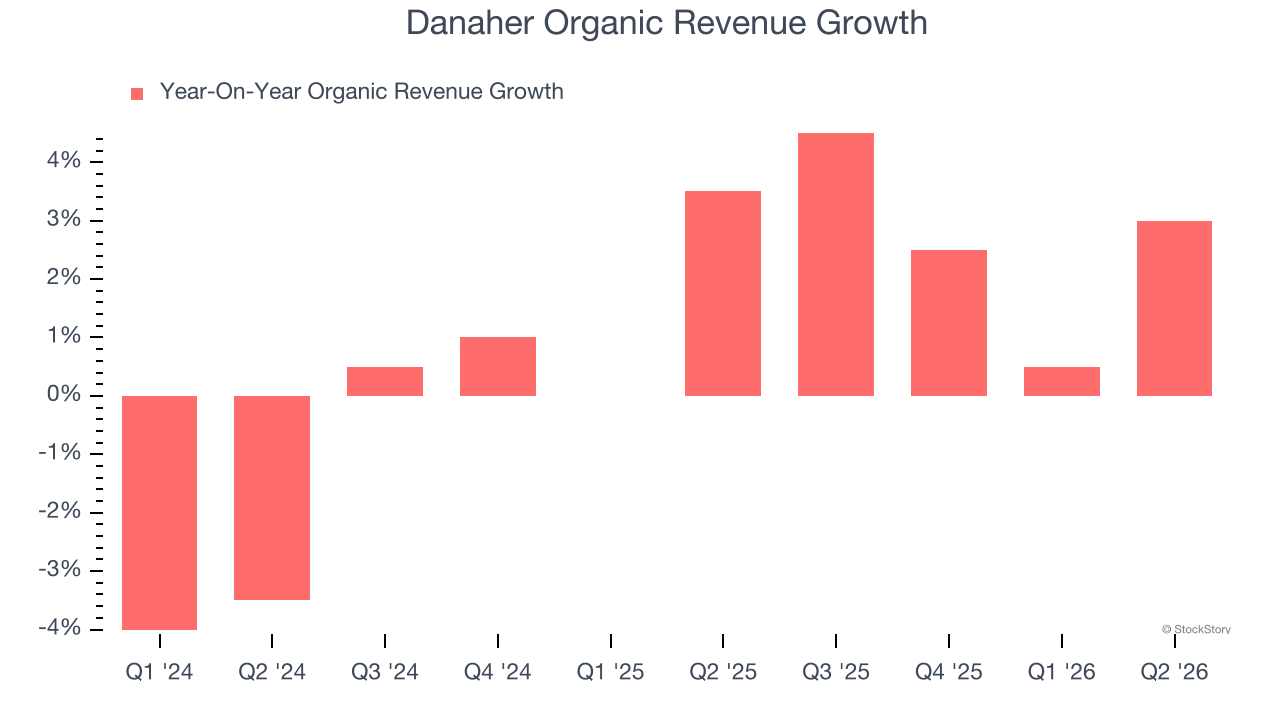
This quarter, Danaher reported year-on-year revenue growth of 5.5%, and its $6.27 billion of revenue exceeded Wall Street’s estimates by 2.7%.
Looking ahead, sell-side analysts expect revenue to grow 5.1% over the next 12 months, an improvement versus the last two years. This projection is above average for the sector and indicates its newer products and services will fuel better top-line performance.
WHILE YOU’RE HERE: The Next Palantir? One satellite company captures images of every point on Earth. Every single day. The Pentagon wants it. Hedge funds are using it to beat earnings. You’ve probably never heard of it.
This is what the early days of Palantir looked like before it became a giant. Same playbook. Different technology. If you missed Palantir, you need to see this. Claim The Stock Ticker for Free HERE.
Adjusted Operating Margin
Danaher has been a well-oiled machine over the last five years. It demonstrated elite profitability for a healthcare business, boasting an average adjusted operating margin of 30.1%.
Looking at the trend in its profitability, Danaher’s adjusted operating margin decreased by 10.1 percentage points over the last five years. The company’s two-year trajectory also shows it failed to get its profitability back to the peak as its margin fell by 2.4 percentage points. This performance was poor no matter how you look at it - it shows its expenses were rising and it couldn’t pass those costs onto its customers.
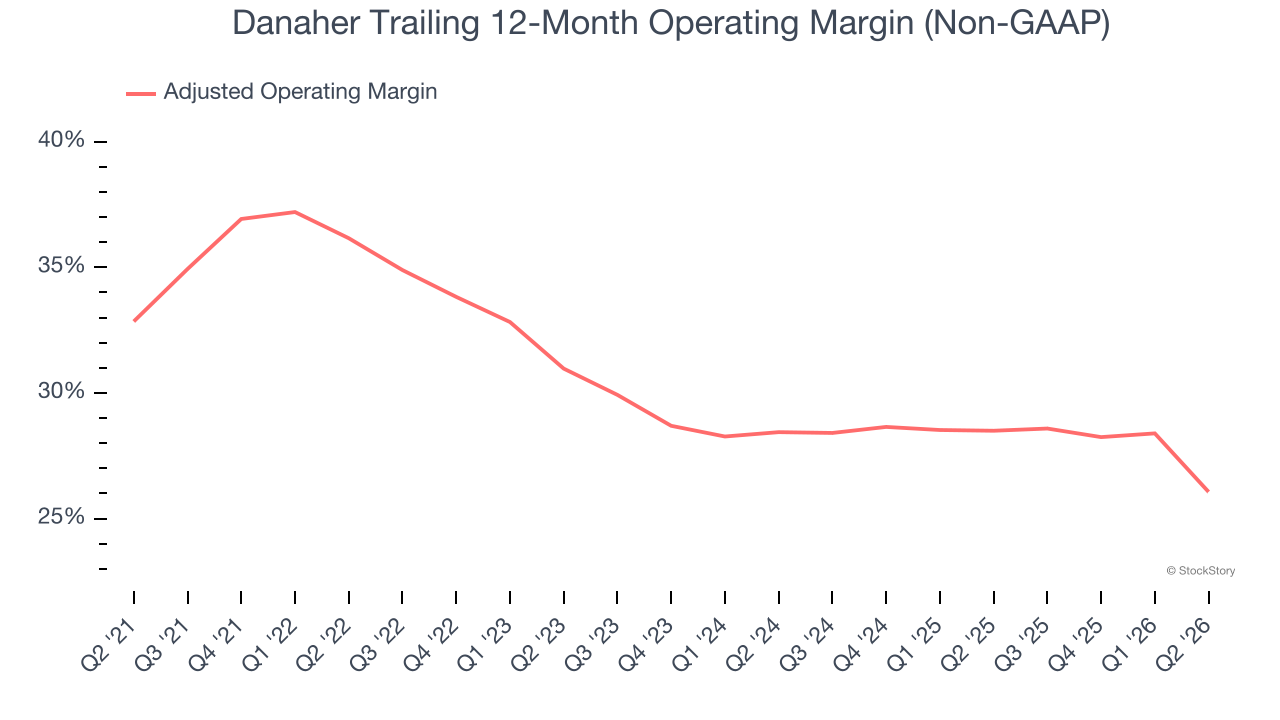
In Q2, Danaher generated an adjusted operating margin profit margin of 18%, down 9.3 percentage points year on year. This contraction shows it was less efficient because its expenses grew faster than its revenue.
Earnings Per Share
Revenue trends explain a company’s historical growth, but the long-term change in earnings per share (EPS) points to the profitability of that growth — for example, a company could inflate its sales through excessive spending on advertising and promotions.
Sadly for Danaher, its EPS declined by 1.6% annually over the last five years. We tend to steer our readers away from companies with falling revenue and EPS, where diminishing earnings could imply changing secular trends and preferences.If the tide turns unexpectedly, Danaher’s low margin of safety could leave its stock price susceptible to large downswings.
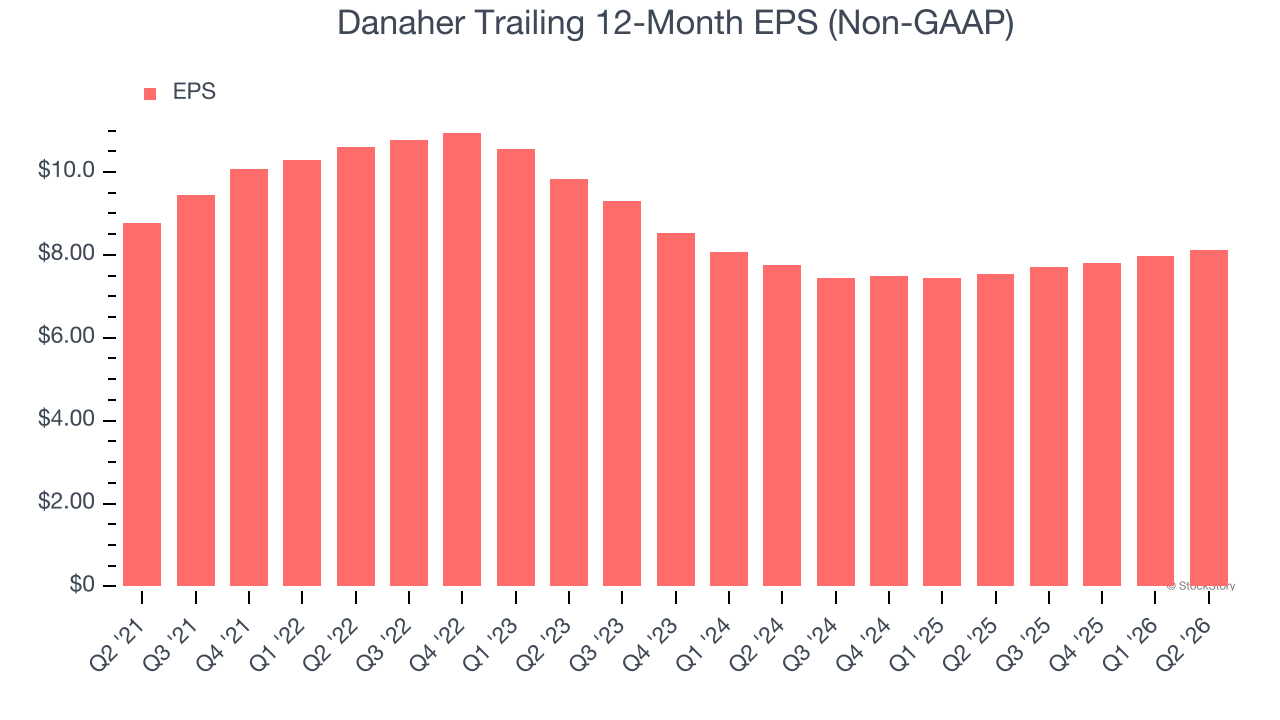
In Q2, Danaher reported adjusted EPS of $1.94, up from $1.80 in the same quarter last year. This print beat analysts’ estimates by 4.9%. Over the next 12 months, Wall Street expects Danaher’s full-year EPS to grow 9.1% from $8.12 to $8.86.
Key Takeaways from Danaher’s Q2 Results
We enjoyed seeing Danaher beat analysts’ revenue expectations this quarter. We were also happy its organic revenue narrowly outperformed Wall Street’s estimates. Overall, this print had some key positives. The market seemed to be hoping for more, and the stock traded down 9.8% to $181.82 immediately following the results.
So should you invest in Danaher right now? The latest quarter does matter, but not nearly as much as longer-term fundamentals and valuation, when deciding if the stock is a buy. We cover that in our actionable full research report which you can read here (it’s free).