Aerospace and defense company Cadre (NYSE: CDRE) reported Q3 2026 results exceeding the market’s revenue expectations, with revenue up 30.2% year on year to $202.9 million. The company expects the full year’s revenue to be around $762.5 million, close to analysts’ consensus estimates. Its GAAP profit of $0.37 per share was 38.6% above analysts’ consensus estimates.
For more on Cadre, read our free full research report.
Cadre (CDRE) Q3 2026 highlights:
- Revenue $202.9 million vs S&P analysts’ consensus estimates of $190.8 million (30.2% year-on-year growth, 6.4% beat)
- EPS (GAAP) $0.37 vs analysts’ consensus estimates of $0.27 (38.6% beat)
- Adjusted EBITDA $41.1 million vs analysts’ consensus estimates of $34.17 million (20.3% margin, 20.3% beat)
- Revenue guidance The company slightly lifted its revenue guidance for the full year to $762.5 million at the midpoint from $759 million
- EBITDA guidance $142 million at the midpoint for the full year, above analysts’ consensus estimates of $140.6 million
- Operating margin 14%, up from 12% in the same quarter last year
- Free cash flow margin 9.8%, down from 13.9% in the same quarter last year
- Market capitalization $1.33 billion
"Our third-quarter results reflect strong execution across Cadre’s businesses, with double-digit organic growth and contributions from acquisitions driving a 30% increase in sales,” said Warren Kanders, CEO and Chairman. “Net income increased 46% and Adjusted EBITDA margin expanded 110 basis points to 20.2%. We remain focused on driving further operating-margin improvement through the Cadre Operating Model, with an emphasis on manufacturing productivity, sourcing and pricing discipline, and overhead efficiency. Our AI initiatives will complement these efforts by targeting repetitive workflows, improving decision-making and enabling our teams to scale more efficiently.”
Revenue growth
Reviewing a company’s long-term revenue performance reveals insights into its quality. Even a poor business can perform well for one or two quarters, but a top-tier one grows for years. Cadre’s revenue grew at an impressive 11.2% compounded annual growth rate over the last five years. Its growth beat the average industrials company and shows its offerings resonate with customers.
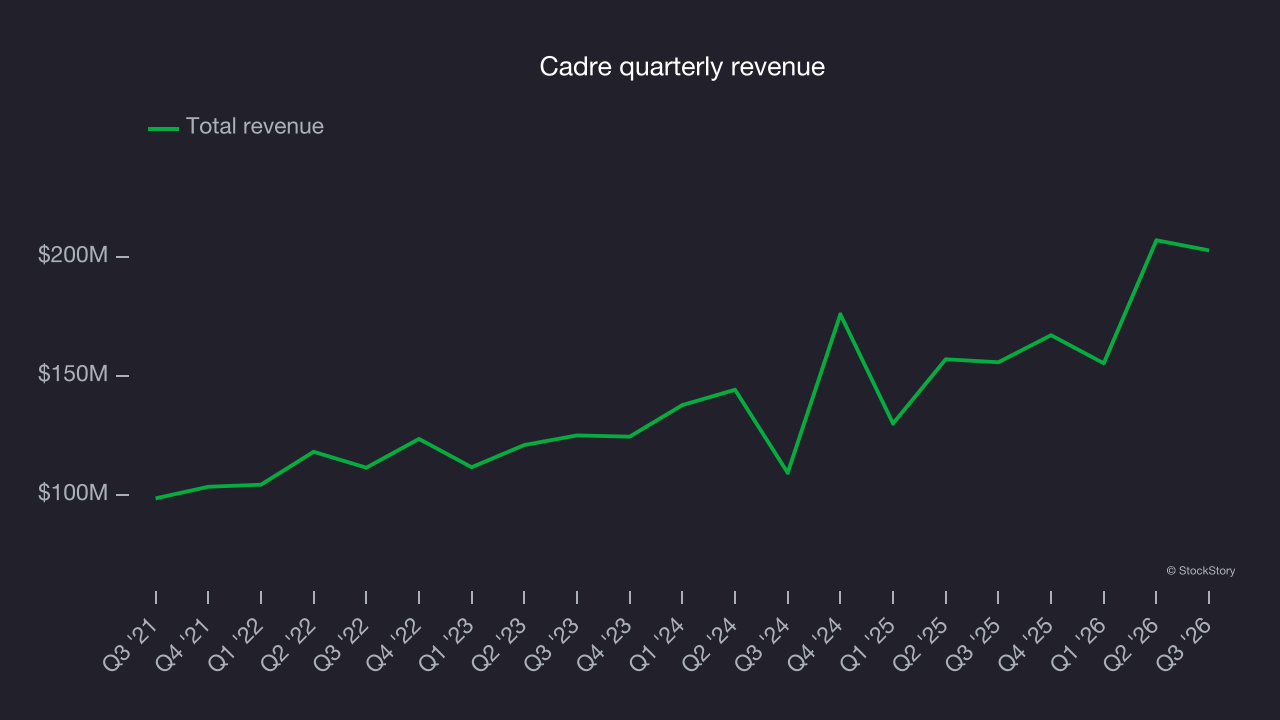
Long-term growth is the most important, but within industrials, a half-decade historical view may miss new industry trends or demand cycles. Cadre’s annualized revenue growth of 19.1% over the last two years is above its five-year trend, suggesting its demand was strong and recently accelerated. 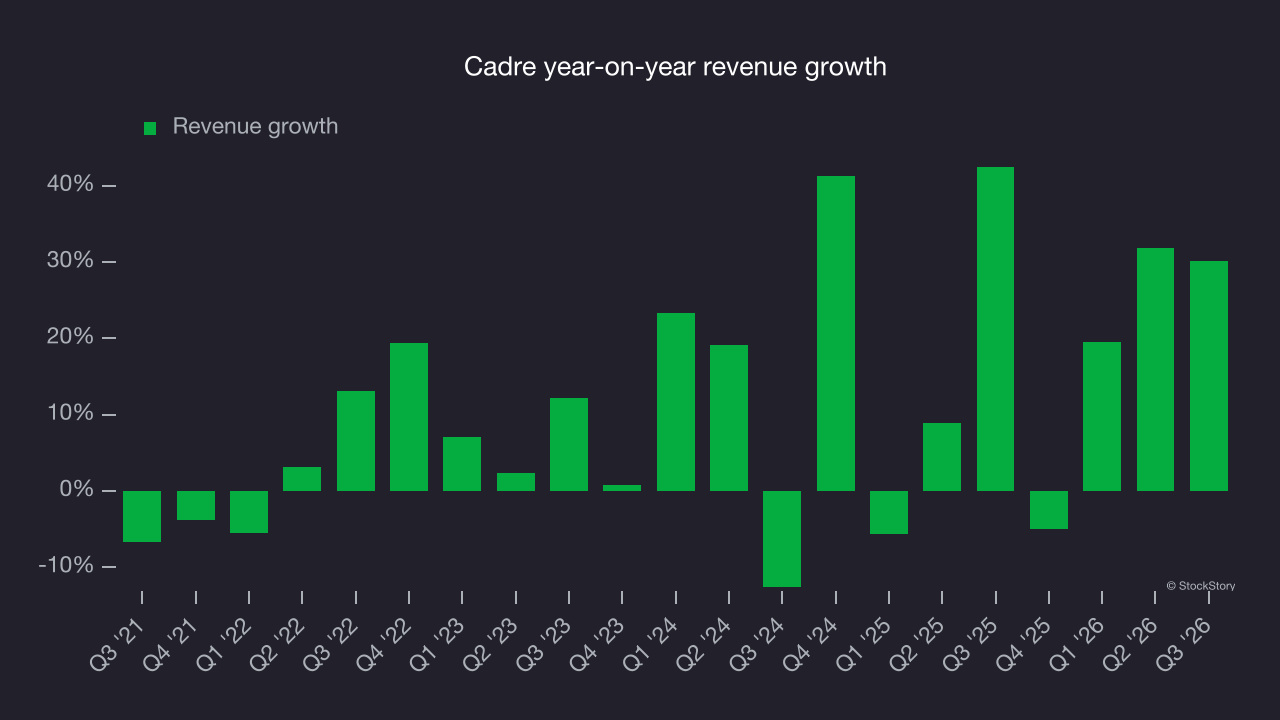
A closer look at the company’s most important segment, Products, sheds light on its revenue dynamics. Over the last two years, Cadre’s Products revenue (body armor, corrections tools, sensors) averaged 23.6% year-on-year growth. This segment has outperformed its total revenue during the same period, lifting the company’s performance. 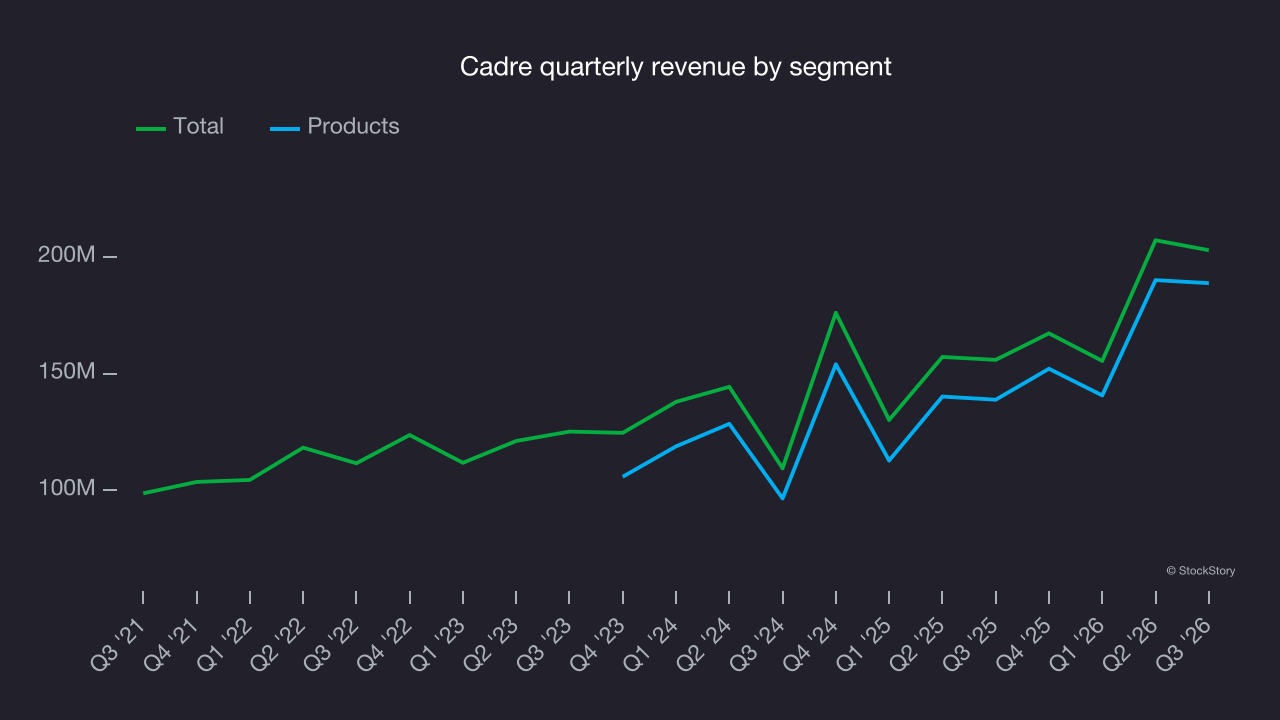
This quarter, Cadre reported strong year-on-year revenue growth of 30.2%, and its $202.9 million of revenue exceeded Wall Street’s consensus estimates by 6.4%.
Looking ahead, sell-side analysts expect revenue to grow 7.1% over the next 12 months, according to S&P, a deceleration versus the last two years. This underwhelming projection suggests its products and services will face some demand challenges. Still, the company is tracking well in other measures of financial health.
Operating margin
Operating margin is one of the best measures of profitability because it tells us how much money a company takes home after procuring and manufacturing its products, marketing and selling those products and, most importantly, keeping them relevant through research and development.
Cadre has done a decent job managing its cost base over the last five years. The company has produced an average operating margin of 9.9%, higher than the broader industrials sector.
Analyzing the trend in its profitability, Cadre’s operating margin rose by 7.7 percentage points over the last five years, as its revenue growth provided operating leverage.
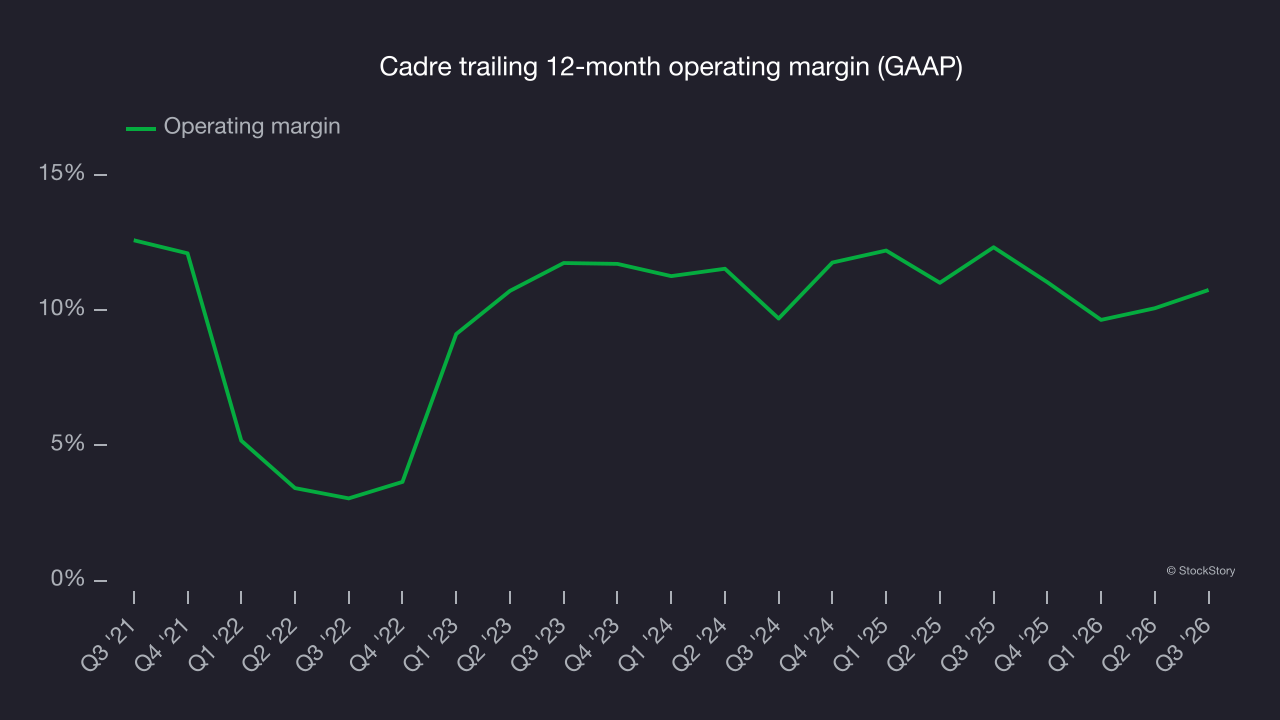
In Q3, Cadre generated an operating margin of 14%, up 2 percentage points year on year. This increase was a positive development and showed improved efficiency.
Earnings per share
We track the long-term change in earnings per share, or EPS, for the same reason as long-term revenue growth. Compared to revenue, however, EPS highlights whether a company’s growth is profitable.
Cadre’s EPS grew at a 17.4% compounded annual growth rate over the last five years, higher than its 11.2% annualized revenue growth. This indicates the company became more profitable on a per-share basis as it expanded.
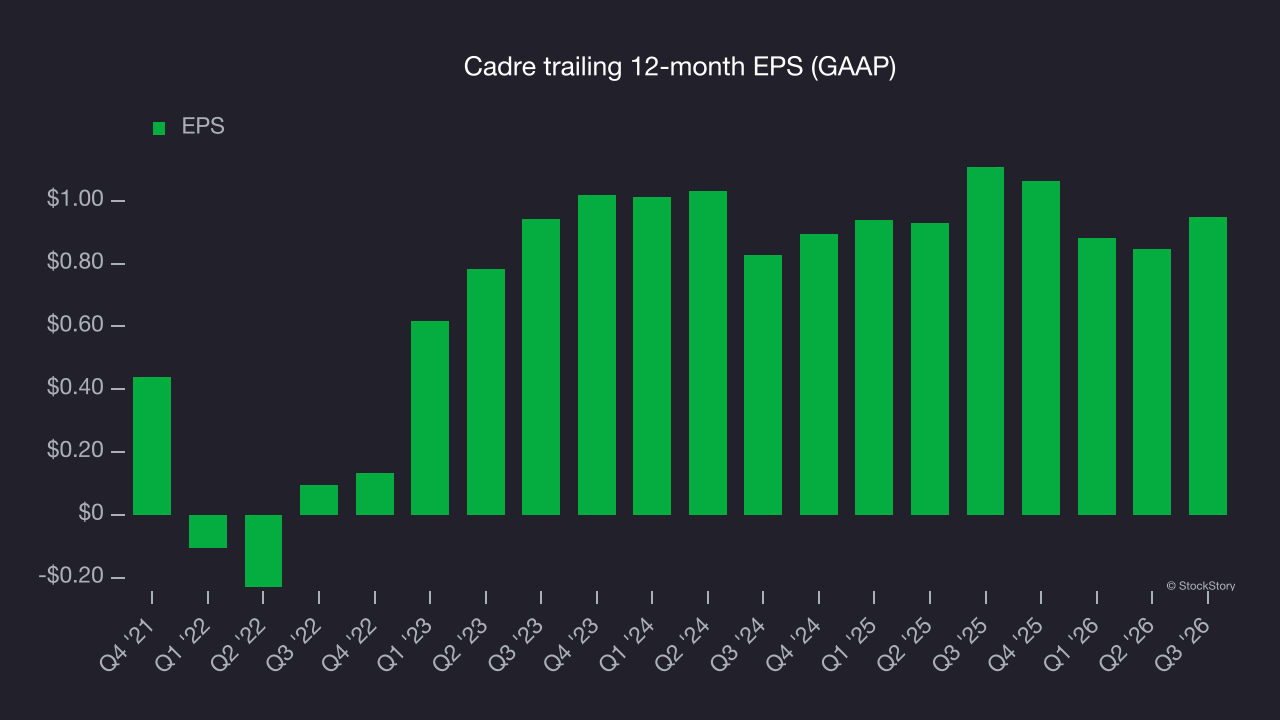
Diving into Cadre’s quality of earnings can give us a better understanding of its performance. As we mentioned earlier, Cadre’s operating margin expanded by 7.7 percentage points over the last five years. This was the most relevant factor (aside from the revenue impact) behind its higher earnings; interest expenses and taxes can also affect EPS but don’t tell us as much about a company’s fundamentals.
As with revenue, we analyze EPS over a more recent period because it can provide insight into an emerging theme or development for the business.
Cadre’s two-year annual EPS growth of 7.1% was lower than its five-year trend. That was underwhelming, but the company performed well on other measures of financial health.
In Q3, Cadre reported EPS of $0.37, up from $0.27 in the same quarter last year. The result comfortably beat analysts’ consensus estimates. Over the next 12 months, Wall Street expects Cadre’s full-year EPS to grow 53.1% from $0.95 to $1.45, according to S&P.
Key takeaways from Cadre’s Q3 results
Cadre delivered a solid Q3, with EBITDA beating Wall Street’s consensus estimates by a wide margin and EPS also topping analysts’ consensus expectations. Shares remained flat at $30.84 immediately after the results.
Investors considering Cadre should look at the bigger picture of valuation, business quality and the latest earnings. Read the full research report here (it’s free).