Measurement equipment distributor Transcat (NASDAQ: TRNS) reported calendar Q3 2026 (fiscal Q2 2027) results topping the market’s revenue expectations, with revenue up 18% year on year to $97.09 million. Its non-GAAP profit of $0.64 per share was 42.9% above analysts’ consensus estimates.
For more on Transcat, read the full research report for free.
Transcat (TRNS) Q3 CY2026 highlights:
- Revenue $97.09 million vs S&P analysts’ consensus estimates of $92.46 million (18% year-on-year growth, 5% beat)
- Adjusted EPS $0.64 vs S&P analysts’ consensus estimates of $0.45 (42.9% beat)
- Adjusted EBITDA $14.91 million vs analysts’ consensus estimates of $13.33 million (15.4% margin, 11.9% beat)
- Operating margin 5.2%, in line with the same quarter last year
- Free cash flow margin 6.2%, down from 10.3% in the same quarter last year
- Market capitalization $822.9 million
"Our fiscal second quarter results demonstrate strong execution across each pillar of our core strategy: driving strong Service organic revenue growth, expanding Service gross margins, executing strategic acquisitions, and growing Rentals consistently,” said Jaime Irick, President and CEO. “Fiscal second quarter 2027 marked our seventieth consecutive quarter of Service revenue growth. Strength in our Calibration business lifted Service revenue 23%, including 16% Service organic revenue* growth, and drove 220 bps of year over year Service gross margin expansion, up from 90 bps in the first quarter. Distribution revenue grew 10%, fueled by continued strength in Rentals and Product sales.
Revenue growth
A company’s long-term revenue performance can indicate its overall quality. Even a poor business can perform well for one or two quarters, but a top-tier one grows for years. Transcat’s 13.7% annualized revenue growth over the last five years was strong. Its growth beat the average industrials company and shows its offerings resonate with customers.
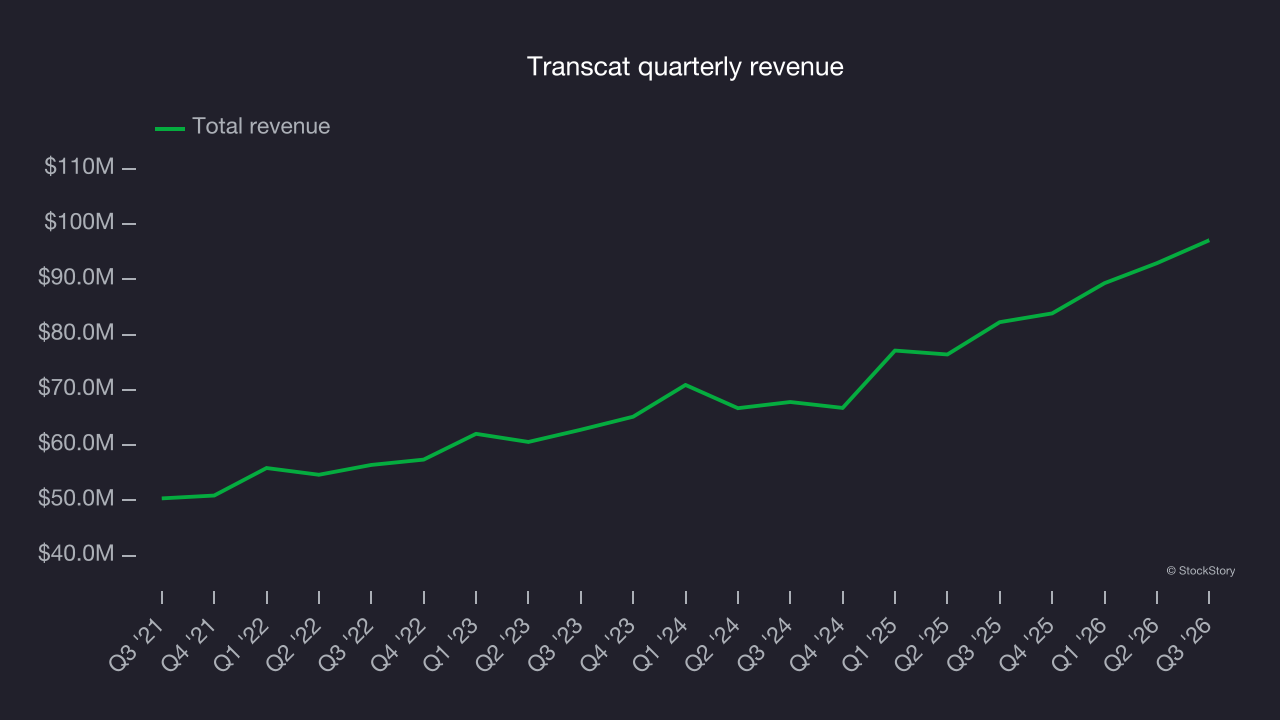
Long-term growth is the most important, but within industrials, a half-decade historical view may miss new industry trends or demand cycles. Transcat’s annualized revenue growth of 15.9% over the last two years is above its five-year trend, suggesting its demand was strong and recently accelerated. 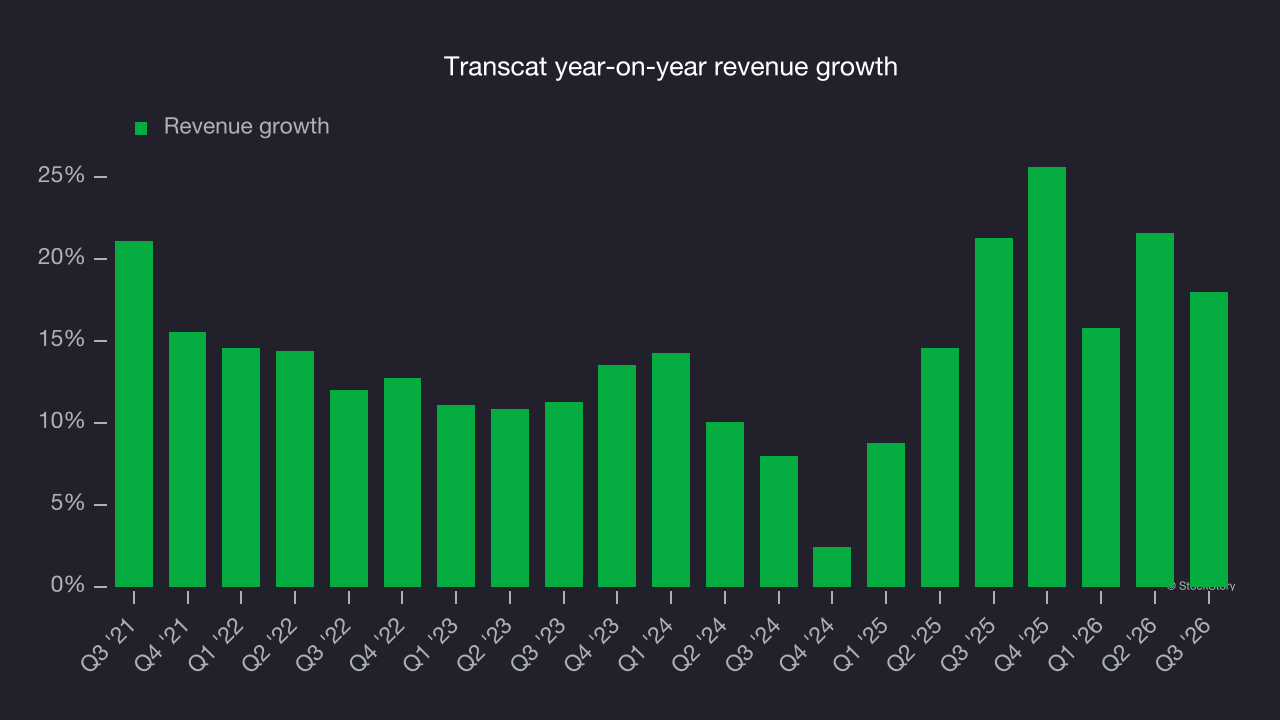
This quarter, Transcat reported year-on-year revenue growth of 18%, and its $97.09 million in revenue exceeded Wall Street’s consensus estimates by 5%.
Looking ahead, sell-side analysts expect revenue to grow 5% over the next 12 months, according to S&P, a deceleration versus the last two years. This projection is underwhelming and suggests its products and services will see some demand headwinds.
Operating margin
Operating margin is an important measure of profitability as it shows the portion of revenue left after accounting for all core expenses, from the cost of goods sold to advertising and wages. It’s also useful for comparing profitability across companies with different levels of debt and tax rates because it excludes interest and taxes.
Transcat was profitable over the last five years but held back by its large cost base. Its average operating margin of 6.2% was weak for an industrials business.
Looking at the trend in its profitability, Transcat’s operating margin decreased by 2.1 percentage points over the last five years. This raises questions about the company’s expense base because its revenue growth should have given it leverage on its fixed costs, resulting in better economies of scale and profitability. Transcat’s poor performance indicates that costs were rising and it couldn’t pass them on to its customers.
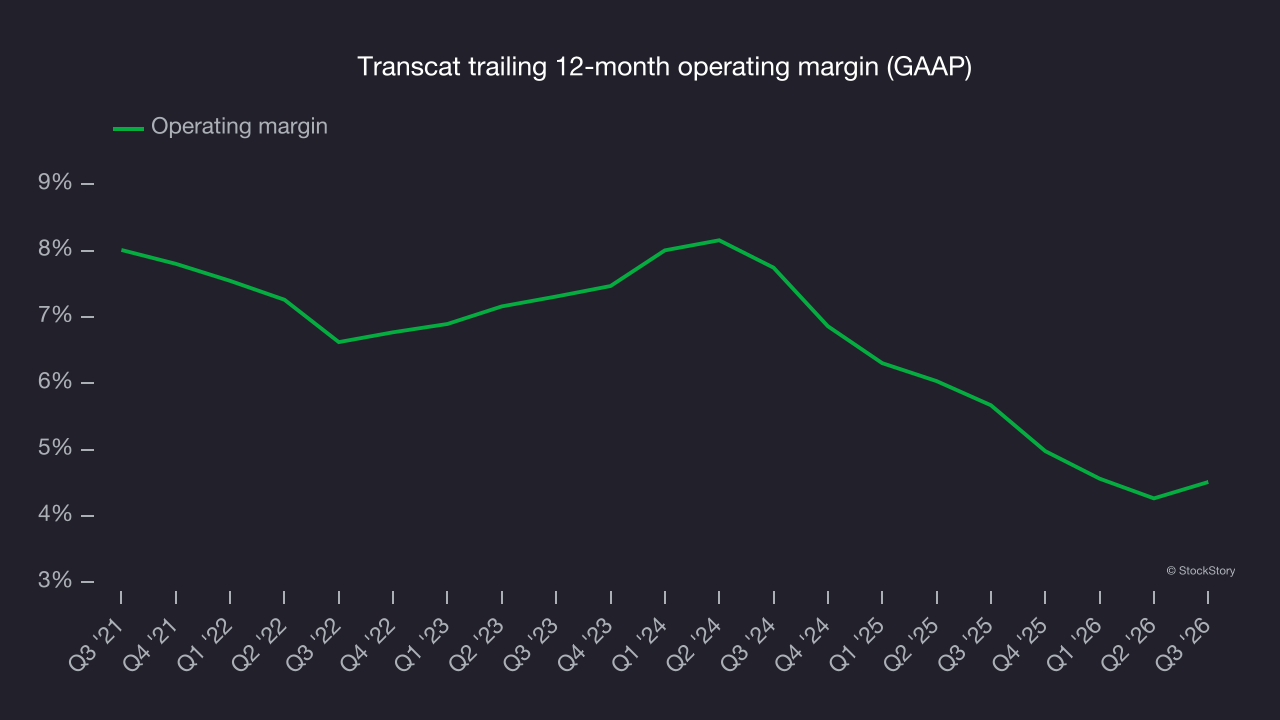
This quarter, Transcat generated an operating margin of 5.2%, in line with the same quarter last year. This indicates the company’s cost structure has recently been stable.
Earnings per share
Long-term changes in earnings per share, or EPS, matter for the same reason as long-term revenue growth. Compared to revenue, however, EPS highlights whether a company’s growth is profitable.
Transcat’s EPS grew at an unimpressive 4.5% compounded annual growth rate over the last five years, lower than its 13.7% annualized revenue growth. This tells us the company became less profitable on a per-share basis as it expanded.
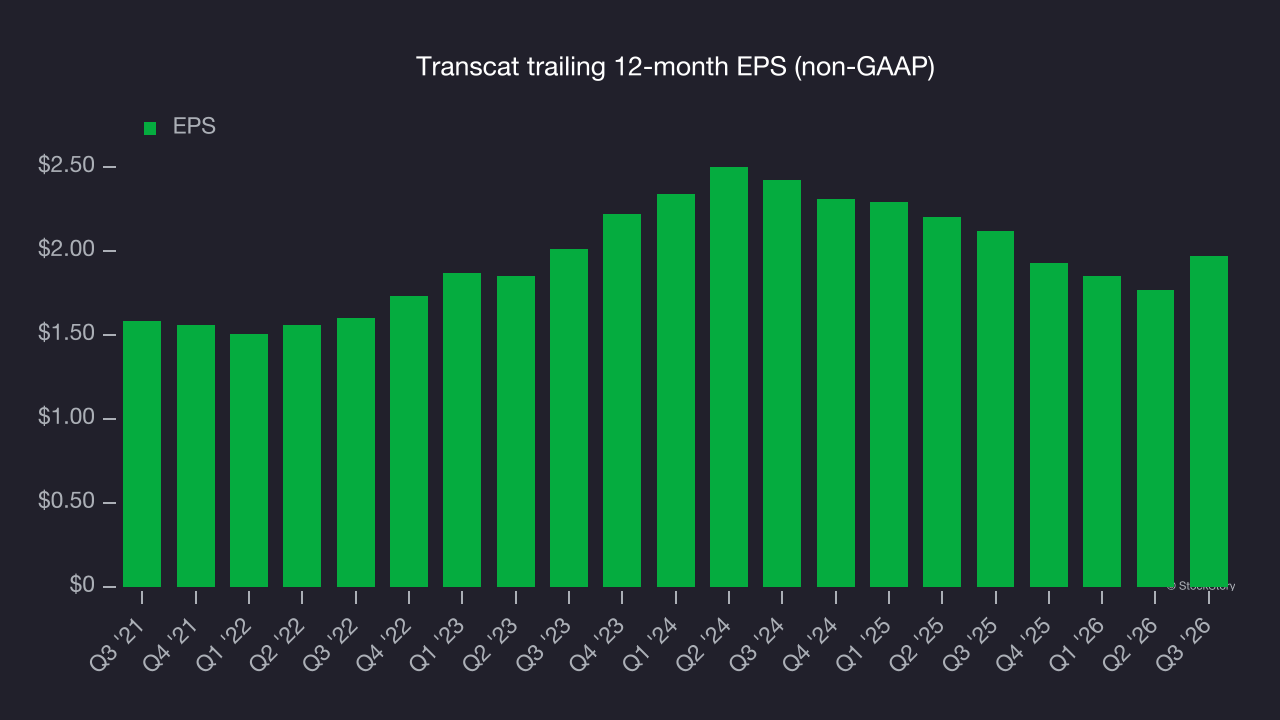
A closer look at Transcat’s earnings helps explain the drivers of its performance. As noted earlier, Transcat’s operating margin was flat this quarter but declined by 2.1 percentage points over the last five years. Its share count also grew by 25.7%, meaning the company not only became less efficient with its operating expenses but also diluted its shareholders. 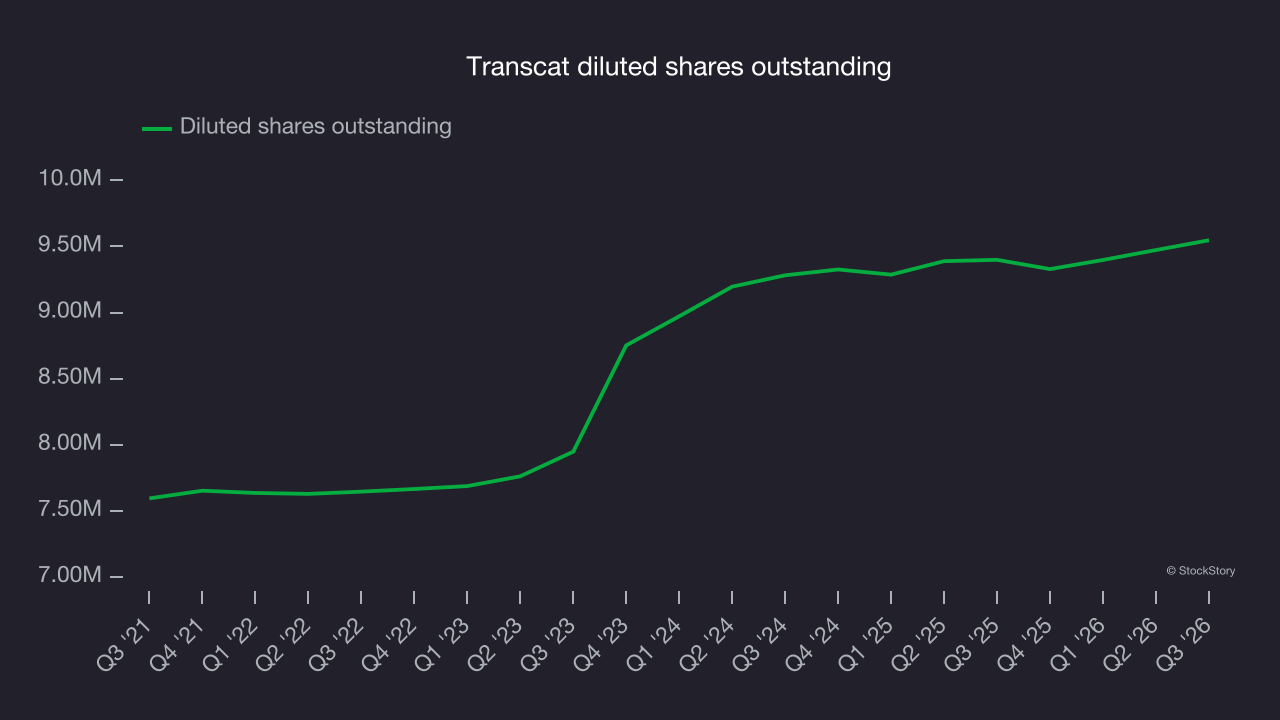
As with revenue, examining EPS over a shorter period can reveal changes in the business.
For Transcat, its two-year annual EPS declines of 9.8% show it’s continued to underperform. These were poor results by any measure.
In Q3, Transcat reported adjusted EPS of $0.64, up from $0.44 in the same quarter last year. This result easily cleared analysts’ consensus estimates, a positive for shareholders. Over the next 12 months, Wall Street expects Transcat’s full-year EPS to grow 6.4% from $1.97 to $2.10, according to S&P.
Key takeaways from Transcat’s Q3 results
Transcat delivered a solid quarter, with EBITDA beating Wall Street’s consensus estimates by a wide margin and EPS also topping analysts’ consensus expectations. Shares remained flat at $89.40 immediately after the results.
For investors considering Transcat, what happened in the latest quarter matters, but not as much as longer-term business quality and valuation when deciding whether to invest in the stock. Read the full research report for more on Transcat (it’s free).